

GBP price, news and analysis:
- The recent strong climb in GBP/USD looks to be running out of steam and a correction lower is now on the cards.
- That in part reflects a strengthening USD as the markets focus on rising US Treasury yields.
- Meanwhile, the latest UK inflation data came in higher than the consensus forecast but that has had little impact on GBP.
GBP/USD correction due
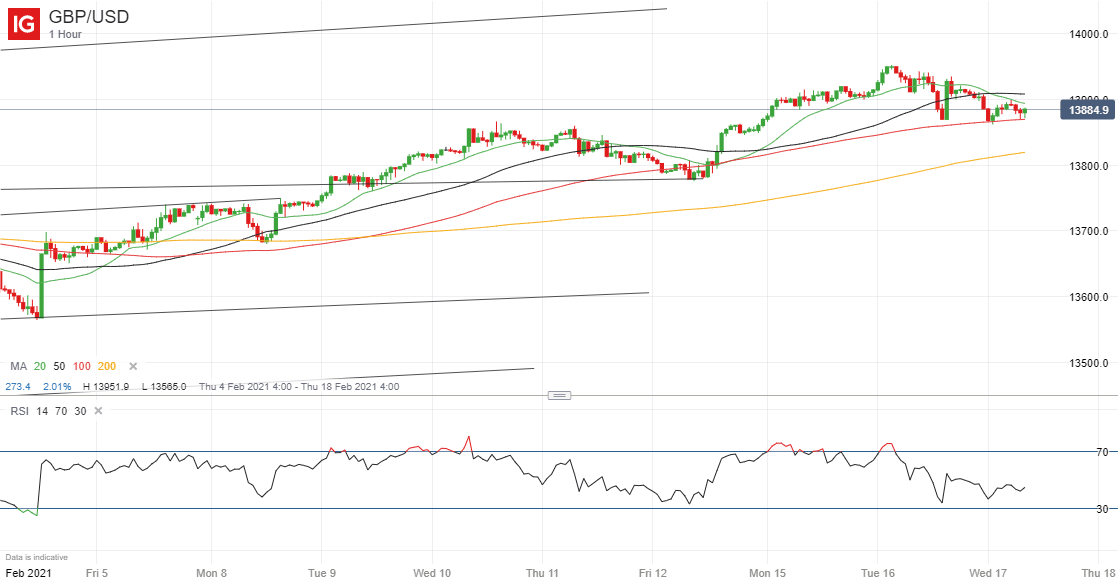
The recent strength in GBP/USD looks to be running out of steam and a correction lower is looking more and more likely after the pair failed to reach the 1.40 level, topping out around 1.3950 Tuesday.
GBP/USD Price Chart, Hourly Timeframe (February 4-17, 2021)
Source: IG (You can click on it for a larger image)
Recommended by Martin Essex, MSTA
Download our Q1 GBP forecast
For now, the principal driver seems to be rising yields on US Treasury bonds and notes as the rollout of coronavirus vaccines leads to hopes that the US economy is on the way to recovery, potentially leading to rising US inflation.
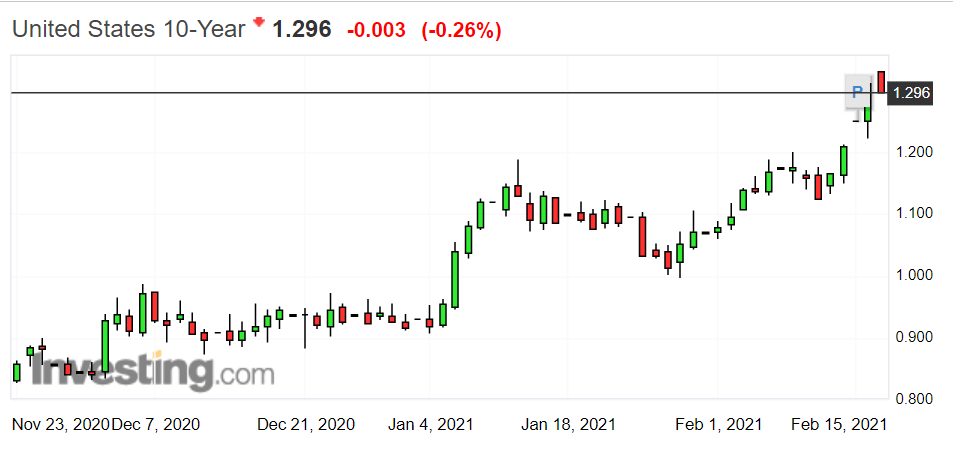
Source: Investing.com (You can click on it for a larger image)
In the meantime, UK inflation data for January were released early Wednesday and showed inflation above the consensus forecasts of economists polled by the news agencies.

Source: DailyFX calendar (you can click on it for a larger image
The figures have had little impact, however, on GBP/USD – which continues to be driven principally by the USD side of the pair.
| Change in | Longs | Shorts | OI |
| Daily | 5% | -8% | -3% |
| Weekly | 14% | -9% | -1% |
You can check out how inflation data impact currency rates by clicking here
— Written by Martin Essex, Analyst
Feel free to contact me on Twitter @MartinSEssex
Be the first to comment