

GBP/USD – Prices, Charts, and Analysis
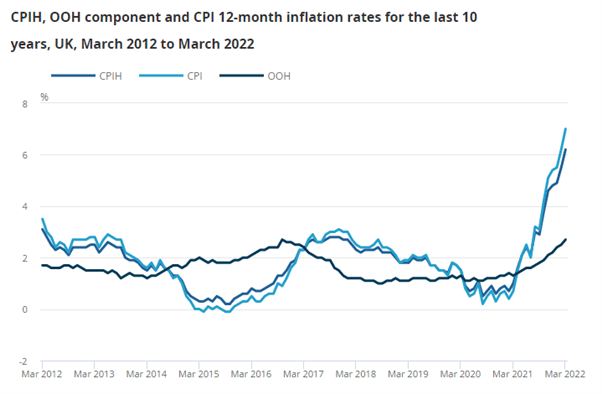
UK headline inflation hit 7% in March, beating market expectations of 6.7% and February’s 6.2%, as fuel and food costs pushed ever higher. Inflation is expected to increase further in the coming months – the BoE recently warned that CPI may exceed 8% in Q2 – leaving the BoE in a delicate position ahead of next month’s monetary policy meeting.
Market expectations are currently implying that the UK central bank will hike interest rates by a further 25 basis points in May but a 50 basis point increase cannot be ruled out, especially if the BoE is trying to get ahead of inflation. With the Federal Reserve already set to hike rates by 50bps at its next two meetings, the gap between UK and US yields may widen further, weighing on GBP/USD.
For all market-moving economic data and events, refer to the DailyFX calendar
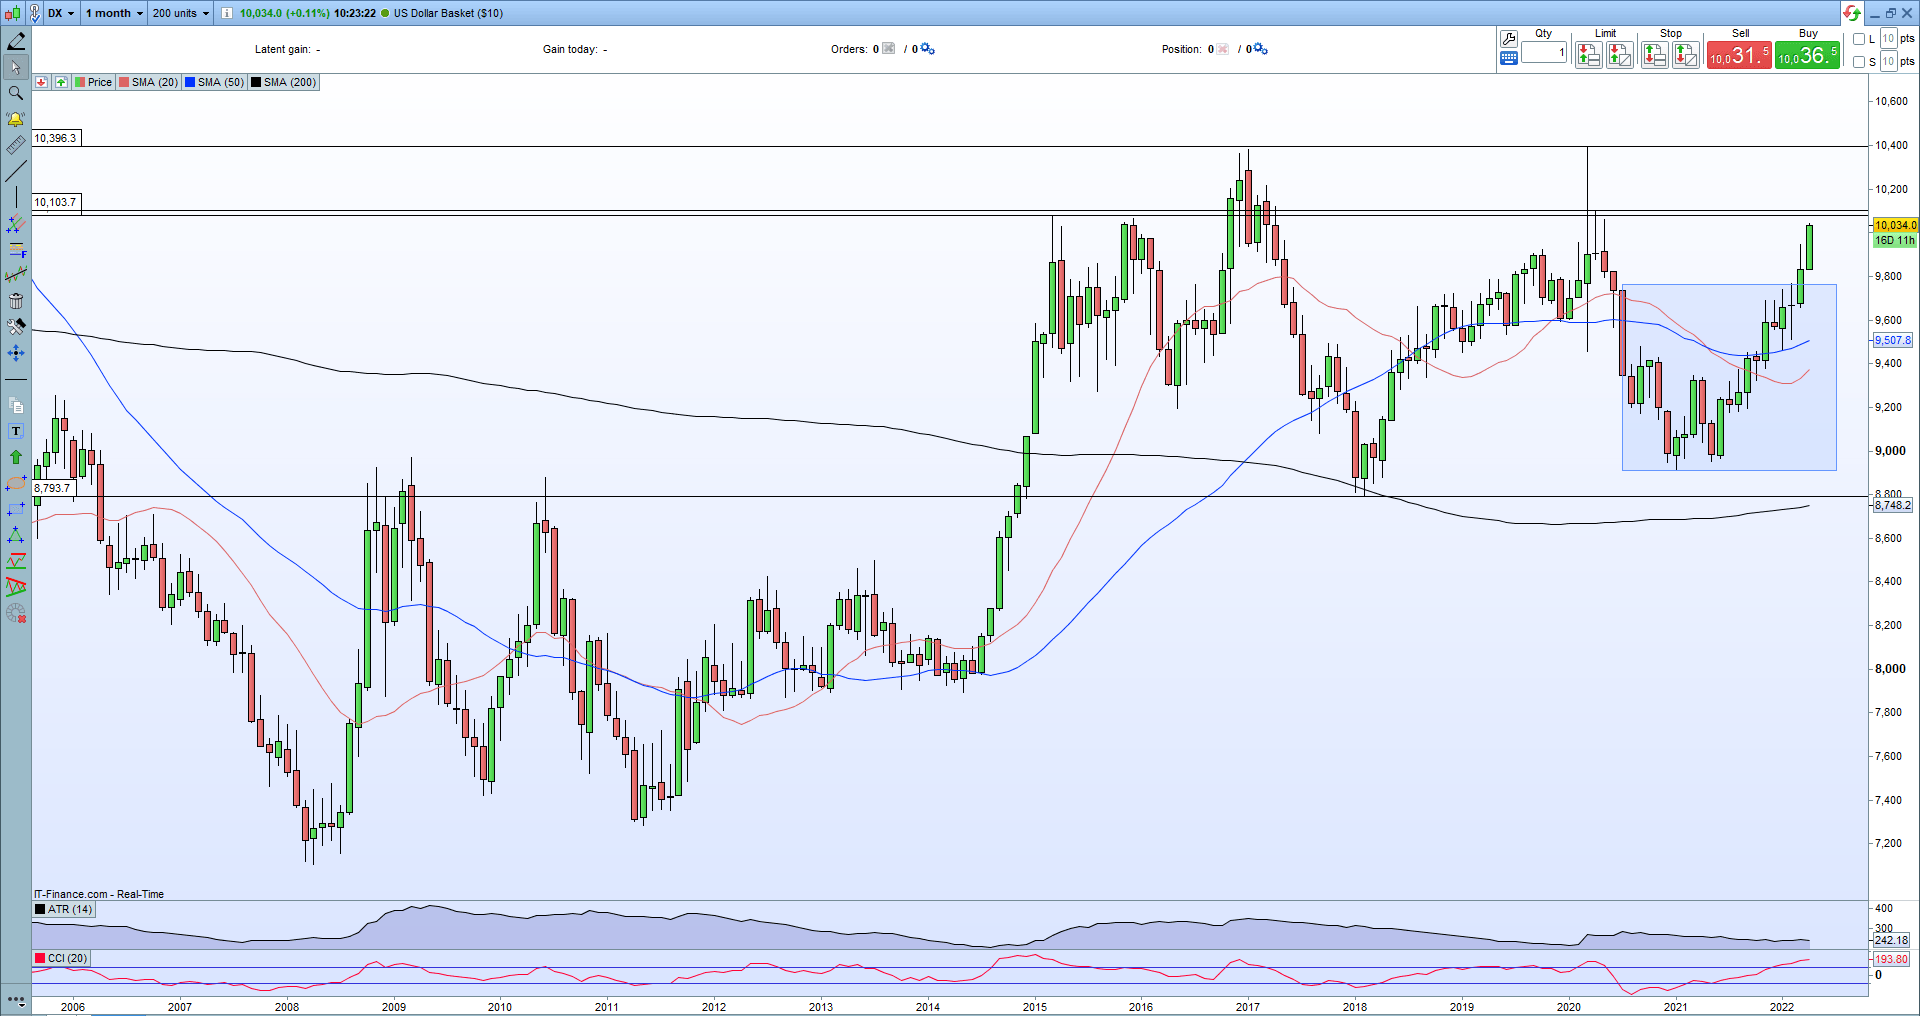
The US dollar continues to go from strength to strength with the US dollar basket (DXY) at highs last seen in May 2020. The monthly DXY chart shows the constant move higher in the dollar basket over the last 10 months.
US Dollar Basket (DXY) Monthly Price Chart – April 13, 2022
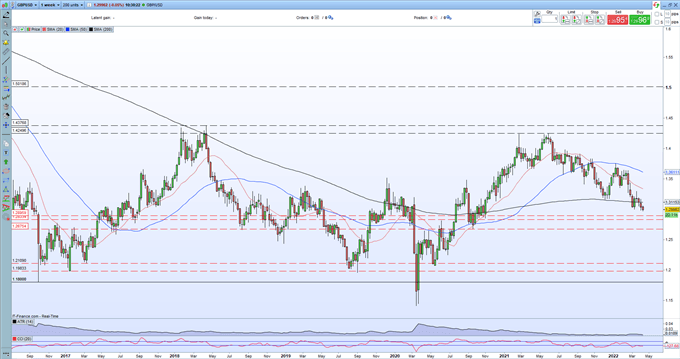
The weekly GBP/USD chart shows how a combination of US dollar strength and Sterling weakness has produced an unbroken series of lower highs and lower lows, sending the pair to a near two-and-a-half-year low. A cluster of prior lows between 1.2835 and 1.2896 may provide short-term support, but if this zone is broken the September 2020 swing low at 1.2675 comes into play.
GBP/USD Weekly Price Chart – April 13, 2022
Retail trader data show 76.18% of traders are net-long with the ratio of traders long to short at 3.20 to 1. The number of traders net-long is 2.81% higher than yesterday and 13.60% higher from last week, while the number of traders net-short is 3.18% lower than yesterday and 18.05% lower from last week.
We typically take a contrarian view to crowd sentiment, and the fact traders are net-long suggests GBP/USD prices may continue to fall. Traders are further net-long than yesterday and last week, and the combination of current sentiment and recent changes gives us a stronger GBP/USD-bearish contrarian trading bias.
What is your view on Sterling – bullish or bearish?? You can let us know via the form at the end of this piece or you can contact the author via Twitter @nickcawley1.
Be the first to comment