

GBP/USD started a fresh decline from the 1.2600 resistance zone. GBP/JPY is declining and remains at a risk of more losses below 165.00.
Important Takeaways for GBP/USD and GBP/JPY
· The British Pound started a fresh decline after it failed near 1.2600 against the US Dollar.
· There was a break below a declining channel with support near 1.2465 on the hourly chart of GBP/USD.
· GBP/JPY is gaining bearish momentum below the key 166.50 support zone.
· There was a break below a major bullish trend line with support near 167.35 on the hourly chart.
GBP/USD Technical Analysis
This past week, the British Pound attempted an upside break above the 1.2600 resistance against the US Dollar. The GBP/USD pair failed to gain bullish momentum and started a fresh decline from the 1.2580 zone.
There was a sharp decline below the 1.2500 support and the 50 hourly simple moving average. Besides, there was a break below a declining channel with support near 1.2465 on the hourly chart of GBP/USD. The bears gained strength and the price declined below the 1.2350 support zone.
A low is formed near 1.2262 on FXOpen and the pair is now consolidating losses. On the upside, the pair is facing resistance near the 1.2300 level. The next major hurdle is near the 1.2320 level. It is close to the 23.6% Fib retracement level of the downward move from the 1.2517 swing high to 1.2262 low.
An upside break above 1.2320 could set the pace for a move towards the 1.2400 resistance zone. It is near the 50% Fib retracement level of the downward move from the 1.2517 swing high to 1.2262 low.
If there is no upside break above 1.2320, the pair could start a fresh decline. An immediate support is near the 1.2260. The next major support is near the 1.2220 level. If there is a break below the 1.2220 support, the pair could test the 1.2150 support.
GBP/JPY Technical Analysis
The British Pound also started a fresh decline from the 168.70 zone against the Japanese Yen. The GBP/JPY pair gained pace below the 168.00 and 167.50 support levels.
There was a clear move below the 167.00 level and the 50 hourly simple moving average. Besides, there was a break below a major bullish trend line with support near 167.35 on the hourly chart. The pair even declined below the 50% Fib retracement level of the upward move from the 162.90 swing low to 168.71 high.
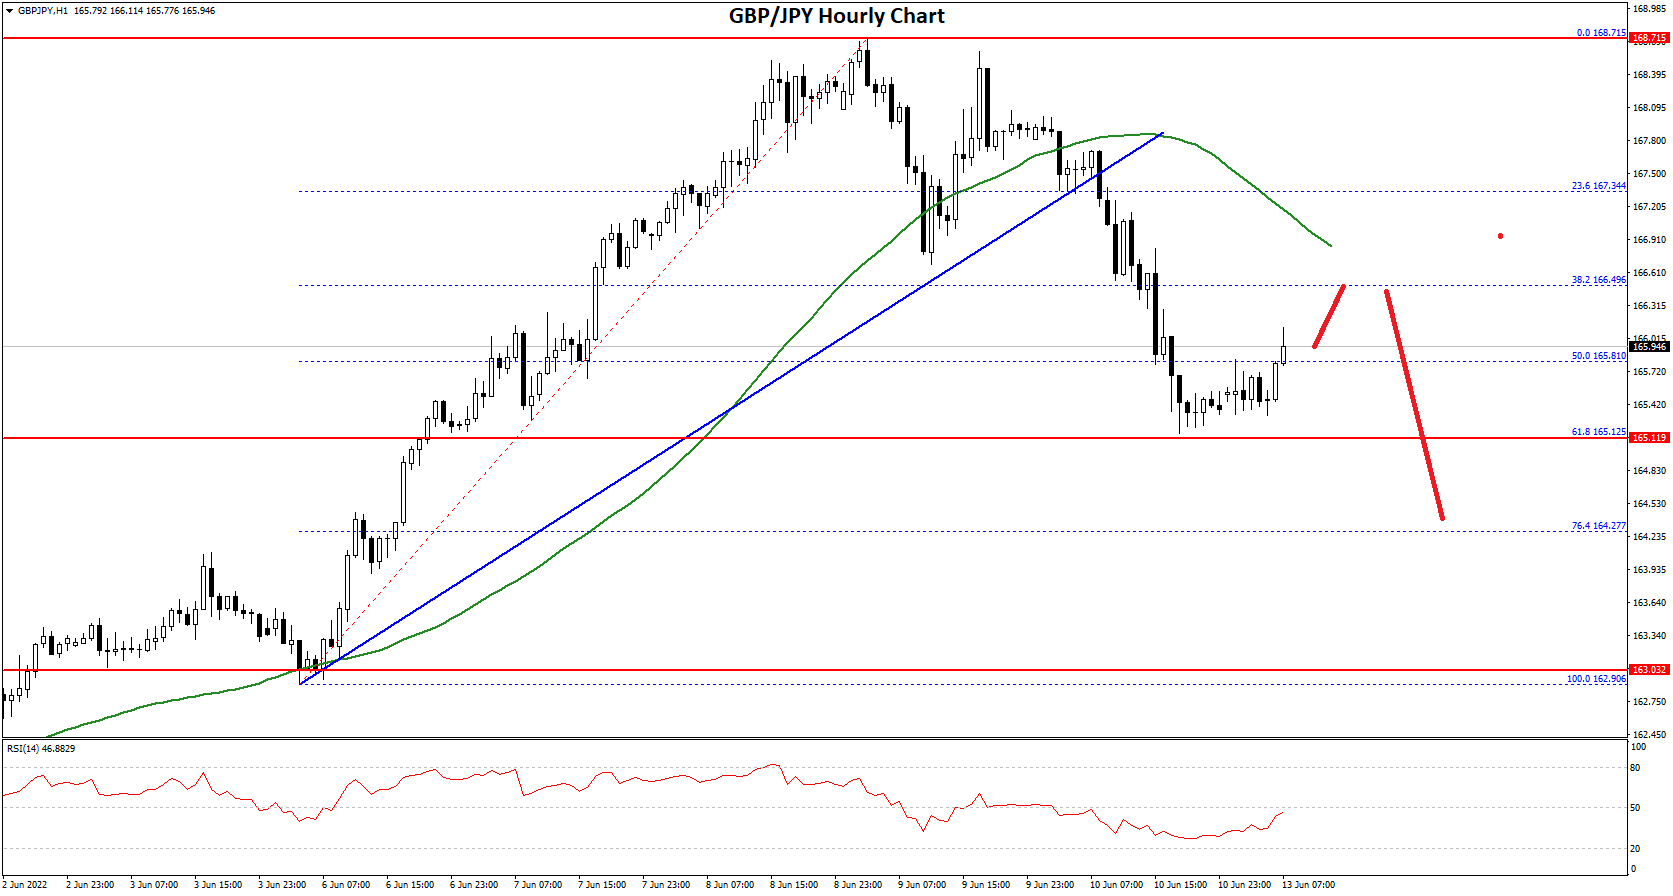
It even declined below 165.50 and traded close to 165.00. There was a test of the 61.8% Fib retracement level of the upward move from the 162.90 swing low to 168.71 high.
On the upside, GBP/JPY is facing resistance near the 166.50 level. The next key resistance could be 167.00 and the 50 hourly simple moving average. A clear break above the 167.00 resistance could push the pair towards the 167.50 resistance.
On the downside, an initial support is near the 165.25 level. The next major support is near the 165.00. If there is a downside break below the 165.00 support, the pair could decline towards the 163.50 support zone. Any more losses might send the pair towards the 162.00 level in the near term.
This forecast represents FXOpen Markets Limited opinion only, it should not be construed as an offer, invitation or recommendation in respect to FXOpen Markets Limited products and services or as financial advice.

Be the first to comment