

Oat_Phawat/iStock via Getty Images
Introduction
Note: Galiano Gold (NYSE:GAU) currently operates and manages the Asanko gold mine or AGM, located in Ghana, West Africa, jointly owned with Gold Fields (GFI). Also, Galiano Gold owns the Asumura project indicated below.
Note: I have followed GAU quarterly since 2021 with three articles and counting. This new article is a quarterly update of my article published on April 1, 2022.
GAU Map Presentation 1Q22 (Galiano Gold)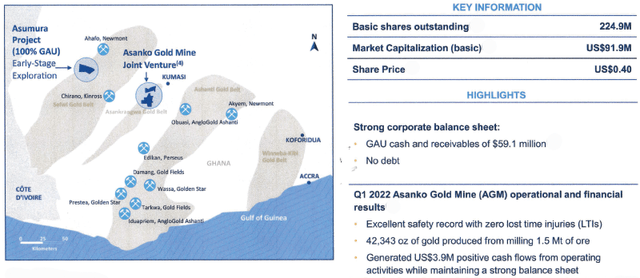
On May 5, 2022, Galiano Gold reported financial results for the first quarter of 2022.
1 – 1Q22 Results Snapshot
Note: On March 23, 2022, the company announced that Fausto Di Trapani had stepped down as CFO of the company to pursue another opportunity. Mr. Di Trapani departed the company on April 14, 2022, following which Matt Freeman was appointed as CFO, in line with the company’s succession plan.
M. Fausto Di Trapani has been with the company for a decade and “was instrumental in the financing, construction, operation, and joint venturing of the Asanko Gold Mine in Ghana,” said Matt Badylak, Galiano’s President and Chief Executive Officer.
GAU 1Q22 highlights (Galiano Gold)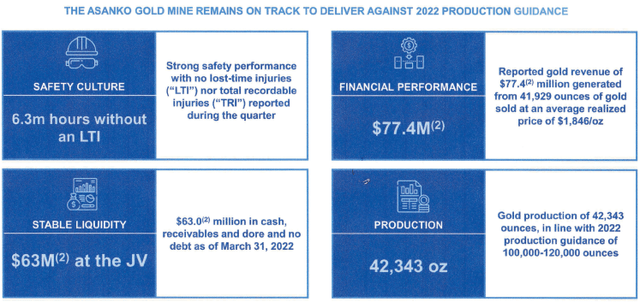
Galiano Gold reported that gold production at the Asanko gold mine in Ghana (“AGM”) was 42,343 ounces during 1Q22, down 20.1% from 59,999 ounces produced in 1Q21. However, production was in line with guidance. The significant drop yearly was due to the average recovery rate, which dropped from 95% to 69% this quarter, as announced on February 22, 2022.
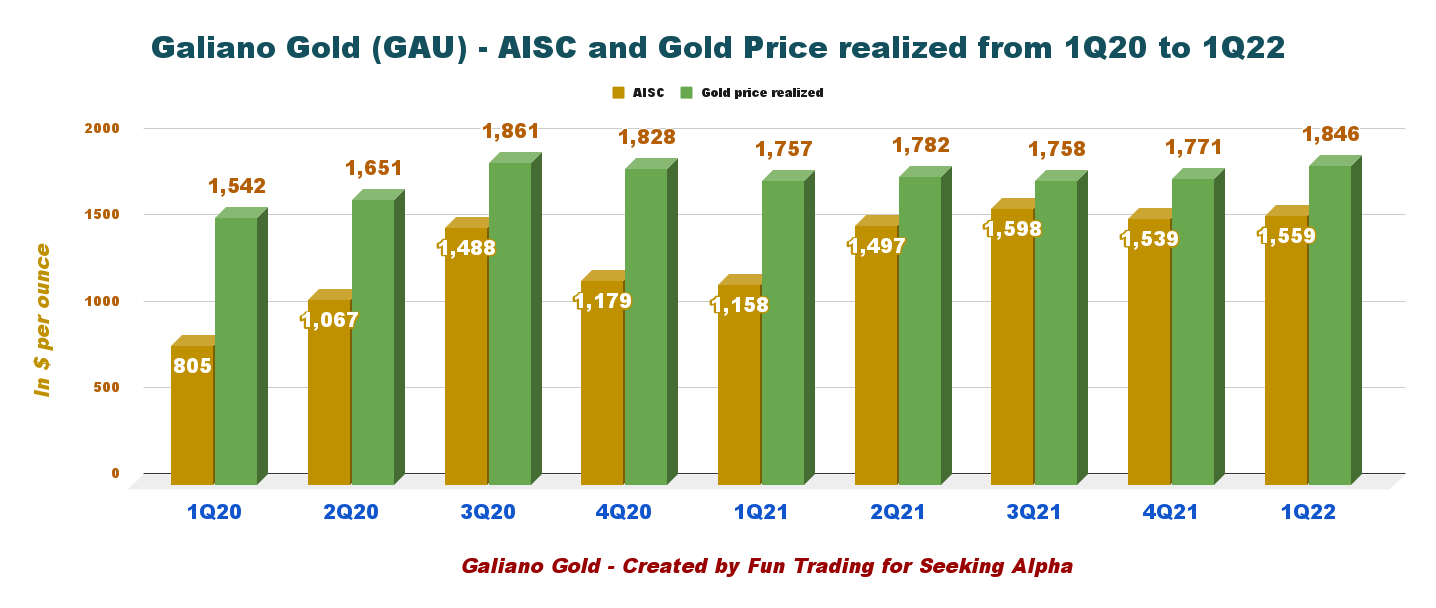
Total cash costs per ounce were $1,361, and all-in sustaining costs (“AISC”) were $1,559/oz during the quarter.
The company reported a net loss of $13.6 million during the quarter after recognizing a $21.0 million severance liability due to workforce optimization.
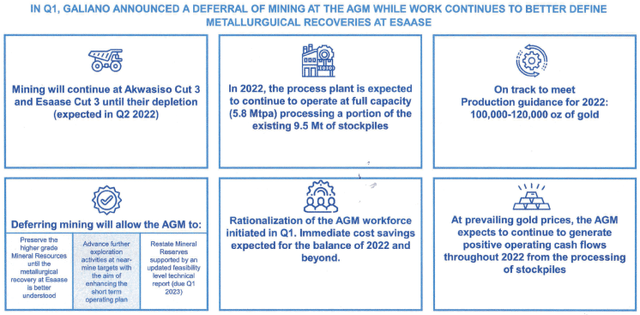
Workforce optimization: Undertook a process of rationalizing the AGM’s workforce. Severance notifications were issued and personnel necessary to maintain current operations have been retained with new employment contracts. Management expects to realize near‐term and sustainable cost savings and a more streamlined and efficient operation over the remaining life of mine as a result of the rationalization.
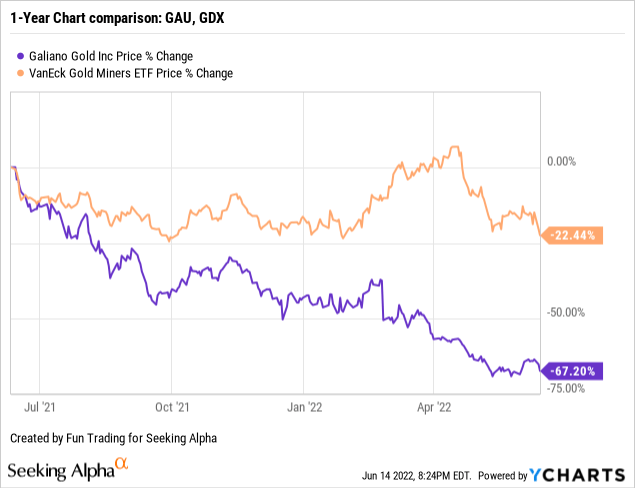
2 – Stock Performance
Galiano Gold has significantly underperformed the VanEck Gold Miners ETF (GDX) and is now down a whopping 67% on a one-year basis.
3 – Investment Thesis
Galiano Gold’s business model is too limited to be regarded safe from a long-term investor’s perspective. The company owns 45% of the Joint Venture AGM, and the business model is relatively weak.
Currently, the sole interest here is to use GAU as a trading tool, but the constant weakening of the stock has been brutal even from a short-term trading perspective. On a positive note, I noticed some recent insider buying that could suggest possible support around $0.40.
Independent Chairman, Paul Wright, recently bought CA$62k worth of stock, for CA$0.50 per share. Even though that isn’t a massive buy, it did increase their holding by 71%, which is arguably a good sign.
Thus, I recommend trading mainly short-term LIFO GAU using technical analysis.
Galiano Gold – 1Q22 Balance Sheet. The Raw Numbers
Note: The Joint Venture is split 50/50 for the 90% economic interest, with Ghana Government holding 10%. Therefore, Galiano Gold owns 45% of the Joint Venture.
| Galiano Gold | 1Q21 | 2Q21 | 3Q21 | 4Q21 | 1Q22 |
| Total Revenues $ million (100% basis) | 110.80 | 95.20 | 85.28 | 91.08 | 75.53 |
| Quarterly Earnings $ million | 13.03 | 5.00 | 4.12 | -91.03 | -1.54 |
| EBITDA $ million | 13.08 | 5.06 | 4.17 | -91.01 | -1.49 |
| EPS (diluted) $ per share | 0.06 | 0.02 | 0.02 | -0.41 | -0.01 |
| Operating Cash Flow $ million | -4.68 | -3.13 | -2.84 | -2.29 | -3.17 |
| CapEx in $ million | 1.49 | 0.00 | 0.00 | 0.03 | 0.00 |
| Free Cash Flow | -6.16 | -3.14 | -2.84 | -2.30 | -3.17 |
| Total cash in $ million (100% basis) | 61.24 | 58.55 | 55.84 | 53.52 | 50.38 |
| Total LT Debt (incl. current) in $ million | 0.00 | 0.00 | 0.00 | 0.00 | 0.00 |
| Shares Outstanding (diluted) in million | 225.02 | 225.29 | 225.07 | 224.95 | 224.94 |
Source: Company release M&A. Fun Trading files.
* Indicated by the company
Analysis: Revenues, Free Cash Flow, Debt, And Gold Production
1 – Quarterly revenues were $77.53 million in 1Q22 (100% basis)
GAU Quarterly Balance Sheet history (Fun Trading) Galiano Gold announced that 1Q22 gold revenue was $77.532 million based on 41,929 ounces sold at an average gold realized price of $1,846 per ounce. Net loss in 1Q22 was $1.54 million, or 0.01 per diluted share. The decrease in revenue quarter over quarter was due to a 33% reduction in sales volumes, partly offset by a 5% increase in realized gold prices.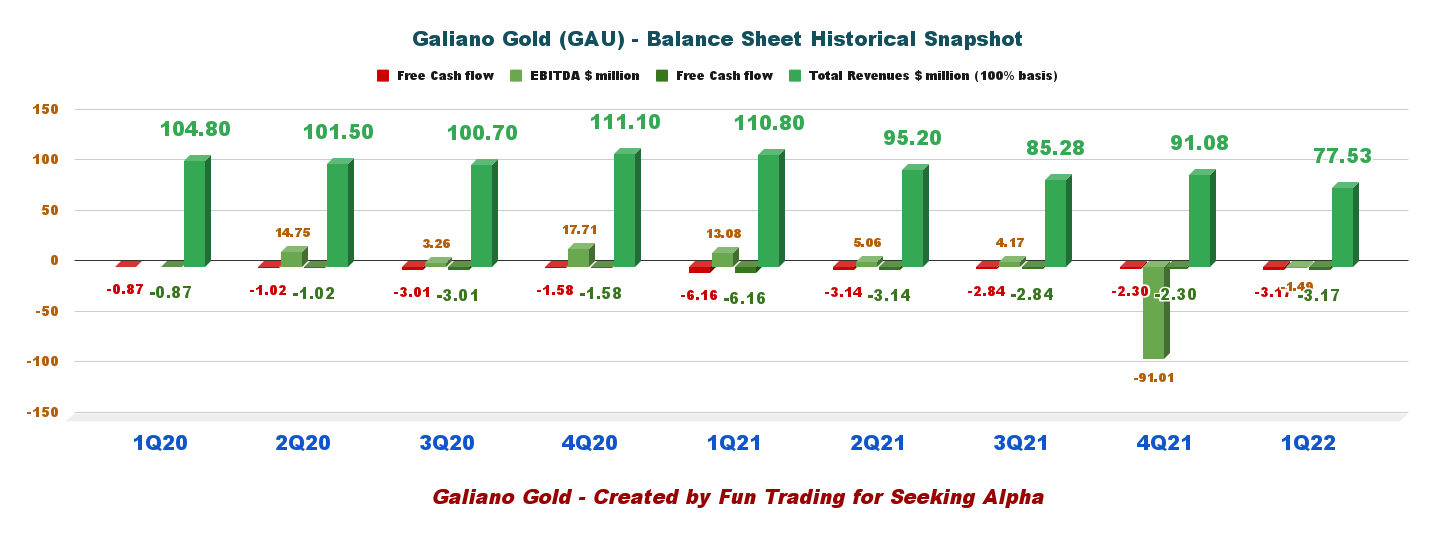
2 – Free Cash Flow Was A Loss Of $3.17 Million In 1Q22
Free cash flow is cash flow from operations minus CapEx. Trailing 12-month free cash flow ttm was a loss of $11.45 million, with a loss of $3.17 million in 1Q22.
3 – No Debt In 1Q22 And Total Cash Of $50.38 Million.
GAU Quarterly Cash history (Fun Trading) The cash position continues to go down, as seen in the chart above but is still considered stable. Galiano had $50.38 million in cash on hand, $13.1 million in gold sales receivables, $4.1 million in gold on hand, and no debt as of March 31, 2022.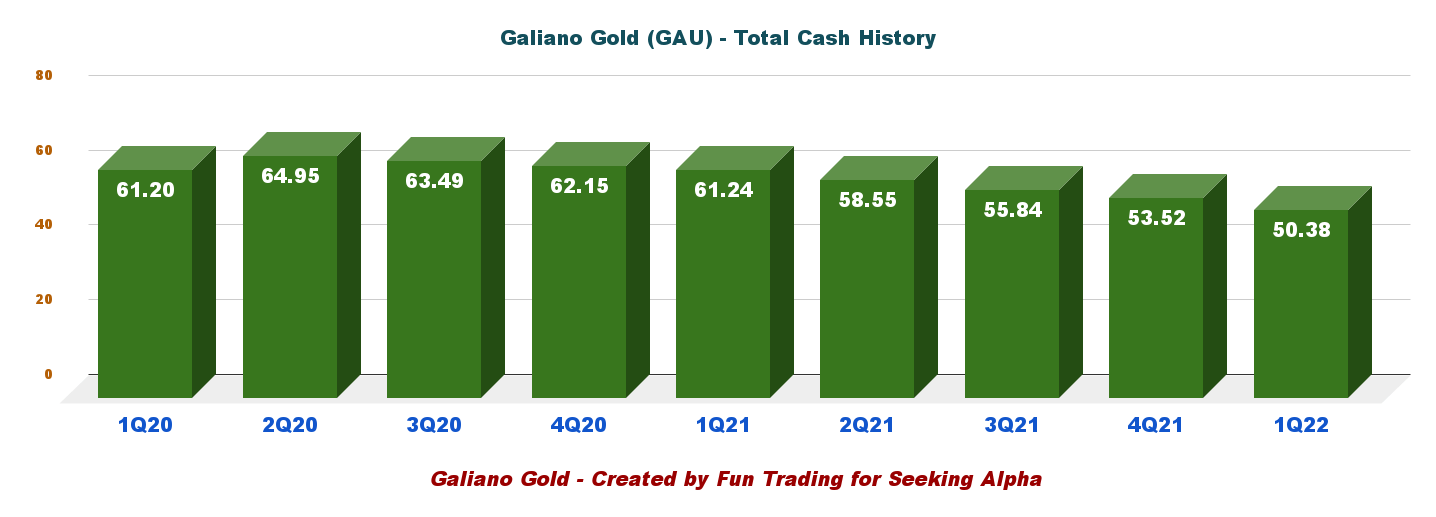
4 – Quarterly Gold Production Analysis
Galiano Gold reported that gold production at the Asanko gold mine in Ghana was 42,343 ounces during 1Q22 and sold 41,929 ounces, down 29.4% compared to 1Q21.
GAU Quarterly gold production history (Fun Trading) GAU Update 1Q22 (Galiano Gold) GAU Gold price and AISC history (Fun Trading)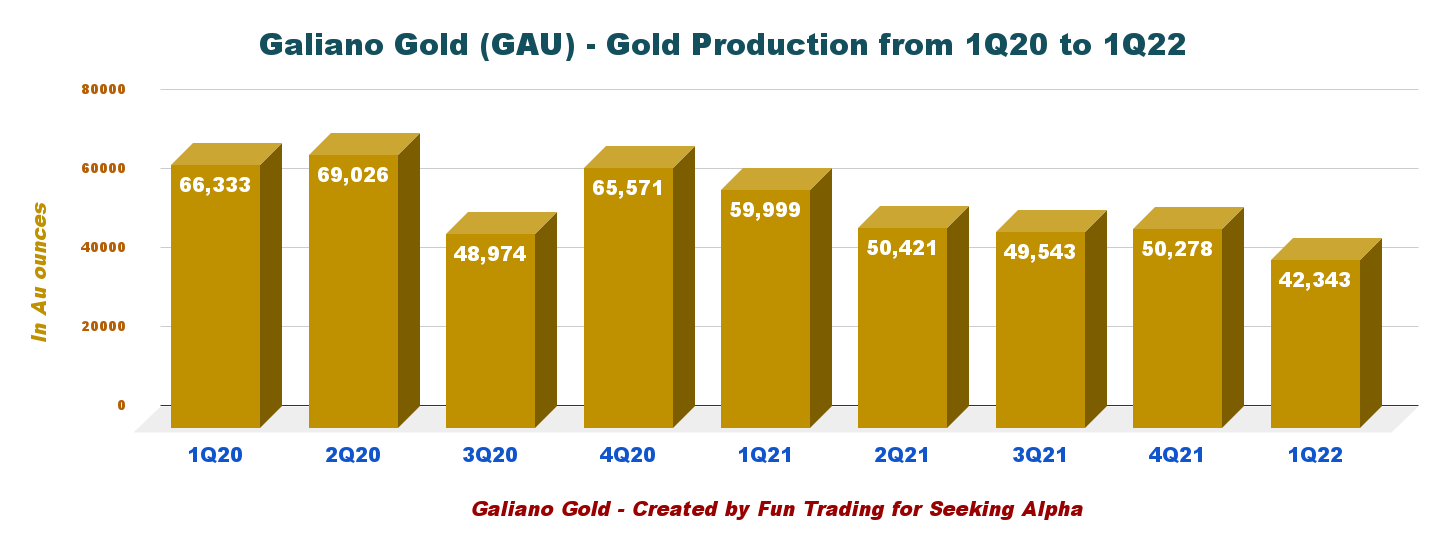
5 – Galiano Gold Provided An Updated AGM Mineral Resources
Mineral resource measured and indicated is now 2.904 Moz.
GAU: Mineral Reserves update (Galiano Gold)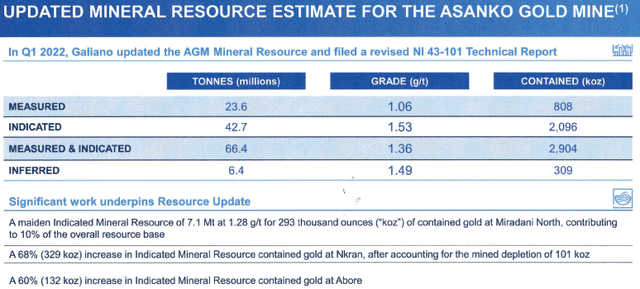
Technical Analysis And Commentary
GAU TA Chart short term (Fun Trading)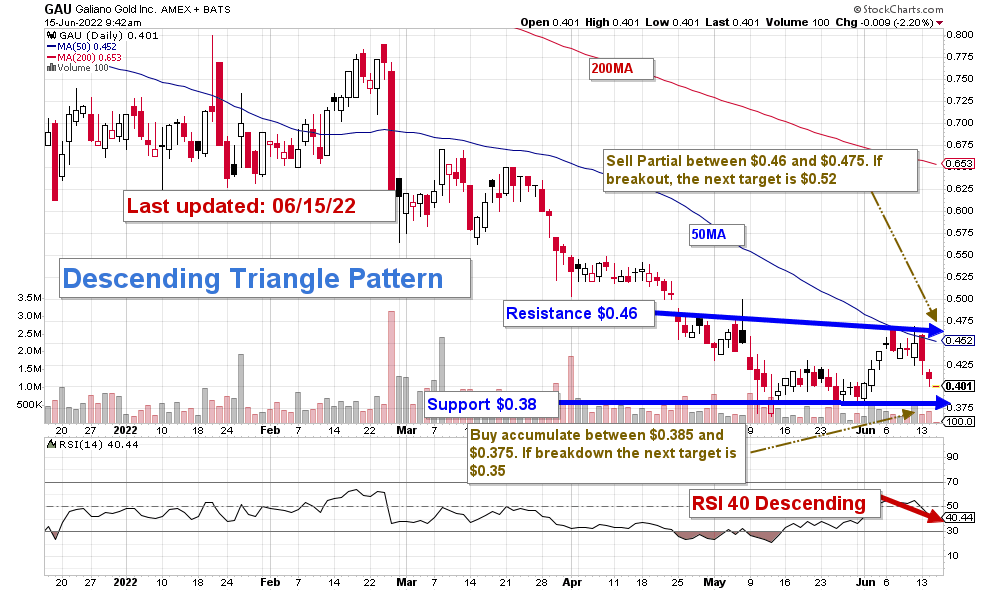
GAU forms a descending triangle pattern with resistance at $0.46 and support at $0.38. The trading strategy is to sell partially between $0.46 and $0.475 and buy/accumulate between $0.385 and $0.375, whichever comes first. We could also consider $0.405 a new support, and I suggest starting accumulating at or below $0.405 with a potential low at $0.375.
Gold may turn bearish if the FED starts to get serious about inflation. In this case, GAU may drop as low as $0.35. We still await a 50-point or 75-point hike in June and many more hikes in 2022.
Conversely, if the gold price turns bullish, realizing that the FED is clueless and unable to act timely, GAU could eventually break out of the pattern and reach $0.62 again.
Thus, I recommend trading LIFO with a medium position and keeping a tiny core long position for a higher target build at or below $0.35.
Watch the gold price like a hawk.
Note: The LIFO method is prohibited under International Financial Reporting Standards (IFRS), though it is permitted in the United States by Generally Accepted Accounting Principles (GAAP). Therefore, only US traders can apply this method. Those who cannot trade LIFO can use an alternative by setting two different accounts for the same stock, one for the long-term and one for short-term trading.
Warning: The TA chart must be updated frequently to be relevant. It is what I am doing in my stock tracker. The chart above has a possible validity of about a week. Remember, the TA chart is a tool only to help you adopt the right strategy. It is not a way to foresee the future. No one and nothing can.
Author’s note: If you find value in this article and would like to encourage such continued efforts, please click the “Like” button below to vote for support. Thanks.
Be the first to comment