

Igor Kutyaev
Thesis
As of the writing of this article, Monday in the a.m., Chinese equities are selling-off substantially pre-market, with the iShares China Large-Cap ETF (NYSEARCA:FXI) down more than -5%. The fund seeks to track the investment results of an index composed of large-capitalization Chinese equities that trade on the Hong Kong Stock Exchange.
The weekend that just passed saw the conclusion of China’s 20th Party Congress, where Xi was awarded with a third five-year term as leader of the ruling Communist Party. Xi’s re-election was not surprising, but the manner in which he solidified his grip on power was. Former Chinese president Hu Jintao was led out of the party congress during a session, for all the world to see. A crude power play, the action speaks loudly to Xi’s grip on the Communist Party. With the economy in a recession, despite official figures that show growth, the market has been further spooked. The unchallenged Xi likely translates into more Covid related lock-ins, and the expectations for international investment and corporate profits to be put on the back-burner. The markets have reacted by panic-selling.
China is an interesting place that does not fit the traditional investing framework. While investors can pour over traditional metrics such as P/E ratios, book values and EPS growth all day long, the true driver of the jurisdiction’s performance is the ruling party, namely the Communist Party. With a top-down approach, the party can spark a stock market rally by focusing on growth and investor friendly policies, or it can tank the market by regulatory actions and persistent Covid-shut ins as an example. A savvy investor should recognize China is a bit of a black-box, and short term trading signals are always going to be muddled and grey. Just as China did not waver in its resolve to claim back Hong Kong after a 99-year lease, an investor in the jurisdiction should have a long-term mentality.
With the FXI price back to its March 2006 price (almost 20 years back !), an investor needs to step-back and try to get a macro understanding of the overall picture. Can anyone predict what will occur next week or next month in China? We believe that is not the case. Do we feel China will put itself on an economic destructive path and suddenly experience a decade of zero-growth? Again the answer here is no.
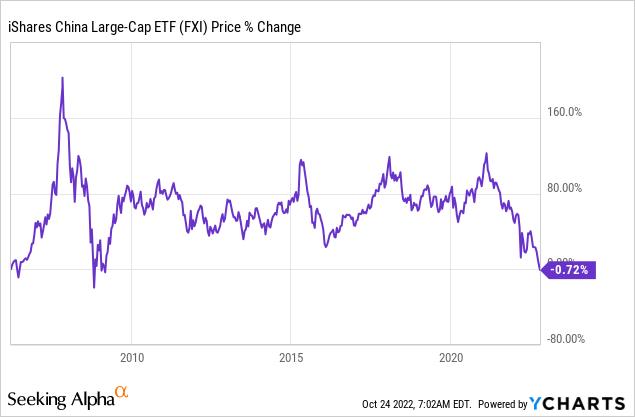
As we can see from the above graph, FXI is back to its March 2006 price level, despite the substantial progress achieved by the jurisdiction since that point in time.
We are big fans of the Buffett indicator, which compares the stock market capitalization to the GDP of the respective country. If we look at China through that lens, we can see the country’s GDP has been steadily increasing in the past 20 years:
China GDP (Gurufocus.com)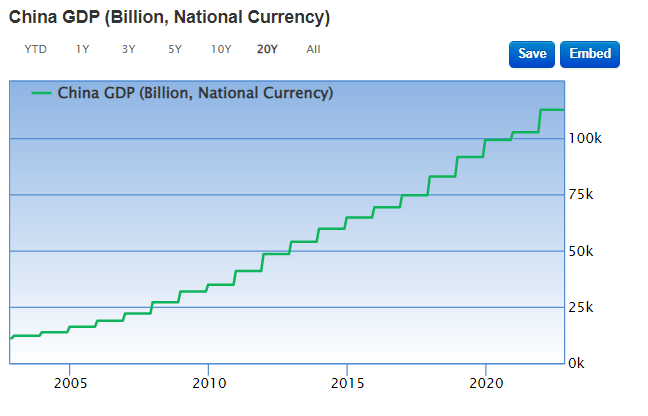
Also, currently, the China Buffett indicator is signaling undervaluation:
China Buffett Indicator (Gurufocus.com)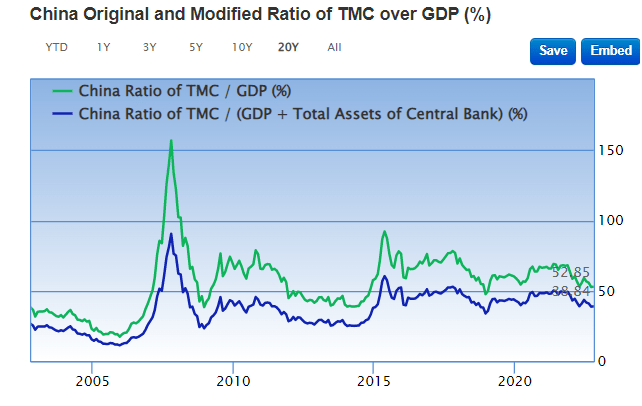
If we look at the green line we will notice it is around 50%. A figure below 54% indicates modest undervaluation. We believe that China is going to continue to grow, albeit at a more reduced pace. Furthermore we think that long term, once the short-term politics drown out, there is scope for more stability. All these factors should translate into higher GDP figures, and a higher valuation for the stock market.
In the below “Performance” section we compare FXI to other China ETFs and CEFs. The analysis reveals an interesting fact – long term, actively managed CEFs tend to significantly outperform the index and the iShares China Large-Cap ETF. We believe this is due to the active name selection performed by CEF managers, and their propensity to identify trends and preferred sectors. For investors considering buying Chinese equities when “blood is running in the street” like in today’s market, we are of the opinion that starting positions in a CEF is the most advantageous solution. Our preference is tilted toward The China Fund (CHN), which is a CEF and was covered by us here.
Performance
FXI is the outperformer on a year to date basis:
YTD Total Return (Seeking Alpha)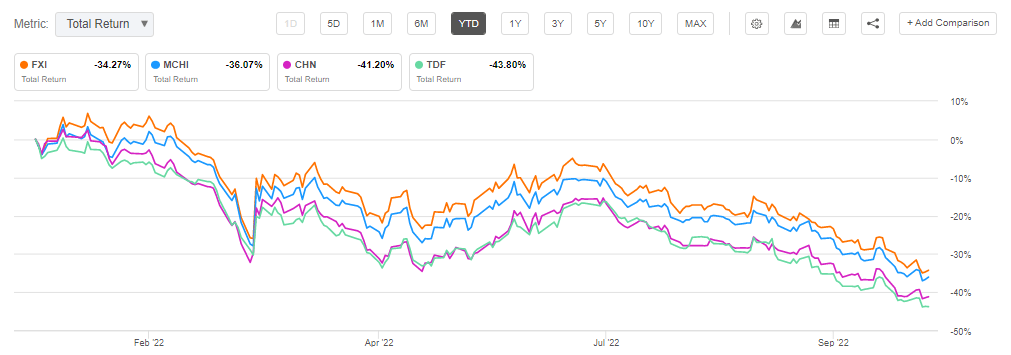
We wrote before regarding the underperformance of the CEFs this year due to the widening of the discount. However, on a longer time-frame we can start seeing how the ETFs start underperforming:
3Y Total Return (Seeking Alpha)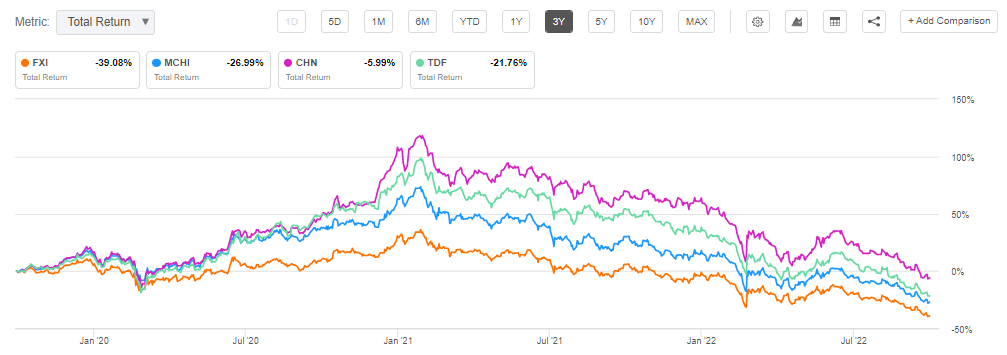
On a 3-year total return time-frame FXI is at the bottom of the cohort from a total return stand-point, with a massive 33% differential to the best performer CHN. The story is similar on a 5- and 10-year basis:
5Y Total Return (Seeking Alpha) 10Y Total Return (Seeking Alpha)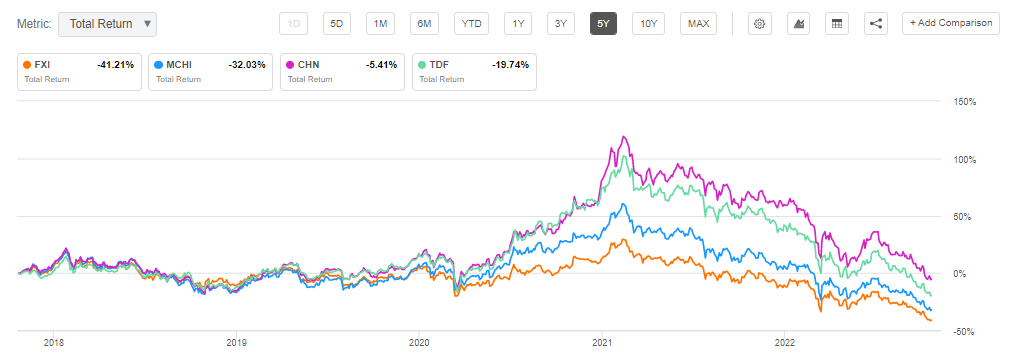
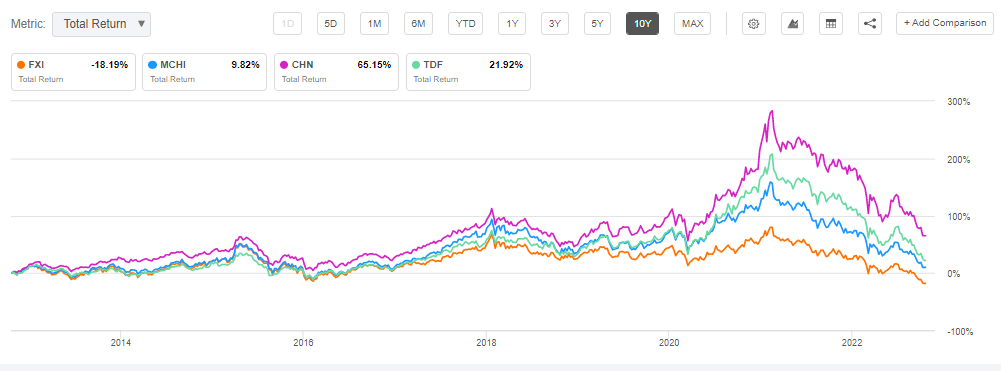
On a 10-year basis the differential between FXI and the best performer in the cohort is above 80% of total returns. That is a huge number and it speaks greatly to the advantages of an active management in the jurisdiction.
It is also interesting to note that up to 2020, when volatility was low and the markets were in a general bull trend, the differential between the CEFs and ETFs in the cohort was fairly slim. After the Covid crisis we started seeing substantial differences in performance due to asset selection. It no longer became a geographic macro story, but it started to be a sectoral one as well, with certain industries selected through active management performing better.
Holdings
As the name suggests, the fund is composed of large cap equities:
Morningstar Box (Morningstar)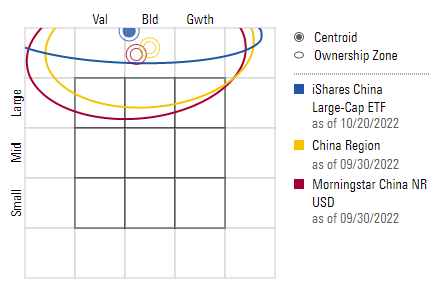
The top names are well known international behemoths:
Top Holdings (Fund Fact Sheet)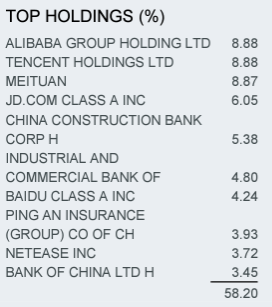
We can note that the fund is fairly concentrated with most of the top names exceeding a 5% portfolio threshold. In effect, the top 10 names account for almost 60% of the fund.
The sectoral breakdown points towards an overweight positioning in Consumer Discretionary and Financials:
Top Sectors (Fund Fact Sheet)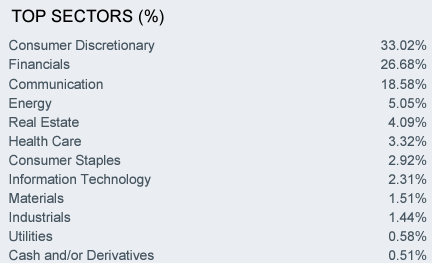
From a fundamentals standpoint the fund looks robust, with a conservative P/E ratio for its holdings:
Characteristics (Fund Fact Sheet)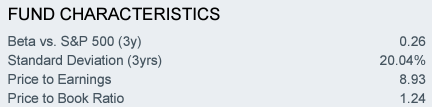
Conclusion
The iShares China Large-Cap ETF is a large cap Chinese equities fund. The vehicle is down over -34% this year on the back of the Asia equity market rout. The fund is now back to its March 2006 price level, almost 20 years ago! The movements have likely been driven by investors’ anxieties around Xi’s power-grab, and his policies of continued Covid lock-downs. Despite FXI being back to its 2016 price point, China’s GDP has been steadily growing in the past two decades. Using the Buffett indicator for the jurisdiction, we found out that Chinese stocks are now slightly undervalued. While we are of the opinion that Chinese economic data that was just released cannot be relied upon at face value, we do not think we are looking at a country with zero growth ahead. Investors who have long time horizons and understand that investing in Chinese equites is very much driven by macro political factors rather than intrinsic valuation models, are best served to start positions in CEFs rather than ETFs. Our analysis has shown that actively managed CEFs such as CHN have tended to significantly outperform long term.
Be the first to comment