

Philartphace/iStock Unreleased via Getty Images
Introduction
We have reached that time of year again when it is popular to offer up forecasts about where the markets may be headed for 2023. While my estimates rely on fundamental data, I offer a unique consideration of market fund flows and how they drive prices based on interest rates and corporate buybacks. Additionally, I track the Federal Reserve quantitative tightening programs closely as a major force in market liquidity and market performance. In over 30 years of market trading, education, and research, the future still never has been revealed to me and I have not won a single Powerball jackpot. I won’t ever pretend that I know with any certainty where the S&P 500 Index (SP500) will be a year from now. I will however, give you my best guess conditioned with every caution and see if you think these estimates have credibility. My guess is that the S&P 500 will reach 3240.76 at the end of December, 2023 combined with an extremely high degree of volatility next year.
Forecasting the S&P 500 for 2023
My approach to an educated guess of the S&P 500 in 2023, more than a year from today, applies these steps leveraging fundamental valuations.
- First, an analysis of future S&P 500 earnings forecasts to estimate market prices for general target ranges.
- Second, a look at corporate buybacks as one of the largest fund flows to see how these buying behaviors may be impacted by higher interest rates.
- Third, a measurement of the Federal Reserve balance sheet schedule into 2023 and the market impact from higher Fed fund rate projections.
- Lastly, I condition this forecast on infinite global market risks ranging from wars, disease, famine, shortages, fraud, currency manipulations, and political instability that can completely undermine the best narratives.
Analyzing the S&P 500 Valuation Ranges
Let’s start at the large scale macro levels and move into more detail. Current S&P 500 earnings valuations still remain more than a standard deviation above 70 year historical averages, but well off the highs at the start of 2022. At the writing of this article, the S&P 500 is 19.1% below its record high peak of 4,796.56 recorded on the first trading day of 2022, but still more than 40% above the historical average P/E ratio for the S&P 500.
Current Market Valuation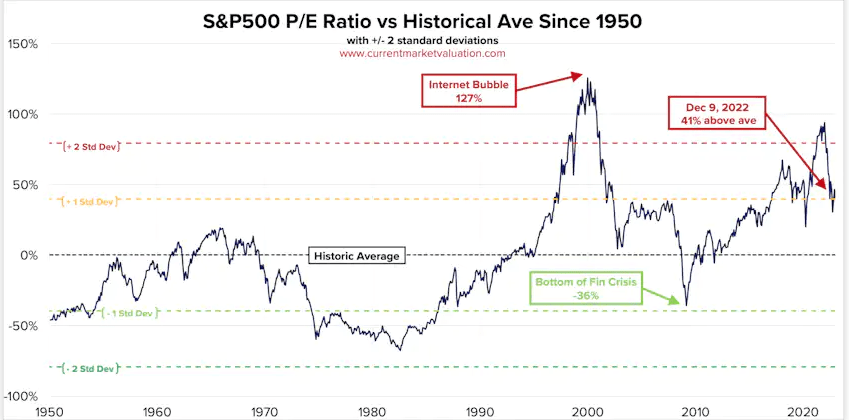
A reversion to the historical mean from current levels would put the S&P 500 down around 2,230 levels. Of course, if you pick different time periods, you get different historical means and different mean reversion estimates. The purpose of this exercise is to set some reasonable upper and lower bounds for forecasting the most likely price levels for the S&P 500 over a year out from today.
Current Market Valuation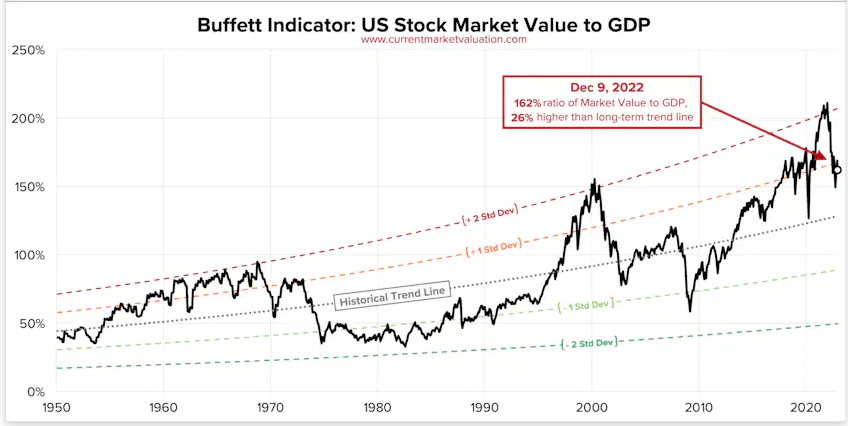
Using another long term valuation tool, the Buffett indicator, we can also gauge the U.S. stock market at one standard deviation above the historical 70 year mean relative to the U.S. GDP. These high level valuation averages are useful as we consider more recent fundamental market data with the context that there are higher probabilities of more downside risk into next year.
Yardeni.com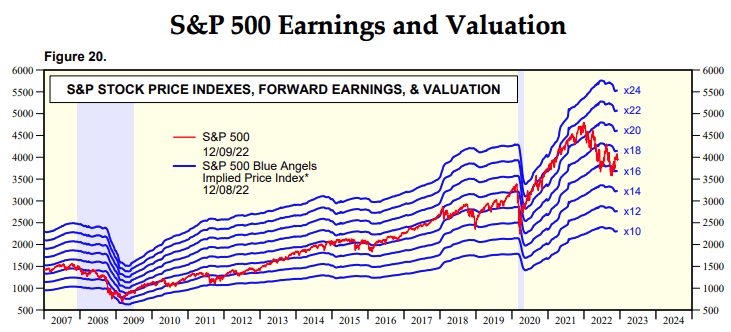
Over the last 15 years, the S&P 500 has traded a price/earnings multiple ranging from approximately 10x earnings in 2008 to levels above 22x earnings in early 2020. My fund flow analysis that follows will illustrate how record stimulus, extreme corporate buybacks, and the Federal Reserve’s quantitative easing (QE) programs contributed to this very large increase in price to earnings multiples. Current valuations are near 17.5x earnings and 2.2x sales for the S&P 500. Under normal circumstances, without record inflation, record interest rate hikes, record Fed liquidity drain, and all other conditions equal this is considered a high but sustainable multiple over many of the past years. Going into 2023, however, these levels are not sustainable and we will revisit lower valuations very soon.
Yardeni.com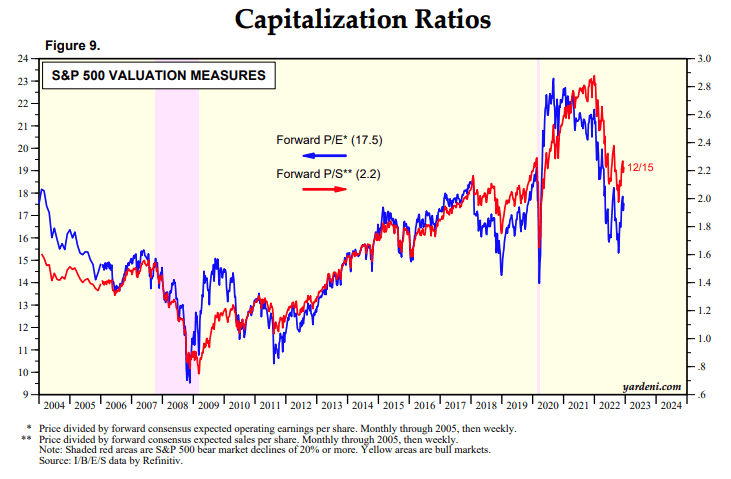
Any analyst who gives you a forecast of earnings multiples between 10 and 24 is making a broad and reasonable estimate based on the last 15 years of earnings valuations. I will try to narrow down this wide range using some additional fundamental factors. Basically, there are two elements driving the Price/Earnings ratio for the S&P 500 estimates: 1) What price premium do we think markets will be willing/able to pay next year, and 2) what will the actual S&P 500 earnings be for 2023.
Let’s start with analyst 2023 earnings estimates for the S&P 500. According to FactSet data,
Analysts still expect the S&P 500 to report single-digit earnings growth in calendar year 2023. The estimated (year-over-year) earnings growth rate for 2023 is 5.5%, which is below the trailing 10-year average (annual) earnings growth rate of 8.5% (2012 – 2021).
This estimate is illustrated below with declining sales and earnings data from the highs of 2021. The good news is that these earnings estimates are slightly higher for 2023 than 2022 and still very close to current earnings. We know that next year’s earnings estimate is below the 10 year average at the same time that current P/E valuations are more than 40% above the long term historical average. This tells us that to better forecast the S&P 500 price levels based on the expected earnings levels for next year we will have to look even more closely at price premiums.
FactSet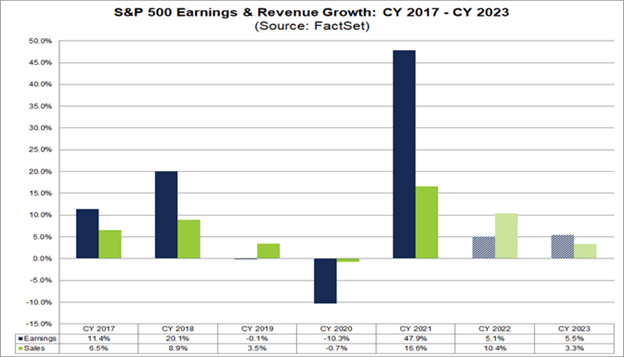
What I mean by price premium is what multiples of forward earnings will investors be willing to pay to own the S&P 500 stocks assuming that next year earnings will remain relatively flat and comparable to this year. Several fundamental market conditions have a large impact on determining what this price premium will be for next year. Put in simpler terms, the market multiples next year will be driven by: 1) How easy it is to obtain capital; and by 2) How eager investors are to invest in the stock market over other assets.
Corporate Buybacks
Corporate buybacks and the ability of companies to borrow money to prop up share prices continues as one of the largest money flows in the stock market today. One analyst found that (emphasis added):
since the beginning of 2011, the S&P 500 would have been 19% lower than it is today if no buybacks were performed at all.
In his evaluation of a scenario measured from the start of 2011, there have been over $3.5 trillion in S&P 500 aggregate net repurchases. Carried forward to today, the net repurchase level is well above $5 trillion. However, as the latest quarterly buyback data on the S&P 500 shows, buybacks have begun to decline sharply from record highs in Q1 of 2022.
Yardeni.com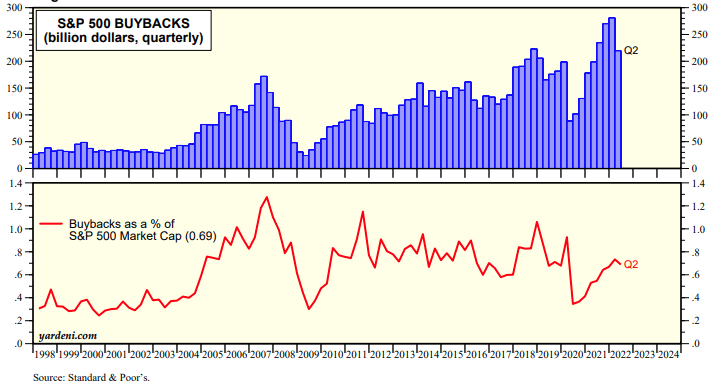
As we look closely at the chart we can see that buybacks have declined sharply from record highs in three prior events to 2022. First, in 2008-2009 there were seven consecutive quarterly declines in S&P 500 buybacks consistent with the stress of the Global Financial Crisis. Next, in 2018 we can see buybacks dropped for two consecutive quarters consistent with the Fed increasing interest rates and initiating the first ever quantitative tightening (QT) program at over $50 billion/month of liquidity reduction. Third, in 2020 the Covid pandemic caused a very sharp decline in Q2 buybacks, that were quickly restored using the largest quantitative easing program by the Federal Reserve in U.S. history. We will discuss the Fed’s role in more detail next, but let’s stay focused on the buyback patterns and increases for now.
This large buyback process accounting for over 19% gains on the S&P 500 from 2011 according to one analyst showed us exactly: 1) How easy it is to obtain capital; and 2) How eager investors are to invest in the stock market over other assets. This gives us an excellent way to determine how high the price premiums on earnings may be for next year. It follows that the more money available and the more eager investors are to buy equities, the more they are willing to pay a price premium for earnings growth.
So how do we forecast what the enormous buyback levels will be for 2023? We start by looking at the two fundamental factors that make capital more available and investors more eager to risk that capital in the stock market. Both of these critical factors are controlled through the monetary policy of the Federal Reserve.
The Federal Reserve market intervention
Looking back we recall that the Federal Reserve began an emergency market intervention process in 2008 to rescue markets and provide liquidity using quantitative easing. This QE program mainly added mortgaged backed securities and U.S. treasuries to the Fed’s balance sheet while providing more lending power to the banks. The road map of the S&P 500 from the Global Financial Crisis shows how the fundamental inflows of accommodative (easing) Fed policy made money more available and investor risk appetites for stocks increased dramatically.
VMBreakouts.com FinViz.com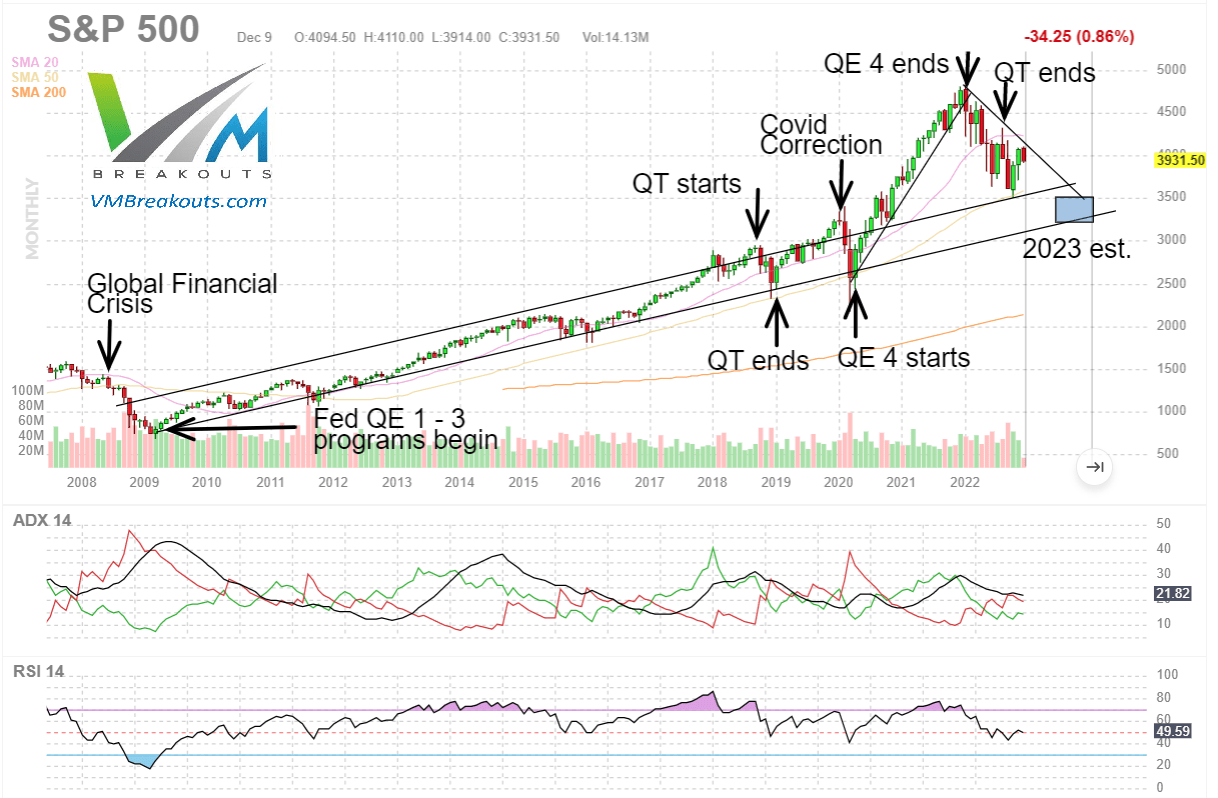
Conversely, we can see in 2018 how the Fed’s first attempt to reduce their balance sheet holdings and tighten market liquidity shocked the markets and was quickly abandoned by the Fed. Not until the Covid Correction in 2020 did we see the Fed step back in with the highest levels of easing in U.S. history with QE 4. By this fourth and largest QE event, institutional investors and many retail investors had learned how much the Fed intervention benefited markets. They were quickly willing to pay 22x the S&P 500 earnings to benefit in this market.
Near the start of 2022 on March 9th, the Fed ended QE 4 and by June had begun the largest tightening program in US history. Much more detail is available in prior articles, but the importance here is to show the fundamental relationship between monetary policy and price premium we want to use to value the S&P 500 for 2023.
You can review much more detail on the impact of this fundamental market flow in my prior articles warning about the impact on the S&P 500 for 2022:
So reviewing the S&P 500 buyback chart, you can see how the largest corporate buybacks occurred during QE with: 1) high availability of capital at low interest rates; and 2) with high risk appetite for large market gains. We also can see clearly that whenever the Fed entered a period of tightening it led to large S&P 500 declines and much higher volatility. In 2018, the market declines also coincided with a series of nine Fed fund rate hikes back up to the highest interest rate levels since 2008.
Just like 2018, the Fed has now hiked rates to the highest levels since 2008. However, this time they have hiked rates higher and at the fastest increase in U.S. history with promises of even more hikes next year.
Yardeni.com VMBreakouts.com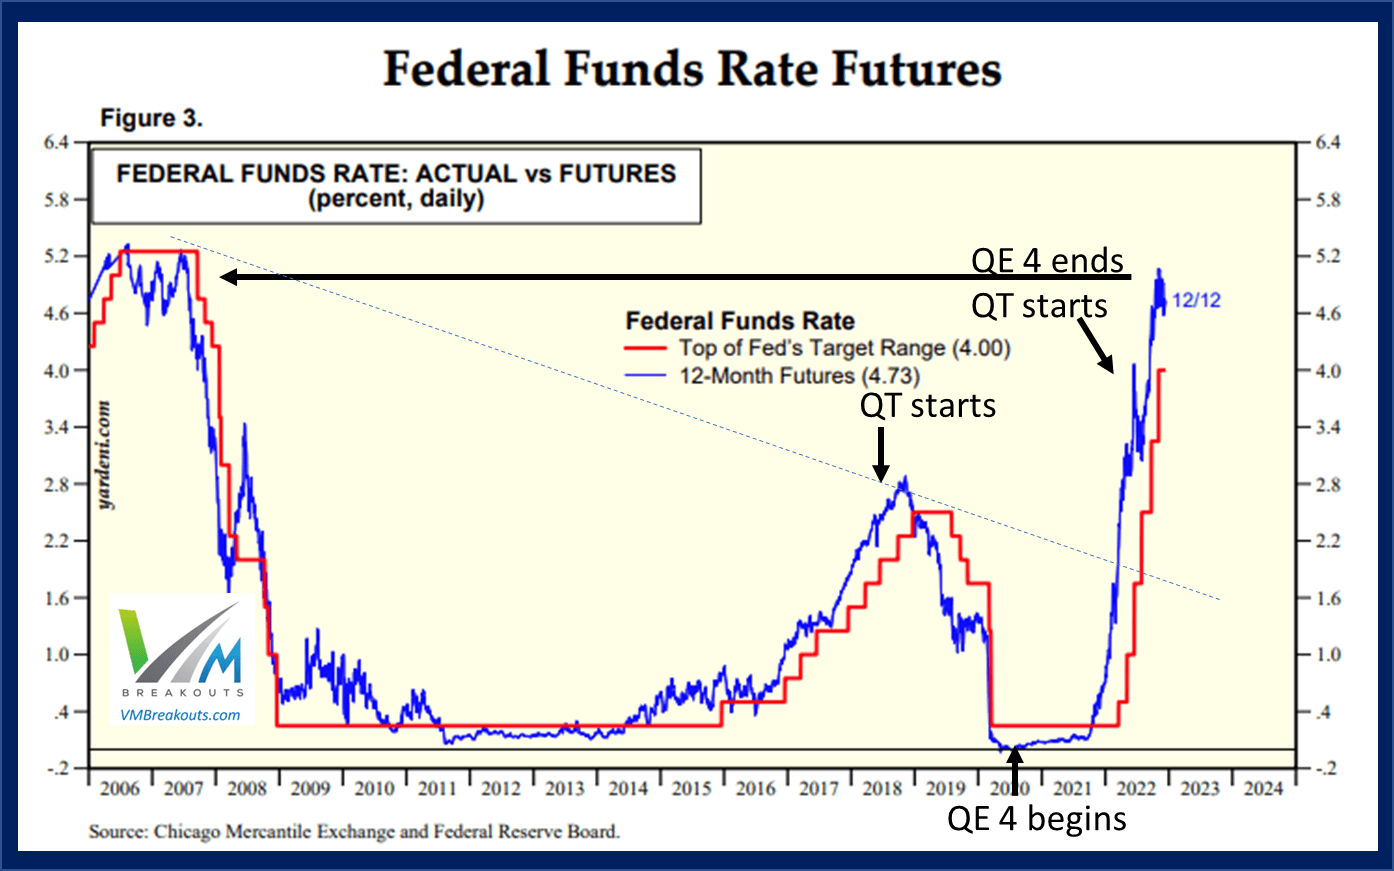
We know from the last FOMC meeting that the Fed plans at least 3 more rate hikes into 2023 starting on February 1st their next scheduled rate decision. However, just like 2018, we don’t know if the Fed will pivot early ahead of schedule. There are several reasons to expect the Fed to pivot away from their aggressive tightening schedule in 2023 and that plays a critical factor in estimating where the S&P 500 will end the year next near.
Examining the Fed Funds rate from the 1980s shows a 40 year trend line to which rates have been hiked in 5 previous events and in every previous case have led to a policy reversal and an economic recession. As both Fed fund rate charts show, the Fed has now hiked to 4% with a projected terminal rate above 5% into 2023.
The first reason to expect a Fed pivot in 2023 is that rates have been hiked above the 40 year trendline for the first time since the 1980s and the Fed has not been able to sustain rate hikes very long in all previous moves. Additionally, we have not yet felt their full impact on the markets, in part due to the deliberate and extremely fast rate of increases still rolling through the housing and banking markets.
St. Louis Fed VMBreakouts.com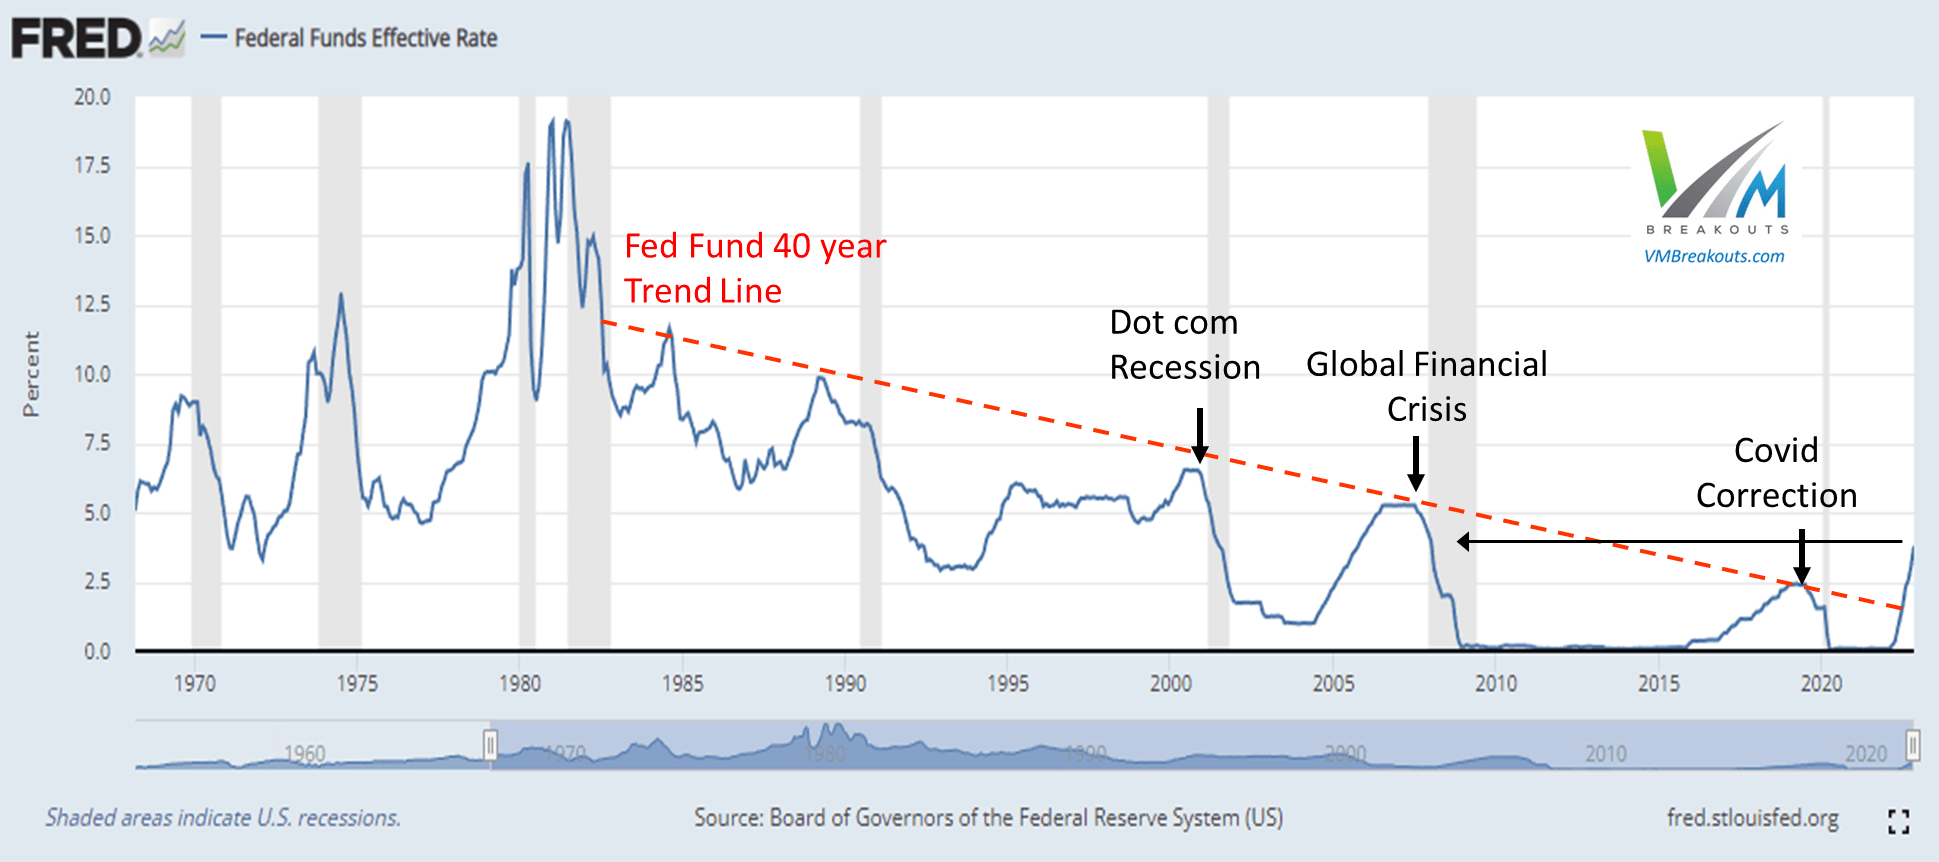
The second reason to expect a Fed pivot is that higher interest rates require higher interest payments on the largest US debt level in history. History has shown that it is unsustainable both for the markets and the U.S. government to keep interest rates elevated at levels above the trendline for very long.
Even as it seems unlikely that the Fed can sustain rates for very long at their expected terminal rate above 5%, they continue to express a “higher for longer” guidance to markets.
New York Federal Reserve President John Williams stated recently,
“I do think we’re going to need to keep restrictive policy in place for some time; I would expect that to continue through at least next year,” Williams said at a virtual event held by the Economic Club of New York, noting that borrowing costs need to rise to bring down overly high levels of inflation. “I do see a point probably in 2024 that we’ll start bringing down nominal interest rates because inflation is coming down.” – Reuters
Before we examine when I expect the Fed to pivot and how that will impact the S&P 500 price levels next year, let’s do a quick review.
Quick Valuation Review
The S&P 500 is significantly above average valuations on 70 year, 50 year, 15 year and 10 year valuation measures. Analysts expect S&P 500 earnings growth to continue nearly even with 2022 levels. Price multiples of the S&P 500 are directly related to the ease of obtaining capital and the desire to risk capital in the equity markets. Now overlaying the S&P 500 earnings and valuation with what we know about buybacks and the Fed intervention, a better way to estimate 2023 valuations comes to light.
Yardeni.com
In periods of market recessions and prior QT we saw valuations drop to between 10x and 12x forward earnings. In periods of QE and record Fed easing with near zero interest rates we saw valuations rise to over 22x forward earnings. Accepting analyst earnings growth estimates to remain steady, the price premium with increasing QT into 2023 is likely to drop back toward 10-12x forward earnings levels. This is consistent with levels on the S&P 500 next year between 2000 and 3000. A move to 2500 levels would test the prior lows of the 2018 QT correction and the Covid correction as shown in the chart below.
VMBreakouts.com FinViz.com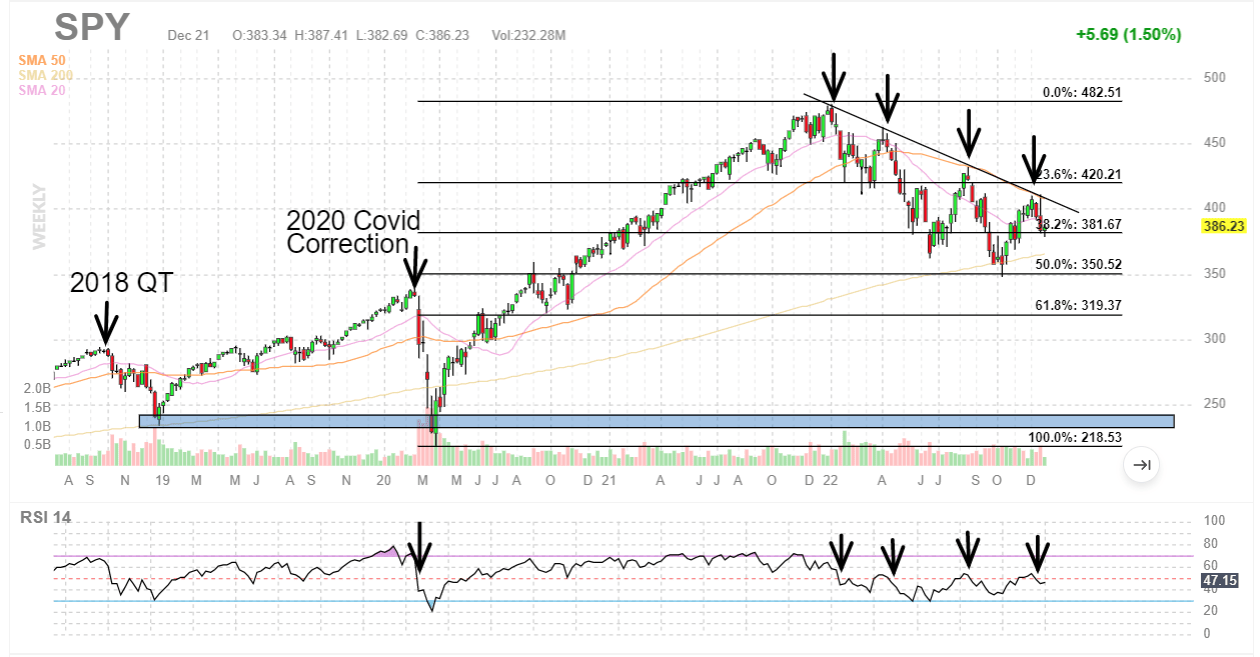
Examining the Fed Pivot for 2023
A Fed Pivot would be a change in monetary policy away from the record tightening policies and back toward accommodative easing favorable to markets. The Fed insists at every press conference they will fight inflation with QT for as long as necessary, but the markets continue to look to rally with any improvement in inflation data. This cycle of optimism and disappointment will continue to lead to extreme volatility until the Fed actually pivots.
First we have looked at the Fed funds rate hikes with continuation into 2023 likely to contribute to a market downturn or potential economic recession. The Fed has been clear that the labor markets even in December look too strong to help reduce inflationary pressures toward their 2% inflationary target.
Next I will review the other critical aspect of the QT monetary program that that may give us the best timing indicator for a Fed pivot next year. The balance sheet reduction gives us the best schedule for timing when the Fed expects to hit one of their targets.
The weekly chart of the Fed balance sheet below shows the start of QE 4 in response to the Covid market correction on the S&P 500. The Fed added over $4 trillion in domestic securities to their balance sheet from March 23rd, 2020 to March 9th 2022. This rescue effort sent the S&P 500 from the lows around 2,250 to the 2022 highs of 4,796.
VMBreakouts.com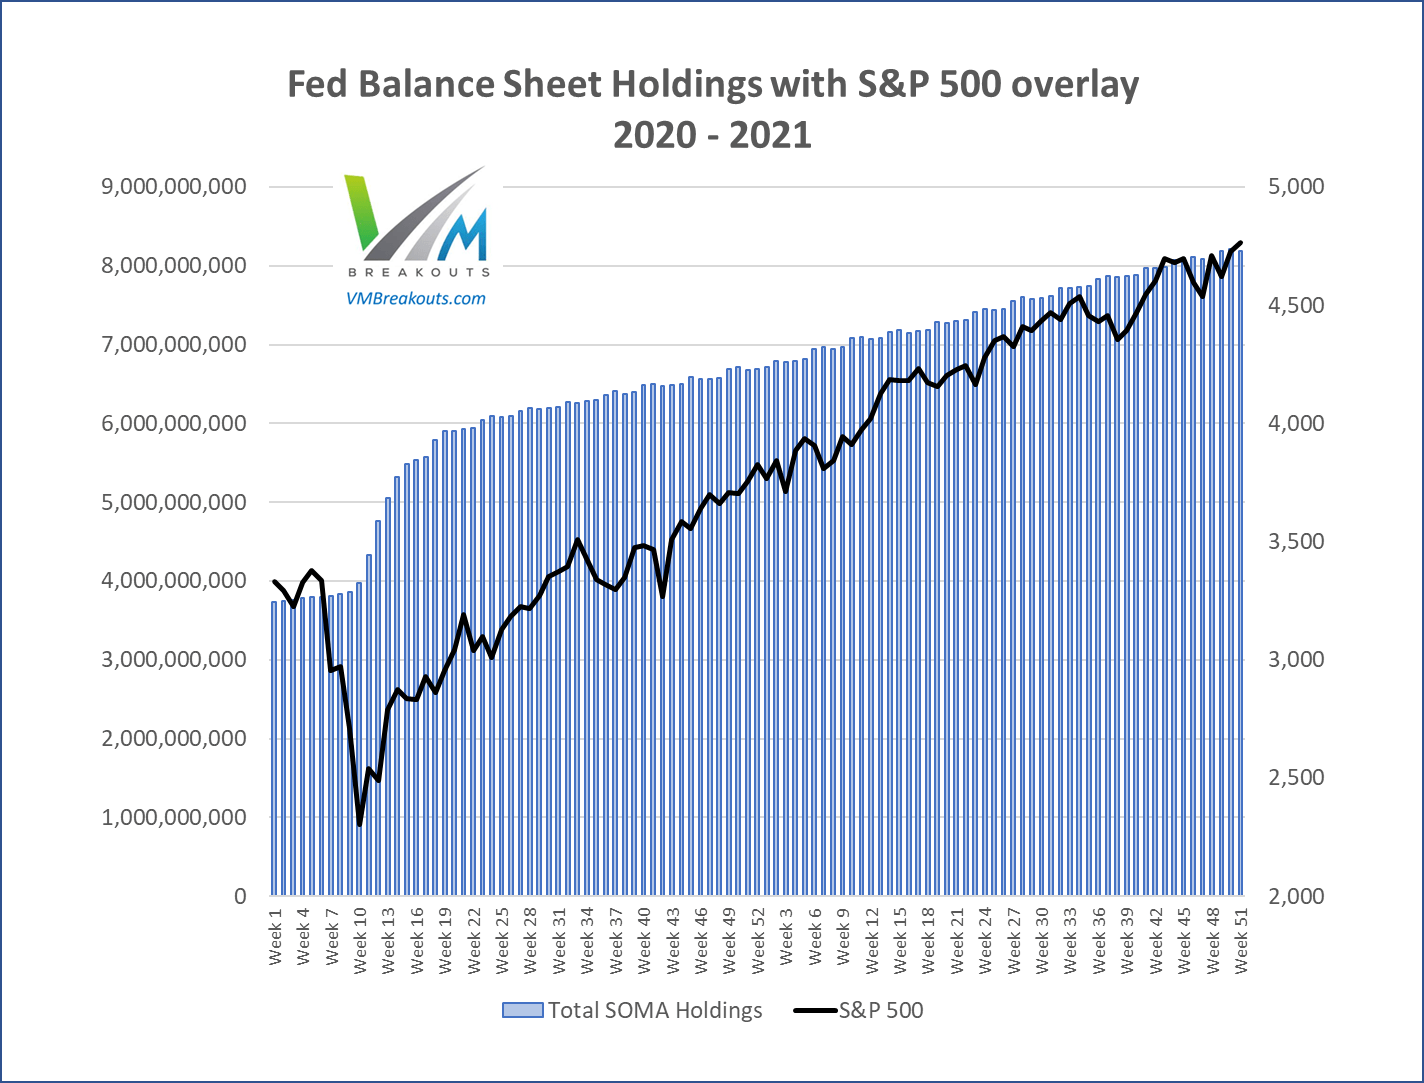
The Fed effectively ended the record QE 4 program on March 9, 2022. Then in his March press conference, Chairman Powell expressed a target reduction of $1 trillion from the Fed’s balance sheet. At the time of this guidance the Fed balance sheet was above $8.4 trillion in domestic securities. It is reasonable for us to expect a balance sheet target around $7.4 trillion with the projected reduction cap of $95 billion/month that began in September. Based on this schedule we can project a timeline for hitting this target in 2023.
VMBrreakouts.com 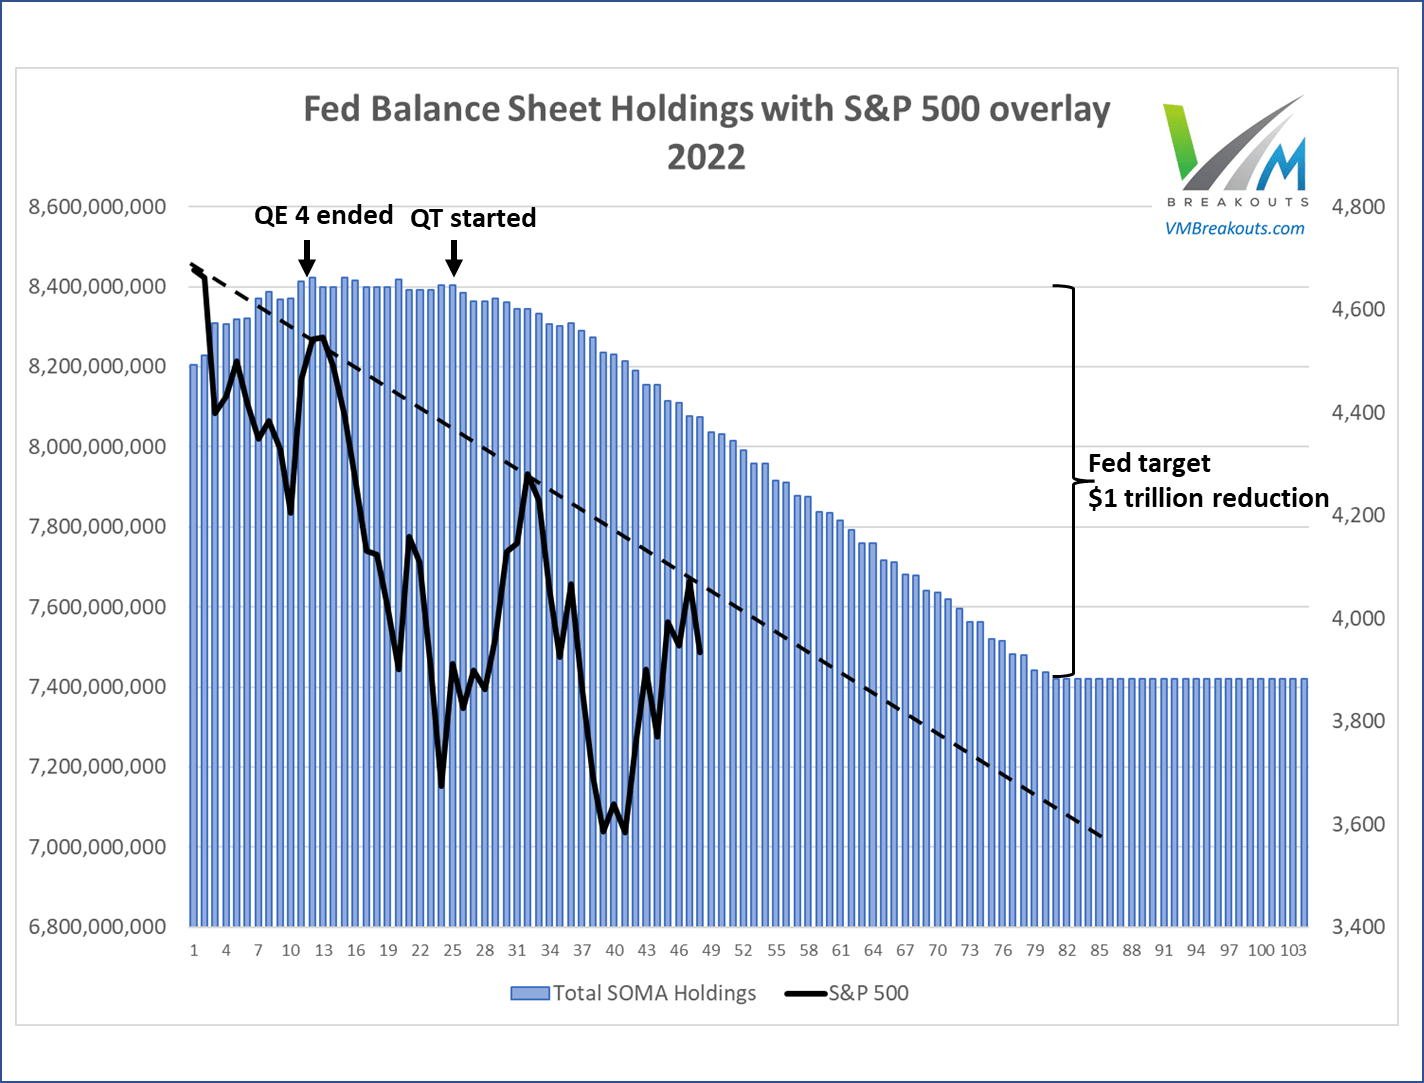
The weekly chart above of the Federal Reserve balance sheet forecasted into 2023 shows that a target of $7.4 trillion would be reached around August of next year at the current rate of reduction. As my prior research linked above on the 2018 QT events show, market volatility increases significantly when liquidity is drained from the markets. The S&P 500 for 2022 continues in a negative channel of high volatility that I expect will continue for as long as the Fed drains liquidity and hikes interest rates. Based on these fundamental fund flows and tightening monetary policies, I expect a Fed pivot prior to reaching their balance sheet target in Q3. My view is that the most significant impact on markets may hit sooner in the first half of the year with a recovery later in 2023.
If 2018 volatility is any indicator, the liquidity drain can intensify in a non-linear way that causes a larger market reaction once the balance sheet gets below a critical liquidity level. That is further confirmed by my measures of +/- 2% daily moves in the S&P 500 since 2008 with the highest volatility in market contractions of QT and Covid in 2018, 2020, and 2022. We can expect many more days of high volatility into 2023.
VMBreakouts.com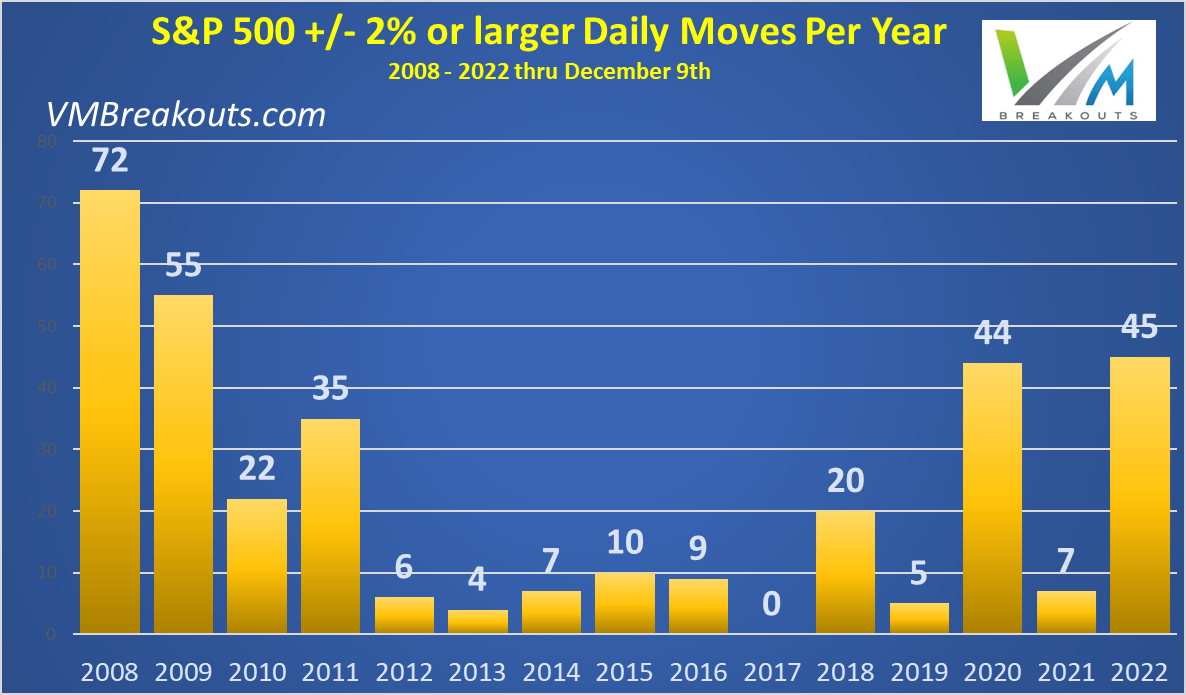
Charting my S&P 500 target for 2023
Based on holding earnings growth estimates at 5.5% with current S&P 500 P/E values at 17.5, I expect the price premium to drop significantly into 2023. The Fed rate hikes and record market liquidity drain are combining into a strongly negative force constraining borrowing, cooling housing markets, dropping corporate buybacks, and reducing investor risk appetites. The current tightening levels are already higher than 2018 levels when S&P 500 valuations dropped to 14x earnings and down to 2400 level on the S&P 500. A drop to 15x earnings would put the S&P 500 down to the 3,100 level.
VMBreakouts.com FinViz.com
My forecast for next year is that the S&P 500 will drop to 14x earnings and decline back to the positive channel from 2009 when the Fed started the first QE program. As long as the Fed follows through on 3 more rate hikes and a $1 trillion balance sheet reduction through August of next year, I expect the following S&P 500 price reactions 2023.
- The S&P 500 will decline back to the 2009 channel but like prior corrections will overshoot support down to 3,000 level before rebounding.
- The S&P 500 will decline to 14x earnings levels at or below 3,100 before a Fed pivot.
- The Fed pivot will begin in Q2 next year, but will continue through the year.
- The S&P 500 will recover to 3240.76 (with humorous precision) at year end down -16.45% from current levels.
Conclusion
I offer this forecast with every conditional stipulation that markets are impacted by more variables than I can ever forecast or comprehend. The best way forward is to keep a close eye on market signals and money flows as we enter the new year.
2022 brought us many incredible records I have never seen in more than three decades of trading. In fact, if you told me this year would be the worst year since 1788 for 10 year treasuries I would not have believed you.
BofA Research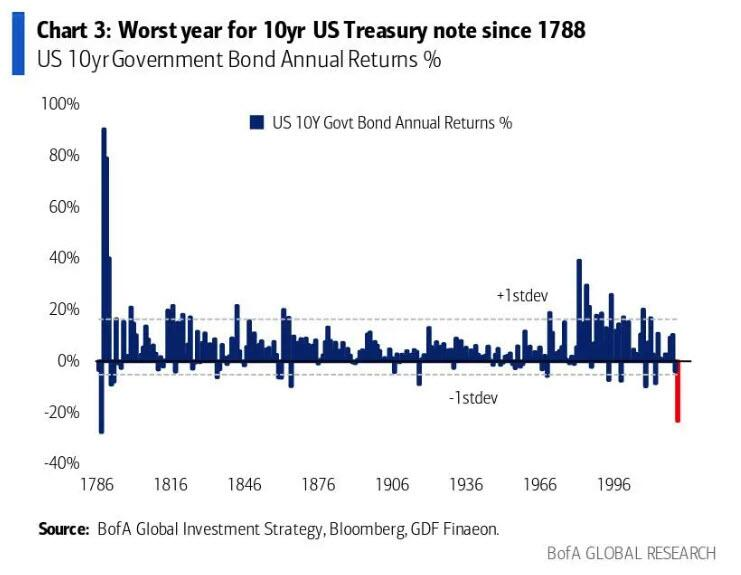
I continue to see fundamental values depressed by Fed constraints on borrowing that will give us several quarters in declining corporate buybacks. Without the increase of these flows we can expect higher volatility and large market declines into next year. I hope you benefit from this forecast article and I wish you the very best!
JD Henning, PhD, MBA, CFE, CAMS
- Editor’s Note: This article was submitted as part of Seeking Alpha’s 2023 Market Prediction contest. Do you have a conviction view for the S&P 500 next year? If so, click here to find out more and submit your article today!
Be the first to comment