


PhonlamaiPhoto/iStock via Getty Images
Investment Summary
After extensive review, we rate FONAR Corporation (NASDAQ:NASDAQ:FONR) a firm hold. The stock remains within a 5-year long downtrend that is currently testing level of resistance, as seen in Exhibit 1.
Despite participating in the latest rally in broad equities, beta to the SPX is low at 0.3. We believe this could restrict upside mobility, as company-specific premia is absent in FONR.
Being such a mature company, sales/EPS growth is negligent, and FONR’s ability to create additional corporate, shareholder value appears clamped. An opportunity cost therefore exists compared to other names.
This is a company recognizing c.$20–$25mm in normalized quarterly revenue and <$0.50 in quarterly EPS despite listing in the 1980’s. Meanwhile, quarterly turnover has grown just 26% from 2016.
We’ve performed a multitude of assessments on FONR and the confirmed the decision to hold, price target $20.
Exhibit 1. FONR remains within longer-term market cycle with shares gliding from FY17 highs in a deep, tight, descending channel.
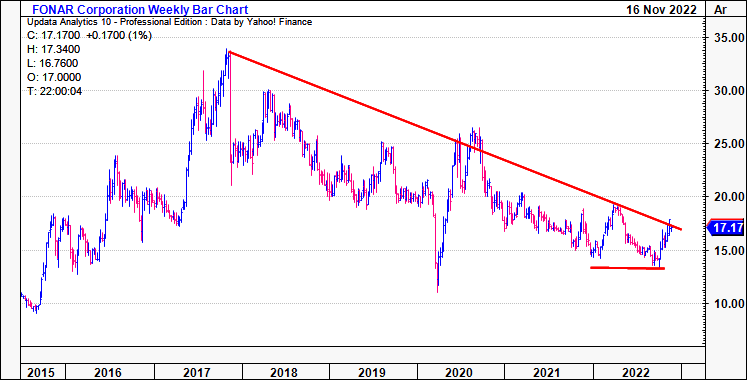
Data: Updata
Q1 numbers demonstrate challenge for investors
Speaking of numbers, FONR’s Q1 earnings pulled back to long-term ranges with headwinds from labor shortages and reduced scan volume. However, as seen in Exhibit 2, growth across key operating metrics from the top–bottom line has been flat since FY16.
FONR has grown revenue at an average of just 85bps per quarter since FY16. Quarterly turnover lifted 26% in the last 24 quarters from $18.18mm to $23mm in Q1.
Turning to the quarter, net revenue decreased 200bps YoY, underlined by a decline in MRI scan volume. This occurred due to substantial labor shortages amongst FONR’s worksites [headquarters, managed sites] persisting throughout the quarter. As a result, FONR was unable to meet patient demand at many of its sites. This led to a 830bps YoY decrease in HMCA scan volume for the quarter [290bps sequential decline].
Despite the reduced labour input, total expenditures lifted 700bps YoY to $19.3mm. It saw a 24% increase at the SG&A line, the major cost driver being reserves placed against management fees from scanning centres that hadn’t met expected scan turnover. Net patient fee revenue, alongside management fee revenue, contracted 100bps YoY to $21.3mm
Moving down the P&L, operating margin decreased 31.9% YoY to $3.9mm as OpEx widened 700bps to $19.2mm. It pulled this down to EPS of $0.29 per share, a loss of 47% from the year prior.
Exhibit 2. FONR Operating performance remains flat, booking double-digit revenue prints each quarter.
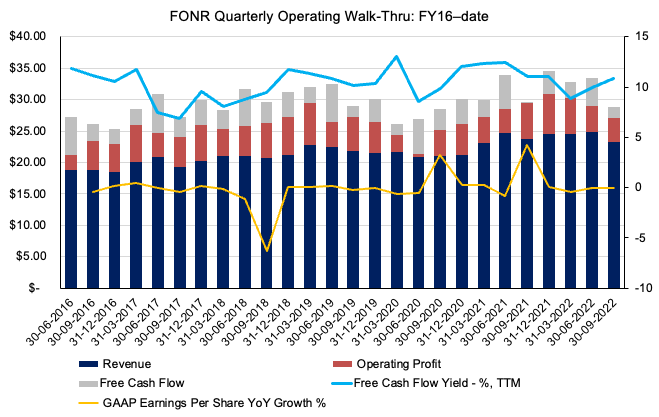
Data: HB Insights, FONR SEC Filings
It’s then a question of FONR’s ability to create future value above its cost of capital. We looked at return on invested capital (“ROIC”) and unpacked this further to see where, how FONR might do this.
As seen in Exhibit 3, ROIC and FCF have continued to wind down within a cyclical downtrend. Unfortunately, as the level of FCF has slowly dried up, ROIC has followed suit.
Ideally, we’d see the opposite – FCF outflows with a corresponding uptick in ROIC, signalling the cash was invested successfully. TTM ROIC has flattened at ~8–10% for FONR over the past 2-years, whilst the clip on FCF has narrowed equally.
Exhibit 3. FCF and ROIC coupling into long-term downtrend. Can FONR create future value with this setup?
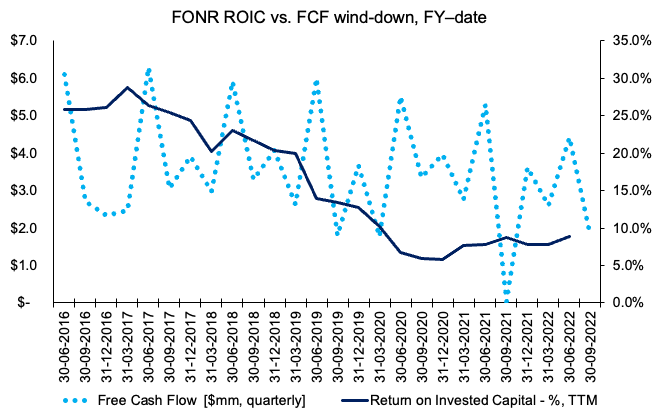
Data: HB Insights, FONR SEC Filings
As seen in Exhibit 4, the breakdown in ROIC has resulted from a decline in both sub-components: NOPAT margin and invested capital turnover. This tells me that management have been less active on generating economic profit [ROIC less WACC hurdle], and achieving less economic profit with each turn in the capital budgeting cycle.
The company’s Q1 ROIC of 8.9% outpaced the WACC hurdle of 7.2% at the time by 1.7 percentage points. FONR’s ability to generate additional corporate, shareholder value into the future looks dampened by all this ROIC data, in my opinion.
Exhibit 4. Quarterly ROIC breakdown indicates both sub-components realizing wind-down
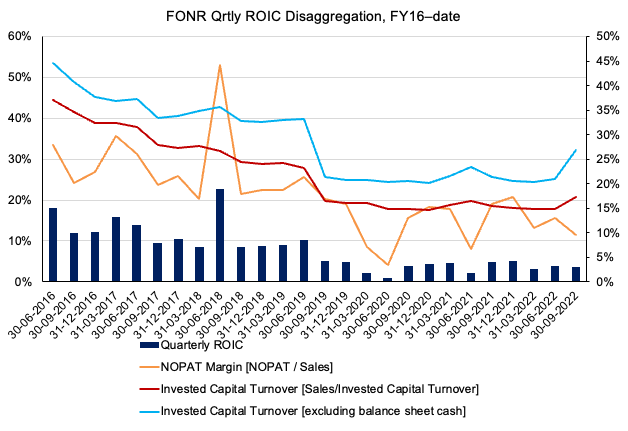
Data: HB Insights, FONR SEC Filings
Market data supports neutral view
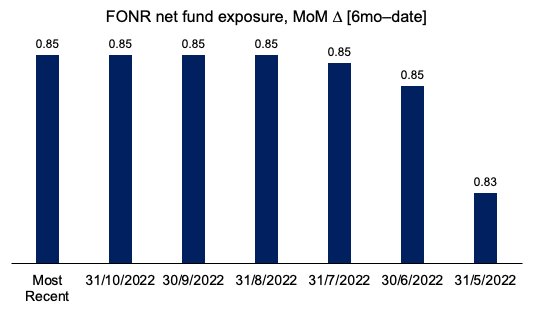
As noted in the chart below, FONR net fund exposure remains flat over the past 4 months. Without the institutional buying volume into this latest move, it’s difficult to gauge if it will fail or not.
We’ll be monitoring this data closely but for now this again further supports a neutral view in my estimation.
Exhibit 5. Net fund exposure remains unchanged since July, despite latest rally.
Data: Refinitiv Eikon
Volume has now broken out above the long-term downtrend, whilst relative strength rating ticks higher. Shares have bounced from the 50DMA and 250DMA at the point where they crossed to the upside, seen below.
FONR has closed above its 50DMA for the last 10 weeks now. However, the base into the move was wide, with prices straight up in October. This isn’t a strong base in my estimation. The stock is now heading back to range and will test the previous 2 highs shown below.
The question really is just how long this latest rally can extend. Clearly, FONR has completed 2x previous rallies, lasting for a similar range of 10–12 weeks. We’ll need to see evidence of increasing fund ownership to change our neutral view here.
Exhibit 6. FONR 12-month weekly price action. Recent volume reversal and breakout, although without institutional momentum behind it.
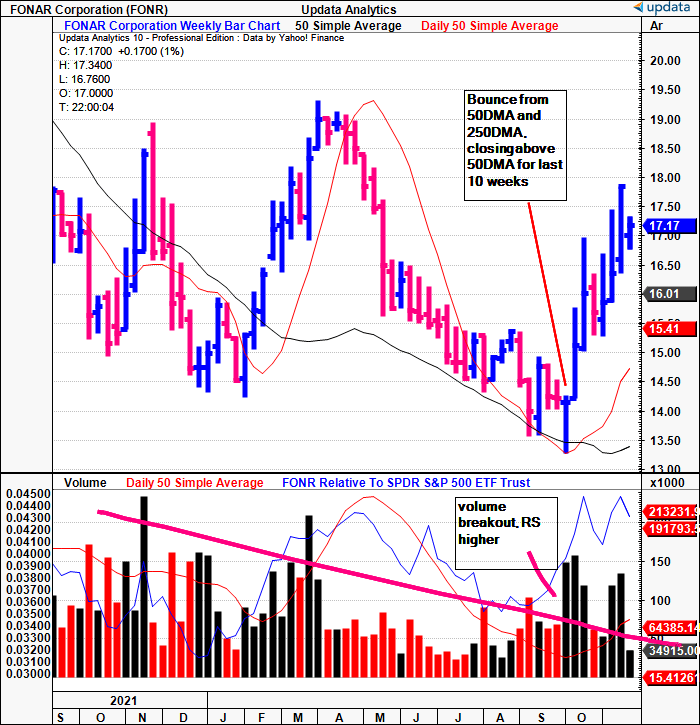
Data: Updata
As such, we see technical price objectives to $21.8, as seen on the point and figure chart below.
Exhibit 7. Upside target to $21.8.
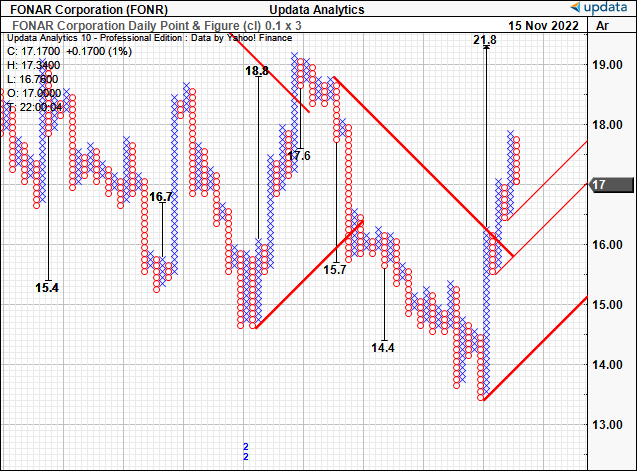
Data: Updata
Valuation and conclusion
We estimate a 9.6% YoY decline to FY22 EPS for FONR to $1.68. This is driven by our growth assumptions, and the slowdown reported YTD. The stock trades at 9.6x trailing earnings and is priced at 0.76x book value.
Question is do these figures represent value or not, or has the market made the correct decision to de-rate the stock so heavily. We estimate FONR should trade at ~12x forward earnings, which prices the stock at $20.
With technical data supporting this figure, we are more confident with this estimation. The consensus S&P 500 P/E estimate for FY22 is 18.18x, and at 12x forward P/E, we expect FONR to underperform the SPX looking ahead.
Exhibit 8. Fair valuation model
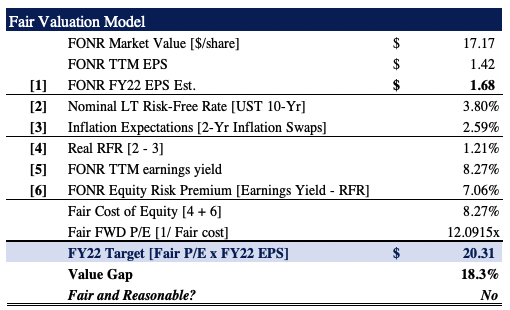
Data: HB Insights Estimates
Net-net, we rate FONR a hold on a $21 per share valuation. There’s multiple data points on this number giving more confidence on the estimate. FONR’s ability to create future corporate value looks limited, thereby, from an opportunity cost perspective, we can’t invest. Rate hold, price target $21.
Be the first to comment