

PeopleImages
Thesis
Focus Financial Partners Inc. (NASDAQ:FOCS) currently has strong revenue growth and an improving cost structure. And when comparing the company with peers to seek a valuation, we find that FOCS stock is currently undervalued, giving it potential upside.
Intro
FOCS is an investor in RIAs and supports investment companies in starting up new independent firms. The company was founded in 2006 and has offices in New York and California, as well as 60 partner firms across the world, which comprises around 2,700 wealth, management-related persons. The company had its IPO in 2018 following an investment from KKR in 2017.
The company’s stock price has not performed well over the past year, down almost 40%. This is significantly further than the current overall stock market decline.
Seeking Alpha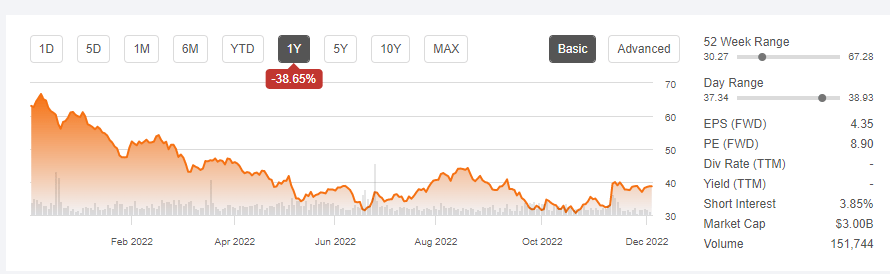
Financial Analysis
The company reports revenue through two segments, wealth management fees and “other,” where more than 90% of revenue is made in the U.S. despite having partner firms in Australia, Canada, Switzerland, and the UK.
For the latest quarter, the period of three months ending September 30, 2022, wealth management fees grew 15% compared to the same period a year prior, increasing by around $65m. This growth was driven by new partner firms added to the group, of which these firms completed 25 acquisitions in the period. Around $48m of the growth was driven by the new partner firms, almost 75% of the growth in the quarter, while the rest was made by existing partner firms.
Seeking Alpha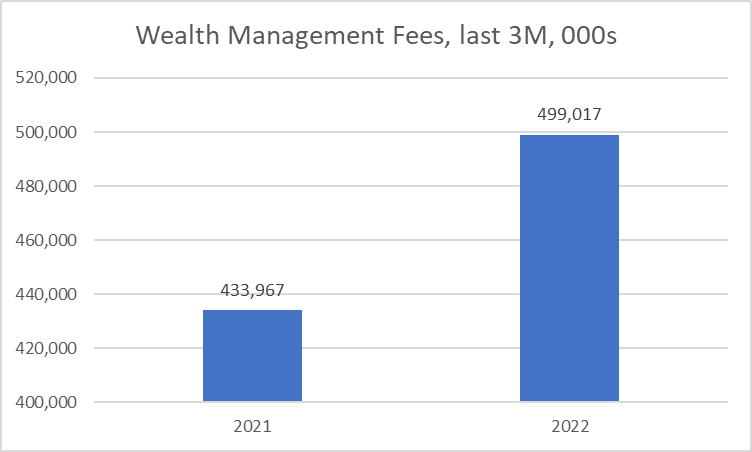
Other revenues grew by only 1.4%, but these revenues are a fraction of the total sales of the company.
In terms of costs, the cost structure is made up of compensation expenses, management fees, SG&A, intangible amortization, non-cash changes, plus depreciation.
Compensation expenses grew by almost 30%, or around $42m, which was driven by costs related to new partner firms’ salary expenses and related expenses of partner firm-level acquisitions. Growth in costs of compensation outpaced growth in sales, which led to compensation now accounting for around 37% of sales, compared to 33% of sales a year prior.
Seeking Alpha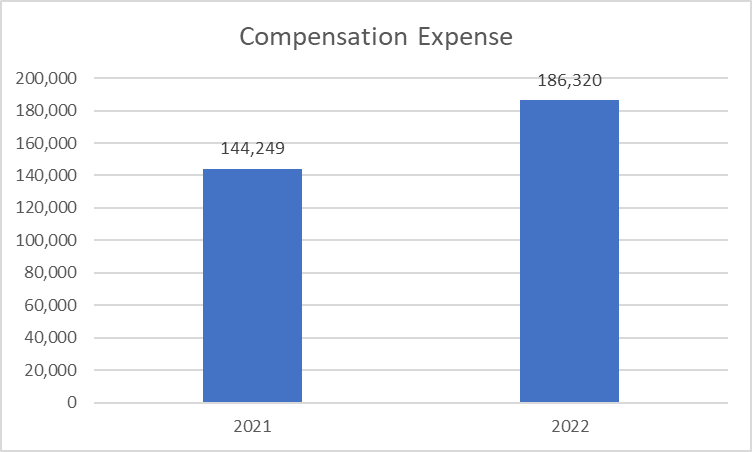
Management fees, fortunately, decreased in the period compared to the same period a year prior. The management fees fell by 3.3%, or by around $4m, where the decrease was driven by a large decrease in profitability splits with management companies, despite growth in costs due to new partner firms. Management fees now only account for just under 25% of sales, compared to almost 30% of sales in the year prior.
Seeking Alpha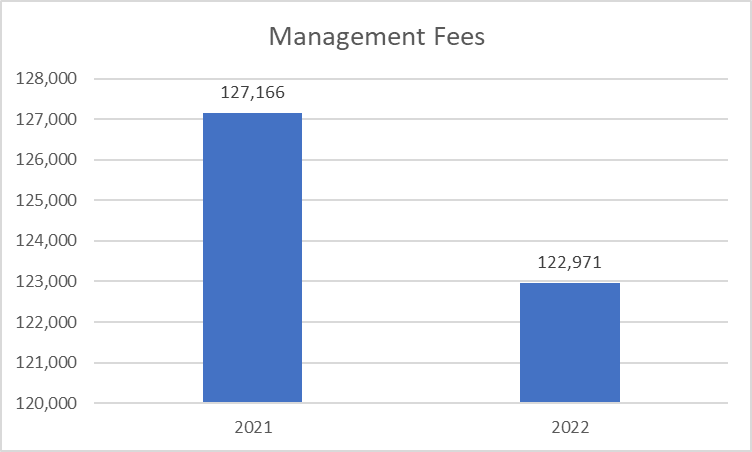
In regard to SG&A, this grew 19%, slightly outpacing growth in sales, which was driven by costs associated with travel, entertainment, and IT expenses from the growth of existing partner firms, as well as new partner firms. SG&A as a % of sales was almost flat compared to the year prior, at around 18% of sales.
Seeking Alpha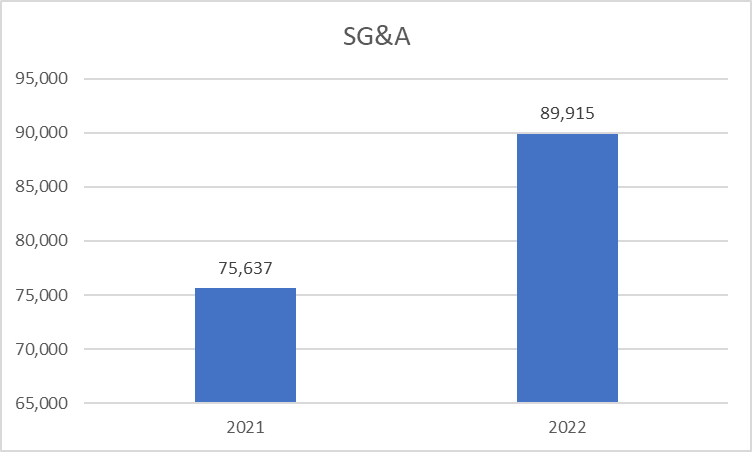
Other costs are non-cash related. While amortization costs increased due to the acquisitions made, non-cash changes actually created income rather than an expense.
Therefore, improvements made in management fees and non-cash charges offset the increase in costs for other items, leading to a decline of 10 points in operating expenses as a % of sales, from 95% in 2021 to 85% today.
As a result, EBITDA grew a significant amount for the period. EBITDA grew from around $165m in the period for 2021, to around $283m in 2022, a growth of almost 72% for the period compared to the year prior, which has led to a major improvement in EBITDA margin from 36% in 2021 to 55% today.
Valuation
If we collate a set of peer companies that operate in the same industry and have a similar market cap, we could find a suitable valuation for FOCS.
When looking at EV/Revenue, FOCS looks to be significantly undervalued compared to peers, showing a potential upside greater than 100%.
Seeking Alpha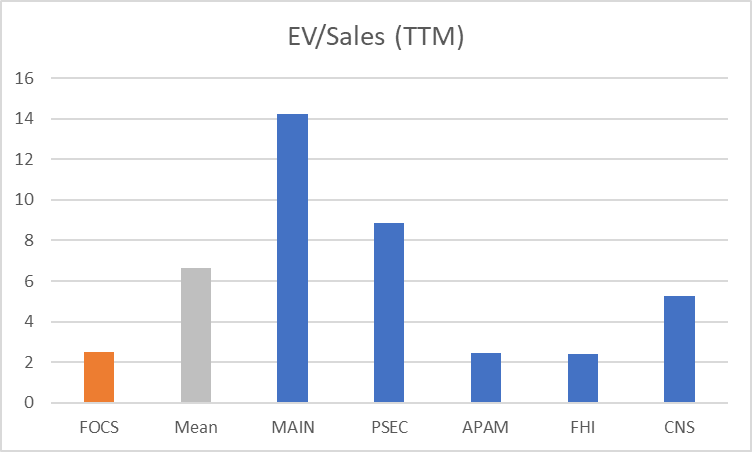
On the other hand, when looking at EV/EBITDA ratios, FOCS look to be slightly overvalued, or more appropriately in line with peer valuations (although some tickers did not have available data).
Seeking Alpha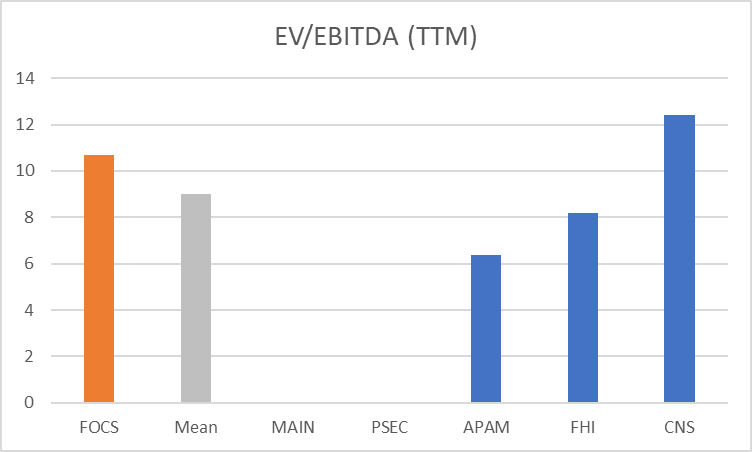
While EV/EBITDA shows that FOCS may be at a fair valuation, EV/Sales implies that they are undervalued compared to peers. Coupling this with the fact the FOCS have seen a major improvement in EBITDA in the past year, achieving an EBITDA margin higher than 50%, the share price may have some potential upside.
Risks
- The main risk to the thesis would be a reversal of the non-cash changes made in the PnL. This was the main driver of decreased costs as a % of sales (plus a decrease in management fees). If we exclude this figure from EBITDA, then the picture is entirely different, and not only does it offset all the gains, but shows a worsening picture for the company. Therefore, if this figure were to reverse and non-cash change costs increase back up, then we could see a decline in EBITDA and its margin, leading to the stock price not only no longer being undervalued, but potentially overvalued instead given that the current EV/EBITDA is somewhat in line with peers.
Conclusion
Overall, FOCS have seen strong revenue growth plus improvements in their cost structure, which has led to an improvement in EBITDA and an increase in EBITDA margin by almost 20 points in the quarter compared to the year prior. When comparing the company with peers for a valuation, the company looks to be slightly undervalued, and when taking into account the improving financial health of the company, we see a potential upside in the Focus Financial Partners Inc. share price from current prices.
Be the first to comment