

NicoElNino
What’s the best way to buy diversified value? The default answer is usually Vanguard’s Value ETF (VTV), at least judging by assets under management of $153 billion, but you can make a pretty good case that the Schwab Fundamentals U.S. Large Company ETF (NYSEARCA:FNDX) will do better over the next ten years. While the term “value” is not included in its name, it’s clear that the “fundamentals” methodology gives this ETF a strong tilt to value. This methodology also explains why FNDX is also likely to outperform both the Vanguard S&P 500 Index ETF (VOO). Why should this be so?
The Schwab FNDX is in effect both a broad large cap index and the value version of that index. The one index ETF it does not compete with is the Growth Index (VUG). It will trail the Growth ETF when tech and other high growth companies are hot, as they have been over most of the last 15 years, but they’re very much not hot right now. It’s in the midst of a severe correction based on rates, growth and a few operating factors. The growth correction may well be part of a multi-year tilt to value it’s entirely possible that over the next few years the Schwab Fundamentals ETF will beat all three cap-weighted index ETFs: VOO, VTV. and VUG. This article will attempt to explain its likely ascendence.
The last decade up until late 2021 was a period of growth dominance, and in the process the growth leaders grew to such size that they came to dominate the performance of the Total S&P 500 Index. This powerful influence was owed in large part to the fact that all three Vanguard ETFs are all based on indexes weighted by market cap. There’s an ongoing debate about the relative virtues and defects of market cap weighted indexes and “smart-beta” indexes. It starts with the fact that cap-weighted indexes are shaped by market prices while “smart beta” indexes ignore market prices and base their index weightings on such measures as sales, earnings, book value, cash flow, and dividends (sometimes including buybacks). Jumping over market opinion to underlying economic value is very much a Benjamin Graham value investing approach.
Cap weighted indexes are organized by the total market capitalization of their constituent elements. For the S&P 500 index and its Value and Growth partial indexes, all market indexes are updated at the end of daily trading. Companies which win growing favor in the market thus become more important parts of the index while companies losing favor shrink in importance. The major argument in favor of cap weighted indexes is that they automatically get investors into outstanding growth companies as their operating results and future prospects improve. Ultimately, however, it’s the market opinion which causes them to rise. The positive argument is that the market in aggregate is always right because prices represent the “Wisdom of Crowds.” It’s like guessing how many peas are in a barrel or how much an ox weighs. You and I may be very wrong in our guesstimates, but the guesses of a very large number of people tend to average out to a number that’s very close.
This principle of “crowd wisdom” was discovered by Francis Galton in 1906 at a livestock fair while watching 800 people bet on the weight of an ox. While estimates varied wildly, the median and mean estimates were both extraordinarily close to the animal’s actual weight. This principle works much of the time for many estimating problems. The problem is that from time to time the crowd is very wrong, as when various stock markets became extremely overvalued on crowd enthusiasm. Well known examples include the bubbles in the U.S. market leading up to 1929 and 2000 Crashes as well as the Japanese bubble leading up to Crash starting in 1989. In many cases what begins as the Wisdom of Crowds eventually overshoots and displays the Madness of Crowds.
Cap-weighted indexes have an obvious vulnerability to these bubbles and crashes, and the current bear market led by former tech favorites may be an example of such a correction (so far not a crash). The wisdom of crowds got index investors into growth stocks as they began to emerge and kept investors in them as they grew into dominant companies while the critical faculties of the crowd diminished. The madness of crowds may ultimately tell you that a single tulip bulb is worth tens of thousands of dollars, and who are you to say it isn’t. The South Sea Bubble got Isaac Newton in, then out when prices got ridiculous, then back in when the crowd continued to push prices higher.
The Smart Beta Solution
One determined value investor concluded that the solution to the radical overvaluation problem is to use an index grounded in economic fundamentals instead of crowd opinion. In 2002 Rob Arnott founded Research Associates and in 2004 brought out the RAFI Fundamental Index based on sales, profits, book value, free cash flow, and dividends. In this interview with Robert Stowe in 2015 noted the success of the PowerShares Fundamental ETF, now PRF, which had beaten iShares Russell 1000 ETF by .98% annually over its first 10 years, with growth in AUM which he attributed to the fact that investors were frustrated from being “pulled into one bubble after another” by the cap weighted indexes.
Jumping over market opinion to underlying economic value is a very an extension of Benjamin Graham value investing principles to an index. In Graham terms, cap weighting reflects the view of the market as what Graham called a “voting machine.” while weighting based on underlying metrics of value corresponded to Graham’s characterization of a “weighing machine.” At the time Graham wrote his great investment books, Security Analysis and The Intelligent Investor, Graham dealt only with individual stocks as index funds would not appear for another 40 years. The problem this posed by individual stocks was that it was necessary to sell a stock when it reached or exceeded fair value and find another to replace it. The smart beta RAFI index solved this problem by using the ratio of price to a variety of value measures in order to rebalance within the index. Overpriced stocks don’t go away, they simply shrink in importance within the index.
The groundwork for creating the RAFI index comes from two articles Arnott published in the early 2000s. The first, coauthored with the legendary Peter Bernstein, argued that even after the 2000 dot.com Crash, the risk premium investors assigned to stocks was much too high, producing overblown expected future returns of 12% or more. The Arnott/Bernstein forecast of zero was matched by the actual zero return of stocks for the decade of the 2000s. This 2003 article with Clifford Asness argued further that dividends actually correlated to faster growth as managements did not use cash not paid out in dividends to make investments which added to growth. This observation has been borne out by the actions of many of the top tech companies over the last decade which have proved unable to invest surplus free cash flow profitably. This study undoubtedly provided some of insight that makes dividends an important factor in smart beta portfolios.
In this article with William J Bernstein published in 2019 Arnott pulled together these views arguing that investor expectations that earnings growth could exceed growth in GDP was misplaced. Money saved by not paying dividends was not profitably plowed back into investments which increased growth. In the slow motion crash of tech stocks currently in progress this problem afflicts companies like Meta (META) and Alphabet (GOOG, GOOGL) whose investments of gushing free cash have been described as “science projects.” It’s worth a look at the methodology which led cap weighted indexes to become so top-heavy in a few tech and new business model companies.
How Capitalization Weighted Indexes Are Constructed
Market cap weighting is straightforward and indisputable. It’s all you need for an index like the S&P 500. Just establish market cap by multiplying shares outstanding by that day’s closing price, then rank the constituent elements in descending value. You then calculate the percentage each stock represents and tweak the index holdings to match these percentages. Easy peasy, like estimating peas in a barrel. Where it gets a little tougher is deciding what you mean by “growth” and “value.” The University of Chicago Center For Research Into Security Prices (CRSP) used by Vanguard has the following criteria for Growth and Value:
GROWTH FACTORS USED IN MULTI-FACTOR MODEL
- Future Long-term Growth in Earnings Per Share
- Future Short-term Growth in Earnings Per Share
- Three-year Historical Growth in Earnings
- Three-year Historical Growth in Sales
- Current Investment-to-Assets Ratio
- Return on Assets
The estimates for both long- and short-term growth are sourced from I/B/E/S (Institutional Brokers’ Estimate System) which derives data from over 18,000 analysts. This, again, is highly dependent upon the wisdom of a crowd – in this case a very specific crowd which is known to make errors from time to time. Many studies have shown that estimates of future sales, earnings, and cash flow tend are often wrong. The above section on smart-beta lays out a few of the reasons. Estimates of future growth thus hang upon conjecture, the very stuff of crowd wisdom, which is right until it’s wrong. Perhaps even more important is the complete absence of anything involving price or valuation. It’s as if there is never too much to pay for growth.
The Value model below is different in that price and valuation are involved in all five criteria. Note that the terminology reverses common practice. Price-to-Book Value, for example, becomes Book Value To Price, making both comparable to Dividend Yield. Here are the five factors.
- Book to Price
- Future Earnings to Price (3 years)
- Historical Earnings to Price (3 years)
- Dividends to Price
- Sales to Price
While price is a factor for the Value model, it’s important to note that it’s used only for classification of stocks for placement in Growth and Value indexes. They play no part in weighting, however, as that is done entirely on the basis of capitalization.
Smart-Beta Weighting
It should not be surprising that the criteria for Fundamental weighting has some similarities to the CRSP criteria for Value. There are only so many ways to measure “economic footprint.” The major difference in weighting, where market cap means nothing and weighting in the Fundamental index is driven entirely by rankings assigned on the basis of sales, book value, dividends plus buybacks and free cash flow. Instead of future earnings, a single number is assigned to Profits. Some or all of the above numbers become the raw data for stock weightings. This data is then compared to stock price. The market capitalization has no role at all.
These subtle shifts serve to pull so-called “value” and “growth” into a single large index drawn not from the S&P 500 but from the larger Russell 1000 or an index of large and mid caps. For this reason, FNDX, the Schwab Fundamental U.S. Large Cap Index, can be compared to both the universe of large cap stocks and the large cap value index. It includes all the stocks in the former while the reduction of the influence of growth stocks makes it comparable to a Value index like VTV. It’s very similar to the Invesco FTSE RAFI U.S. 1000 ETF (PRF) which holds about a third more stocks, all smaller caps.
The Numbers Provide A Few Revealing Comparisons
Here’s a table comparing the important metrics:
|
Vanguard Value ETF (VTV) |
Schwab Fundamental U.S. Large Company Index (FNDX) | Invesco FTSE RAFI US 1000 ETF (PRF) | Vanguard S&P 500 ETF (VOO) | Vanguard Growth ETF (VUG) | |
|---|---|---|---|---|---|
| Number of stocks | 341 | 719 | 999 | 503 | 249 |
| Median Mkt Ca[ | $119.5 | $93.4 billion | $76.7 | $147.0 | $222.0 |
| P/E ratio | 15.7 | 13.7 | 13.6 | 19.5 | 27.0 |
| P/B ratio | 2.6x | 2.3x | 2.2x | 3.7x | 7.1x |
| Div Yield | 2.33% | 1.9% | 3.12% | 1.55% | 1,52% |
| ROE | 14.7% | — | — | 22.3% | 32.9% |
| Earnings growth | 12.9% | 14.1% | 13.9% | 19.6% | 26.9% |
| Turnover | 8.9% | 11.0% | 10.0% | 2.3% | 7.6% |
| Exp. Ratio | .04 | .25 | .39 | .03 | .04 |
| AUM | 149.3B | 9.7B | 5.8B | 748.1B | 126.7B |
The numbers which stand out here are P/E, P/B. and earnings growth. The PRF Index ETF in particular is cheaper as measured by P/E and P/B ratios, yet enjoyed faster growth than Vanguard’s Value. It also pays a much higher dividend. In all cases this was aided by the fact that it includes more mid-cap and small-cap stocks in its 999 stock portfolio. Small cap stocks, like the 7% covered in the Morningstar Small Cap Index, now trade at a P/E ratio of 12.6 as compared to the 20.2 P/E ratio of large caps while mid caps trade around a 13.5 P/E. While P/E ratios and earnings growth are pulled higher in VOO, and higher yet in VUG (Growth) by the large tech winners, the deep value stocks among small and mid-caps surprisingly pull earnings growth higher than the numbers for large cap value.
The larger number of stocks included in two fundamental index funds also contributes to the higher level of turnover. This a factor in their higher expense ratios, while the much cheaper Vanguard expense ratios are aided by their larger Assets Under Management.
The table below shows relative representation in key market sectors. The important numbers include the fact that HealthCare is almost three times the weight in VTV (Value) as in VUG (Growth), while there’s five times as much Tech in (VUG) as in (VTV). Both Fundamental Indexes contain more HealthCare than VUG and more Tech than VTV, reflecting the fact that some HealthCare and Tech companies omitted from the Value and Growth ETFs are included though in smaller size in the Smart-Beta format, which also includes smaller Tech and Health Care companies. The massively larger P/E and P/B ratios of the Growth ETF (VUG) suggest the degree to which positive market opinion, the supposed “Wisdom of Crowds,” exceeds fundamental factors. The fundamentalist perspective is that future growth is a matter of conjecture and often not borne out by facts.
| Ticker Symbol | VTV | FNDX | PRF | VOO | VUG |
| Communication services | 3.23% | 7.44% | 7.39% | 7.36% | 11.77% |
| Consumer cyclical | 2.38% | 8.84% | 8.20% | 10.59% | 18.88% |
| Consumer defensive | 11.34% | 9.02% | 8.79% | 7.38% | 2.87% |
| Energy | 8.85% | 9.83% | 9.95% | 5.37% | 1.46% |
| Financial services | 20.04% | 17.52% | 19.16% | 13.61% | 6.88% |
| Health care | 22.76% | 13.98% | 14.36% | 15.42% | 7.92% |
| Technology | 7.83% | 14.78% | 11.31% | 23.60% | 41.3% |
Three Charts And A Table
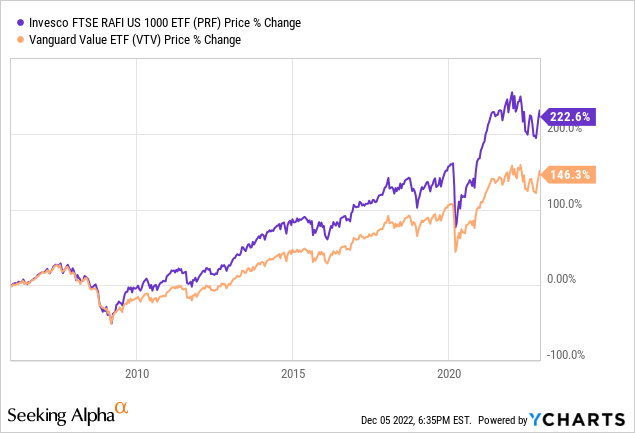
Since inception in 2005 the Invesco FTSE RAFI US 1000 ETF (PRF) has trounced Vanguard’s Value Index ETF (VTV) as shown in the chart below, and that’s before the impact of dividends which are higher for PRF. This first few years were friendly to small cap stocks, but the period following the Great Recession featured large caps. A similar comparison to the Large Cap Growth index (VUG) would show growth winning narrowly on price before dividends. Dividends would improve the performance of the Fundamental index by more than 1% annually and make the two indexes in a dead heat.
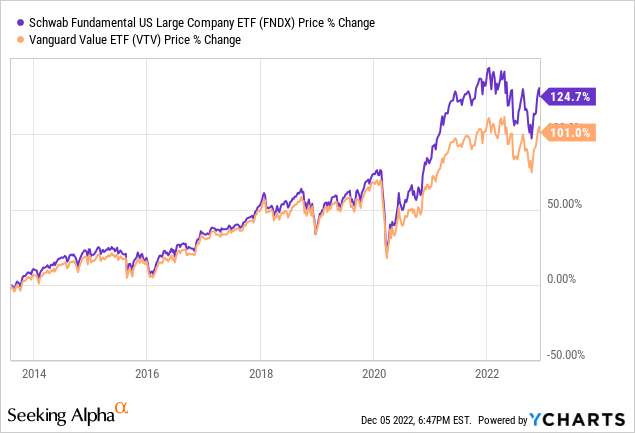
The Schwab Fundamentals Large US Company Index ETF (FNDX) has only been around since 2013 but here’s the chart showing that the Fundamentals Index also trounced the cap weighted Value Index over that period.
One might well wonder whether the Smart Beta indexes actually beat a simple equal-weight index. There is a similarity in the fact that both lack the growth behemoths on cap weighted scale. Here’s the chart:
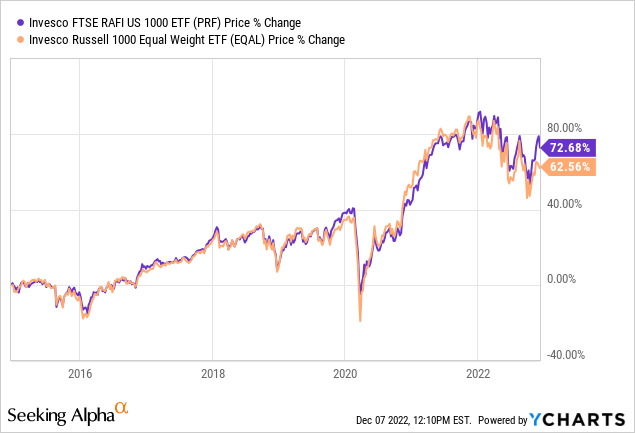
The chart confirms the fact that Smart Beta beats equal weight. It does so, by the way on all time frames, with the gap widening as time increases. The factors which make the Smart Beta approach beat Equal Weight are apparent after a bit of thought about the implications of the following table:
FNDX |
PRF |
EQAL |
| 1. Apple 3.72% | 1.ExxonMobil 2.79% | 1.AristaNetworks. 52% |
| 2. ExxonMobil 2.78% | 2. Berkshire Hathaway 2.46% | 2. AT&T .52% |
| 3. Berkshire Hathaway1.99% | 3. Apple 1.88% | 3. Arista Networks .51% |
| 4. Microsoft 1.92% | 4. Chevron 1.80% | 4. Cisco Systems .50% |
| 5. JP Morgan 1.85% | 5. JP Morgan 1.78% | 5. Motorola .49% |
| 6. Chevron 1,75% | 6. AT&T 1.68% | 6. Comcast A .48% |
| 7.AT&T 1.64% | 7. Microsoft 1.60% | 7. T-Mobile US .47% |
| 8.Walmart 1.34% | 8. Johnson & Johnson 1.26% | 8. Ciena Corp .46% |
| 9. Wells Fargo 1.31% | 9, Wells Fargo 1.20% | 9. Charter Comm ..45% |
| 10. UnitedHealth 1.28% | 10. UnitedHealth 1.18% | 10. Ubiquiti .44% |
| Total 19.56% | 17.62% | 4.85% |
| 723 Holdings | 1003 Holdings | 999 Holdings |
The key numbers are the percentages of the individual stocks and the total percentage of the top 10 stocks. The fact that the top 10 stocks in both Smart Beta indexes contain upwards of 20% of the total index shows that the criteria for selection were very much able to pick companies with outstanding “economic value.” While the weight of the top 10 is nothing like their 48% of the Growth Index (VUG), it’s not far short of the 27% in the S&P 500 (VOO). The short answer as to why the Fundamentals Indexes beat the equal-weight index is that while they bear some similarity to equal weight, their weightings leave room for overweighing companies which are superior on underlying measures of value.
The majority of the top ten in both Fundamentals ETF are value stocks ranging from Berkshire Hathaway (BRK.A)(BRK.B) and UnitedHealth (UNH) to more out of favor stocks such as two large integrated large-cap oil companies, Exxon Mobil (XOM) and Chevron (CVX). What this communicates to individual investors is that these stocks are undervalued by the cap weighted indexes. Put more precisely, XOM and CVX rank quite a bit higher when ranked by fundamentals than when ranked by the aggregate opinion of the crowd.
Even more intriguing is the fact that Apple (AAPL) and Microsoft (MSFT), which do not appear in Value indexes but are ranked No. 1 and No. 2 in both the Total S&P 500 Index and the Growth Index were also ranked in the top four of both Smart Beta indexes. One effect is that the 3.72%% representation of Apple in the Schwab Index (FNDX) is about seven times its weighting in the equal weight index. The second takeaway is that fundamental weightings go a long way in assessing how much of the high rankings of rapid growth stocks stems from market opinion and how much stems from underlying fundamentals.
For Apple and Microsoft investors that’s good news, as the two stocks are ranked high in the factors used by both fundamentals indexes. In short, they rose to the top on concrete results rather than market infatuation. For investors interested in these companies it may further suggest that their position in the Vanguard indexes is grounded in real value as well. Neither AAPL nor MSFT are necessarily cheap buys, but their prices seem closer to a fair value based on results than other growth leaders. Investors in the integrated oils might also take comfort in the knowledge that crowd conjecture seems to be overruling solid fundamentals.
Conclusion
Every method from the comparative metrics to price charts suggests that the two ETFs constructed on fundamentals, FNDX and PRF, are likely to outperform cap weighted indexes for a period of years. They may, in fact, also outperform cap weighted growth which is burdened with growth stock valuations which have not yet come down to earth. They also should continue to outperform equal weight indexes which appear somewhat more similar than they really are.
Both fundamentals indexes have their points. FNDX has performed slightly better than PRF (1-2%) in Vanguard tables of 1, 3, 5, and since origin tables. It also has the lower expense ratio, .25% versus .39% for PRF. PRF might be the choice of some investors because of its larger 3.12% dividend. My choice is FNDX, and it is a Buy.
Be the first to comment