


Mindaugas Dulinskas/iStock via Getty Images
Introduction
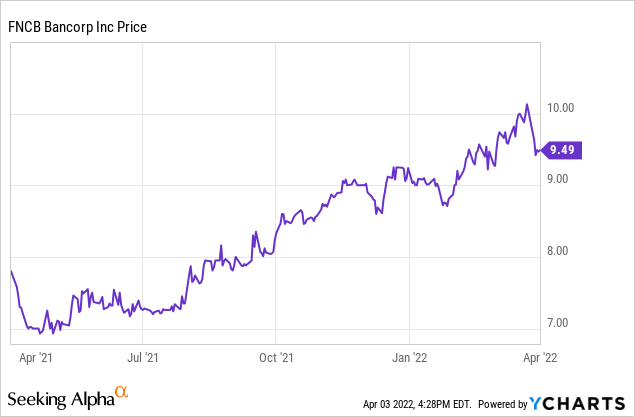
FNCB Bancorp (NASDAQ:FNCB) is the holding company which owns the FNCB Bank, a small community bank in Pennsylvania where it operates 17 branches. A very small bank with a total balance sheet size of approximately $1.66B trading at less than 10 times its 2021 earnings. I wanted to have a closer look at the assets on the bank’s balance sheet to see if this $190M market cap bank could make it onto my shortlist of regional banks and community banks.
Strong results in 2021 and the low amount of provisions doesn’t bother me
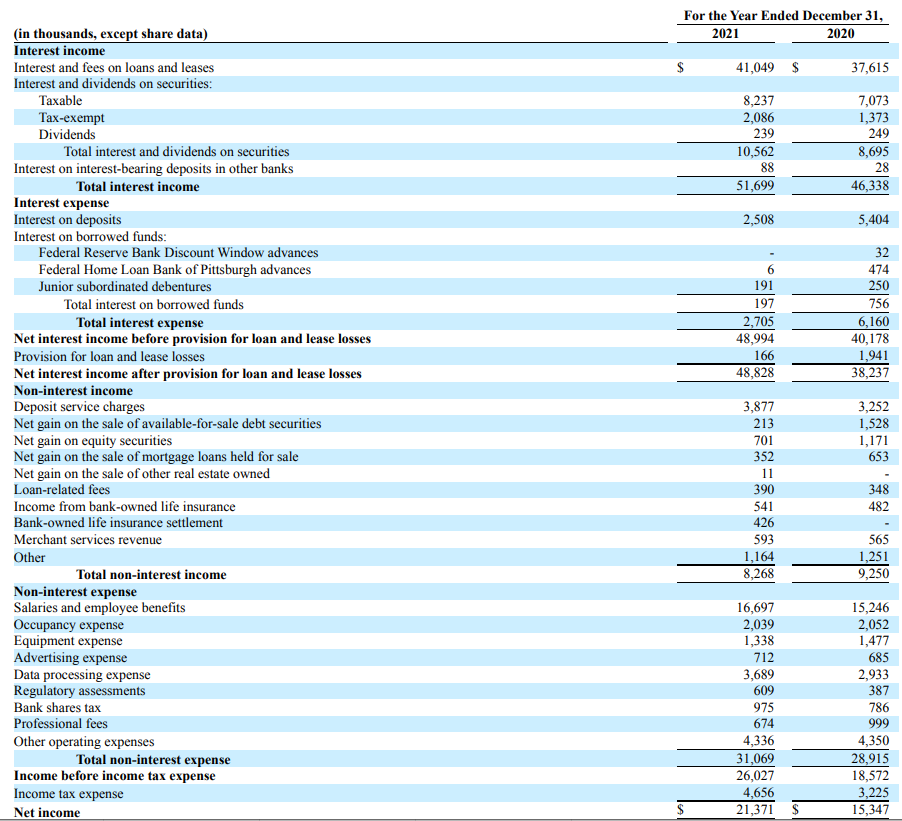
2021 was indeed a very strong year for FNCB Bancorp thanks to the relatively low amount of provisions for loan losses. The total interest income increased by more than 10% to $51.7M while the interest expenses decreased by almost 60% to $2.7M. The combination of both elements resulted in an increase of the net interest income by in excess of 20% to $49M.
FNCB Investor Relations
The bank also recorded a total net non-interest expense of just under $23M (that’s higher than the $19.7M in FY2020 due to higher data processing expenses and higher G&A expenses) resulting in a pre-tax and pre loan loss provision income of $25.9M. The total tax bill was just $4.7M and the bank recorded just $166,000 in loan loss provisions, and this resulted in a net income of $21.4M for an EPS of $1.06.
Keep in mind the EPS is based on the average share count of 20.11M shares outstanding but the total share count had dropped to just under 20 million shares by the time the annual report was published as FNCB Bancorp continues to repurchase its own shares. This would boost the EPS by an additional cent to $1.07 per share.
That sounds great, but keep in mind the bank added almost nothing to the loan loss provisions which means that once the loan loss provisions normalize, the reported net income will likely decrease (unless, of course, the interest margin increases). We shouldn’t exaggerate the impact of higher loan loss provisions as the total amount of provisions remained below $1M in 2019, the pre-COVID year.
The balance sheet is focusing on liquid securities
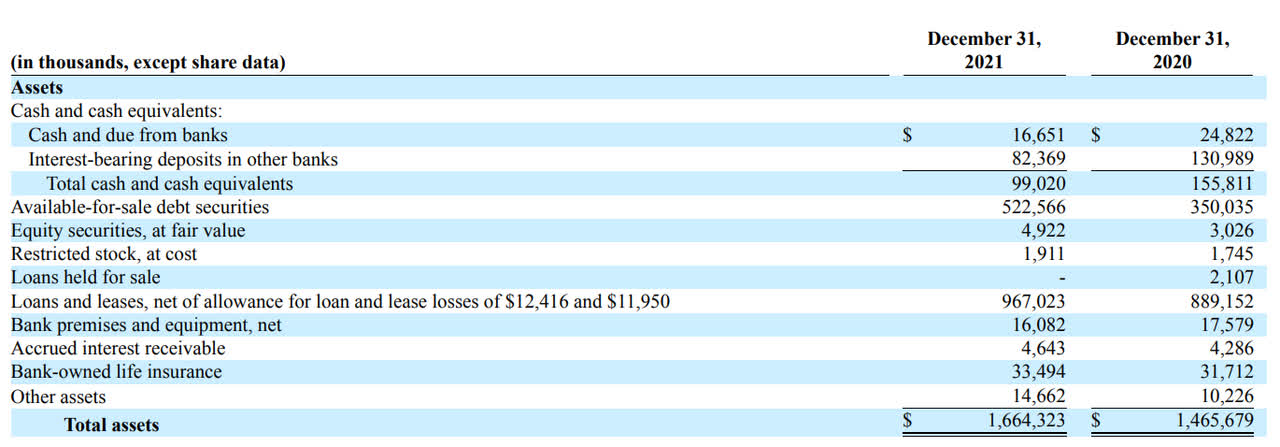
But it does mean I’d like to have a better idea of what the bank has actually invested its money in. And the screenshot below of the asset side of the balance sheet immediately shows you the bank is investing a very large percentage of its assets in securities that should be very liquid.
FNCB Investor Relations
Of the $1.66B, roughly $100M (6%) is held in cash while the total amount invested in debt securities has increased by almost 50% in the past year and now represents 31% of the total assets. This means that about 37% of the assets is invested in cash and liquid securities (compared to 34.5% as of the end of 2020) and that is a rather high percentage. It is also interesting to see that the total amount of assets increased by $200M and the bank is using a ‘safe’ approach by increasing its exposure to debt securities.
FNCB Investor Relations
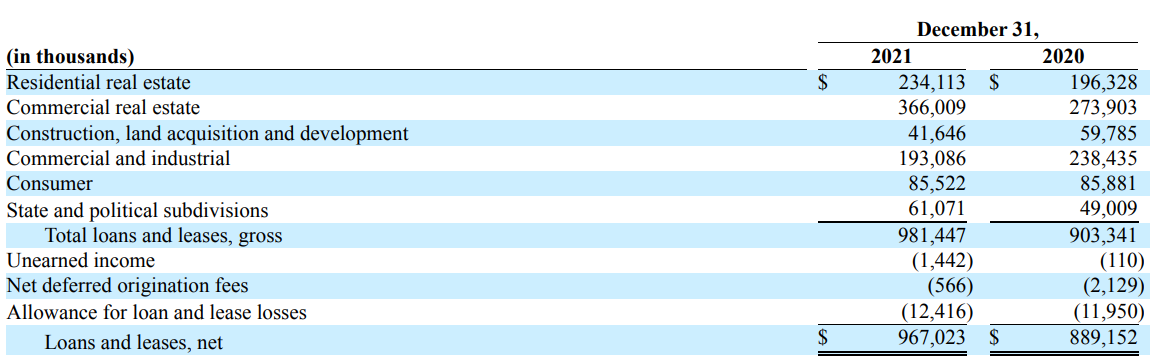
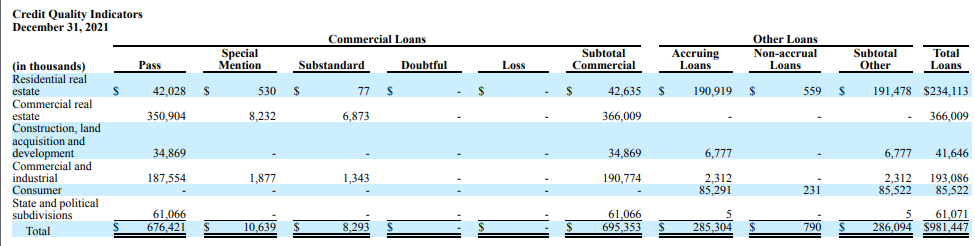
Looking at the breakdown of the loan book, I’m glad to see about 25% of the loan book consists of residential real estate. The relatively high amount of commercial and industrial loans is interesting as well. Those include almost $22M in PPP loans which should also be seen as ‘very safe’ considering they are backed by the Small Business Administration.
FNCB Investor Relations
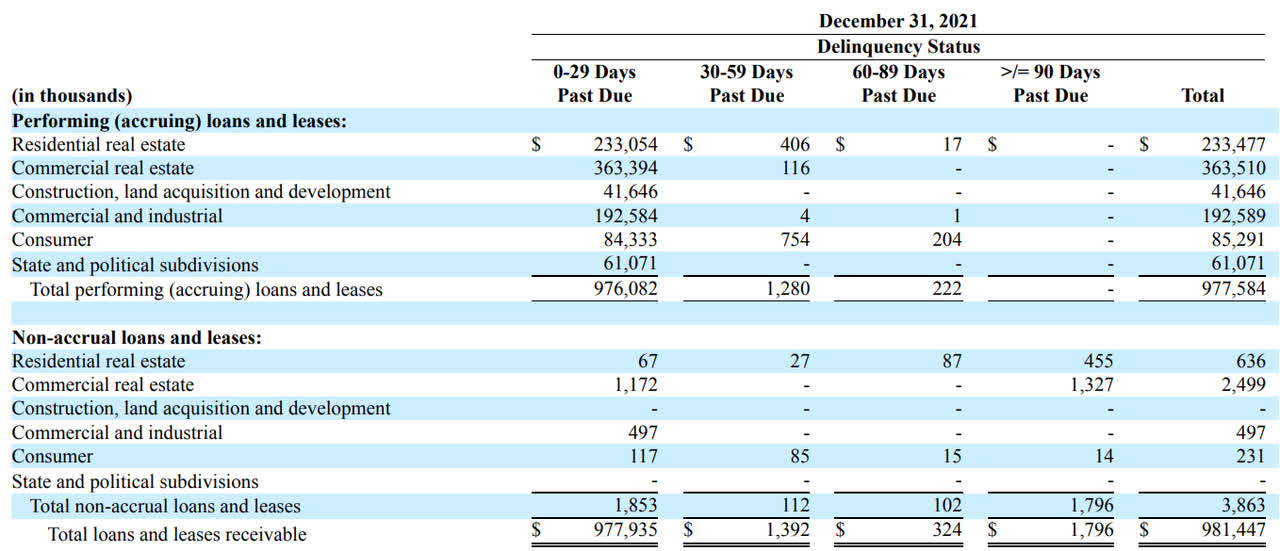
Interestingly, less than $2M of the total loan book is now classified as a non-accrual loan, and less than $4M of the loan book has a ‘past due’ status. This means the current accumulated loan loss provision of $12.4M appears to be more than sufficient to cover potential loan losses based on the current situation. Also keep in mind there’s collateral on those real estate loans so even if the bank needs to foreclose on the $1.8M in residential and commercial real estate loans that are more than 90 days past due, it is very unlikely FNCB Bancorp wouldn’t be able to recoup a substantial part of the loan.
FNCB Investor Relations
Investment thesis
Although the total amount of loans that are classified as non-accruing loans is low, I would have liked to see some more data on the average LTV ratios of the loan book as nor the annual report nor the most recent investor presentation on the bank’s website are offering more color on that.
Even when the loan loss provisions normalize (increase), the EPS should remain above $1, especially as FNCB continues to repurchase its own shares. Trading at less than 10 times its earnings, FNCB Bancorp is not expensive at all. The current quarterly dividend is $0.075 per share resulting in a full-year dividend of $0.30 for a dividend yield of 3.16%. That’s not high, but keep in mind the payout ratio of this bank is less than 30% as FNCB retains a substantial portion of its earnings to further expand its balance sheet.
The tangible book value per share was approximately $8.12 as of the end of last year, and as FNCB retains about 70% of its earnings, we can reasonably assume the book value will increase by about 70-75 cents per year and that makes the current valuation of less than 1.2 times TBV and less than 10 times earnings very interesting.
I don’t have a position in FNCB Bancorp, but I am adding the bank to my watch list.
Be the first to comment