

martin-dm/E+ via Getty Images
A Quick Take On Flywire
Flywire Corporation (NASDAQ:FLYW) went public in May 2021, raising approximately $251 million in gross proceeds in an IPO that priced at $24.00 per share.
The firm enables companies to easily receive payments in countries worldwide.
While some investors may see a bargain in FLYW, given Flywire’s uneven results and headcount additions going into what is likely a recession, I’m on Hold for FLYW.
Flywire Overview
Boston, Massachusetts-based Flywire was founded to develop a SaaS platform providing enterprises with the ability to charge and receive payments in countries around the world.
Management is headed by Chief Executive Officer Michael Massaro, who has been with the firm since 2012 and has previously held positions of increasing responsibility in various technology companies such as edocs and Carrier IQ.
The company’s primary offerings include:
-
Payment platform
-
Vertical specific software
-
Proprietary global payment network
The firm seeks relationships with cross border oriented firms via its dedicated sales and marketing team as well as through a third party sales force and partners.
The company’s system has launched several thousand client payment portals, customized for the relevant client vertical.
Market & Competition
According to a 2020 market research report by Juniper Research, the global market for B2B cross border payments was an estimated $27 trillion in 2020 and is expected to reach $35 trillion by 2022.
This represents a forecast growth of 30% over the two year time period.
The main drivers for this expected growth are a growth in instant payments, where funds settle in 10 seconds or less.
Also, blockchain-based services have significant potential, but require additional development to achieve their ultimate value.
Major competitive or other industry participants include:
-
DLocal
-
AstroPay
-
Directa24
-
Others
FLYW’s Recent Financial Performance
-
Total revenue by quarter has trended upward unevenly over the past 5 quarters:
5 Quarter Total Revenue (Seeking Alpha)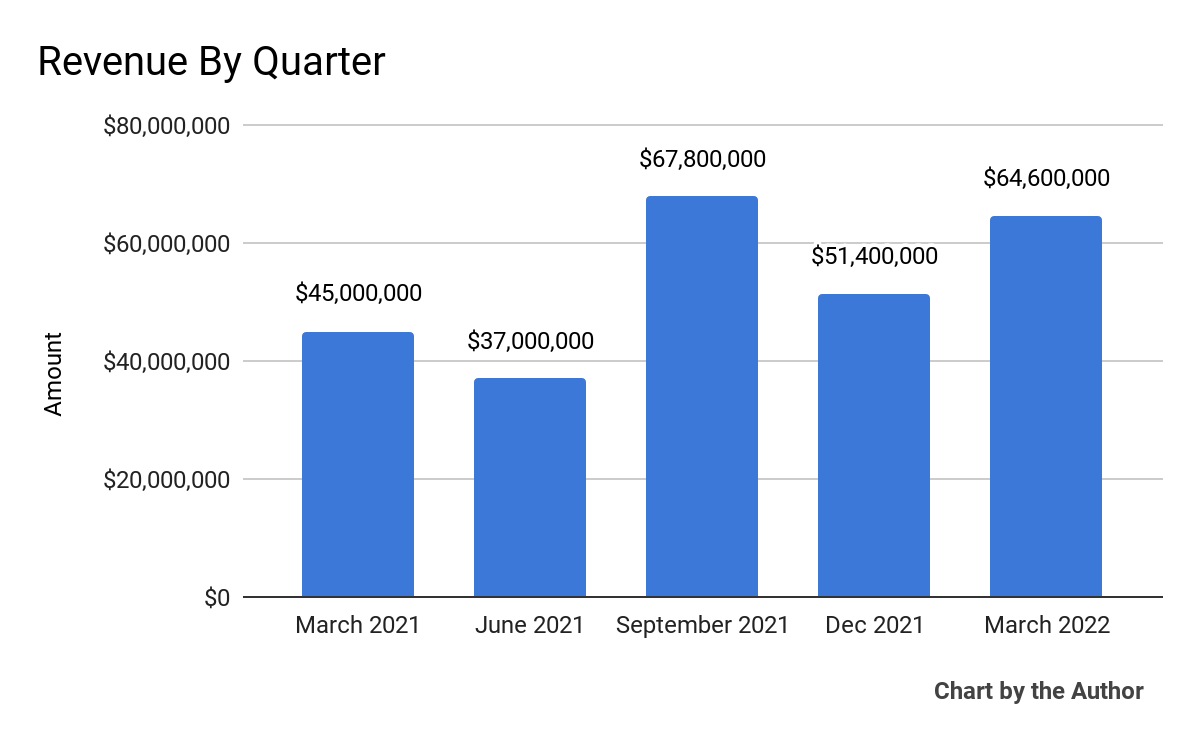
-
Gross profit by quarter has followed a similarly uneven trajectory as that of total revenue:
5 Quarter Gross Profit (Seeking Alpha)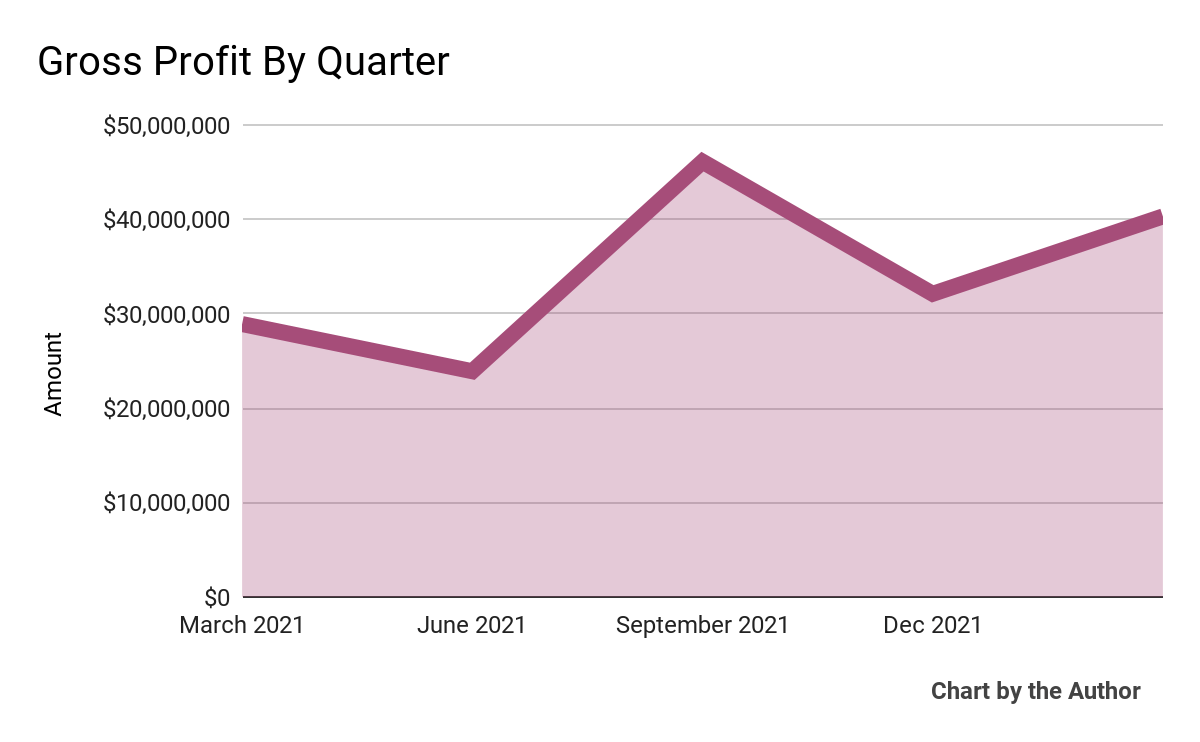
-
Selling, G&A expenses as a percentage of total revenue by quarter have largely remained within a tight range, with the exception of Q3 2021:
5 Quarter Selling, G&A % Of Revenue (Seeking Alpha)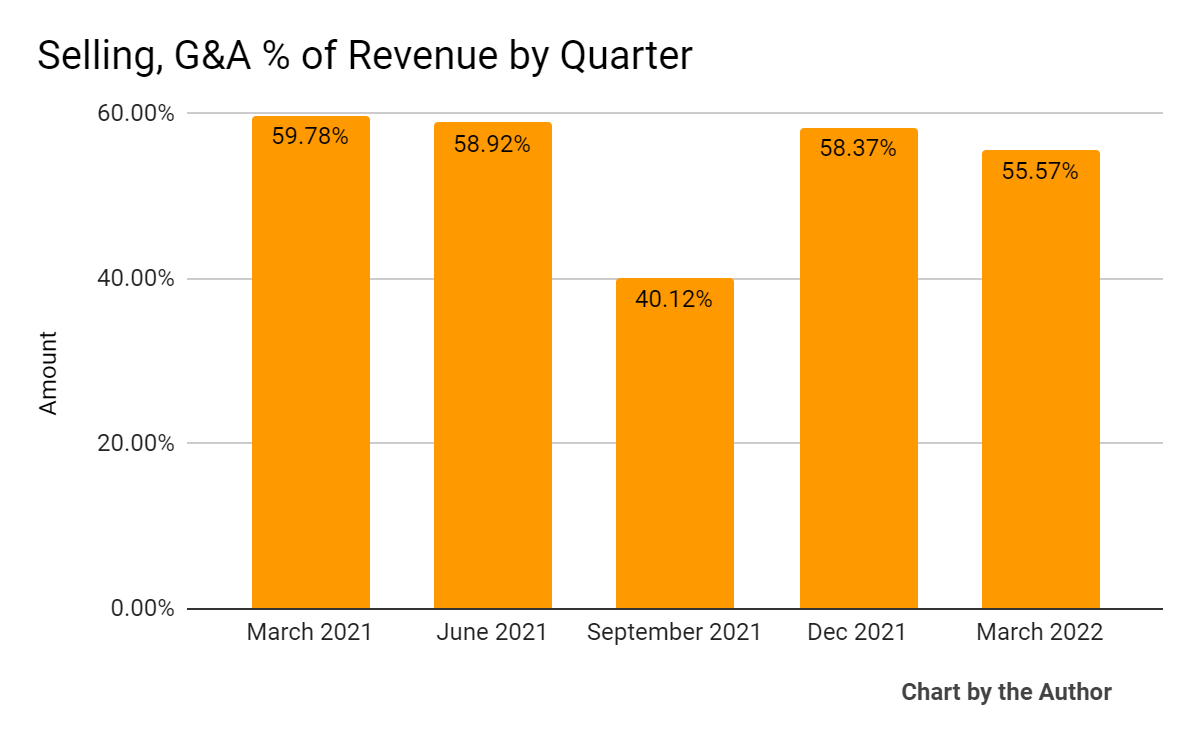
-
Operating income by quarter has been negative with the exception of Q3 2021:
5 Quarter Operating Income (Seeking Alpha)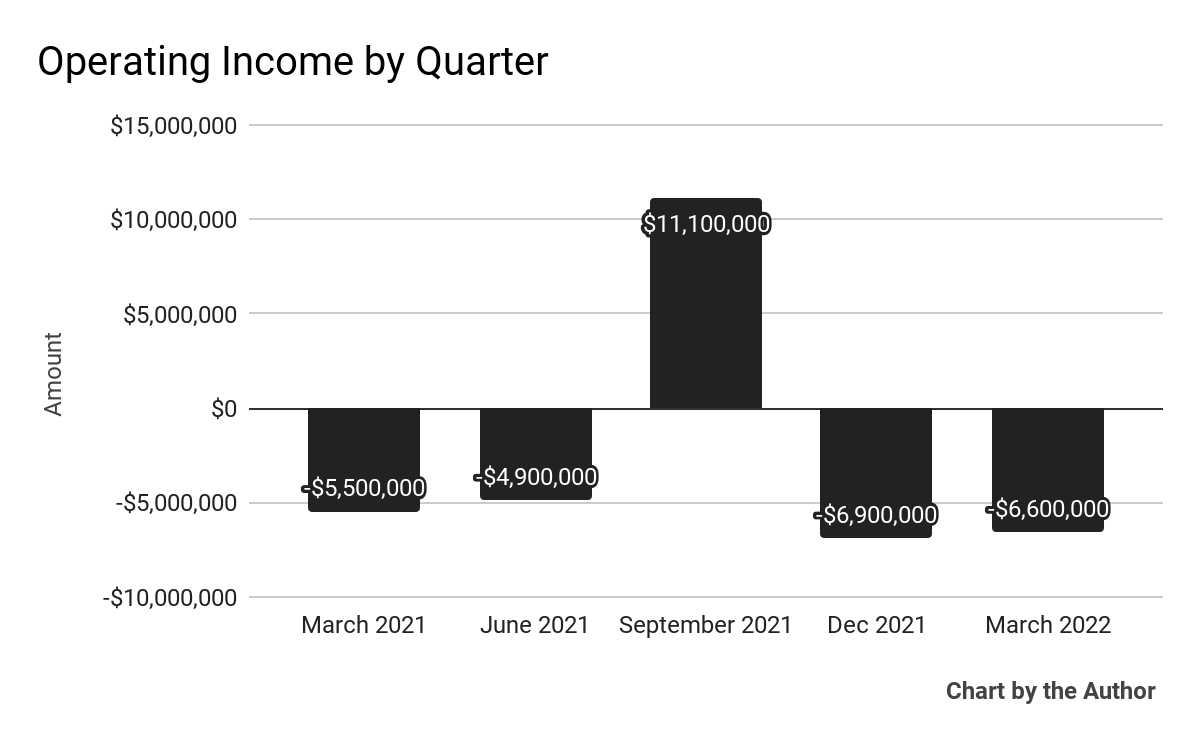
-
Earnings per share (Diluted) have been negative except for Q3 2021:
5 Quarter Earnings Per Share (Seeking Alpha)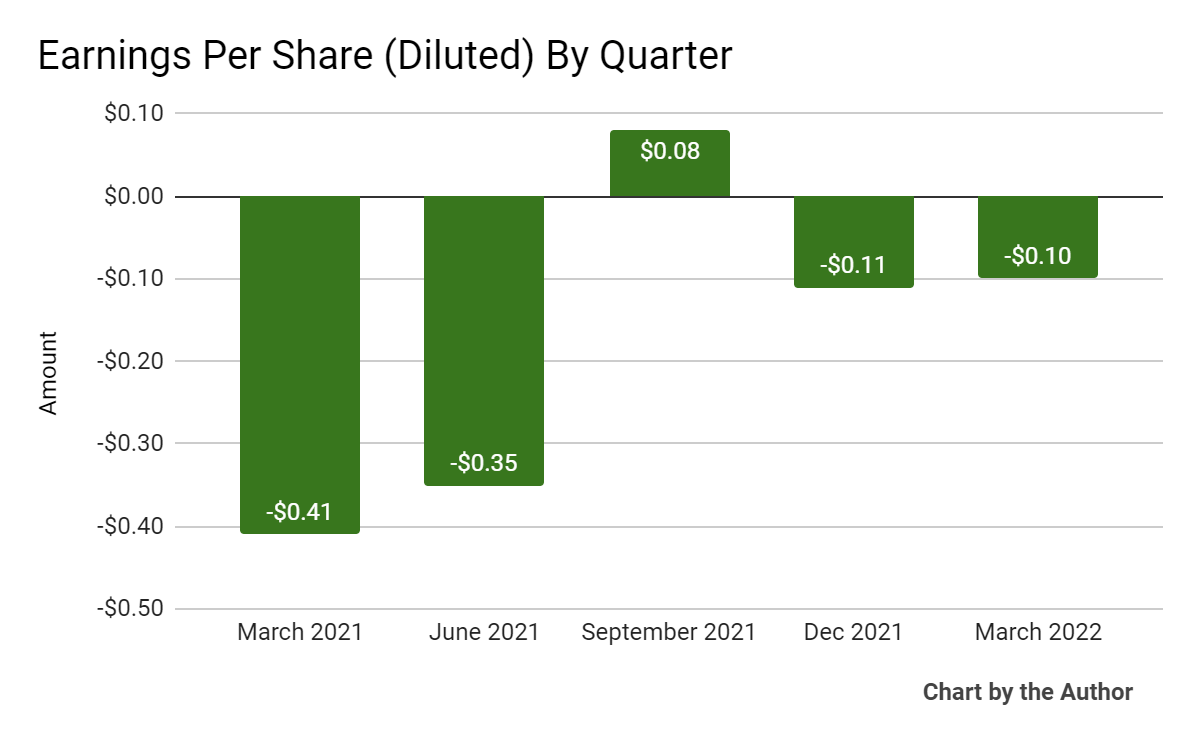
In the past 12 months, FLYW’s stock price has dropped 48.1 percent vs. the U.S. S&P 500 index’ fall of around 13.1 percent, as the chart below indicates:
52 Week Stock Price (Seeking Alpha)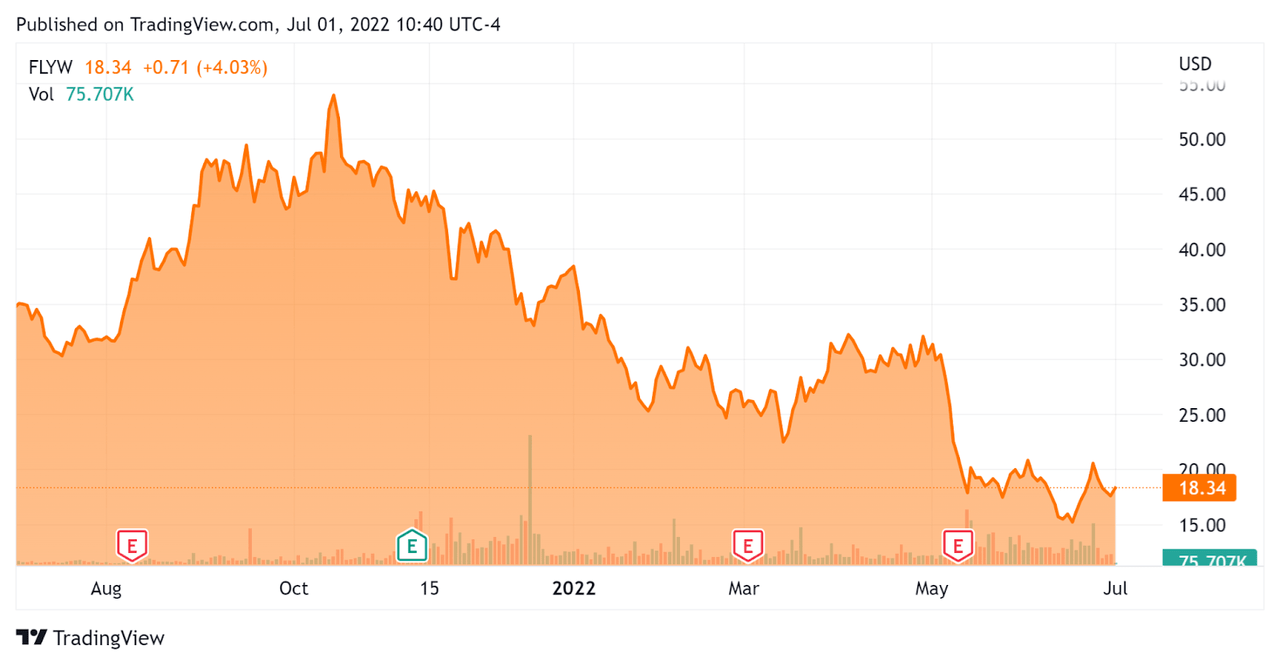
Valuation Metrics For Flywire
Below is a table of relevant capitalization and valuation figures for the company:
|
Measure |
Amount |
|
Market Capitalization |
$1,890,000,000 |
|
Enterprise Value |
$1,550,000,000 |
|
Price / Sales [TTM] |
7.39 |
|
Enterprise Value / Sales [TTM] |
7.04 |
|
Operating Cash Flow [TTM] |
$14,920,000 |
|
Revenue Growth Rate [TTM] |
53.20% |
|
CapEx Ratio |
2.29 |
|
Earnings Per Share |
-$0.48 |
(Source – Seeking Alpha)
As a reference, a relevant public comparable would be DLocal (DLO); shown below is a comparison of their primary valuation metrics:
|
Metric |
DLocal |
Flywire |
Variance |
|
Price / Sales [TTM] |
26.41 |
7.39 |
-72.0% |
|
Enterprise Value / Sales [TTM] |
25.22 |
7.04 |
-72.1% |
|
Operating Cash Flow [TTM] |
$181,000,000 |
$14,920,000 |
-91.8% |
|
Revenue Growth Rate |
130.5% |
53.2% |
-59.2% |
(Source – Seeking Alpha)
Commentary On Flywire
In its last earnings call (Source – Seeking Alpha), covering Q1 2022’s results, management highlighted the firm’s focus on what it calls “high-stakes, high-value payments within industries such as education, healthcare, travel and B2B.”
Management sees favorable trends for the company in these industries, as activity is being restored to pre-pandemic levels in some cases.
For example, in its travel industry focus, the firm sees passenger counts at the end of Q1 2022 reaching 91% of pre-pandemic levels.
Also, in its education space, as pandemic restrictions ease, educational institutions are seeing greater international applications, a favorable trend for Flywire’s payment solutions.
As to its financial and operational results, the firm added 130 clients during the quarter, a high growth rate, reaching 2,700 total customers at quarter end.
Revenue less ancillary services grew at 47% year-over-year and total payment volume increased 46%, with volume growth ‘across all regions, verticals and revenue types’ versus the previous year’s same period.
However, technology and development expenses, along with selling and marketing expenses, grew substantially due to the company’s hiring activities over the past 12 months.
Looking ahead, management raised its forward revenue guidance, now expecting a 2022 annual growth rate of around 40%.
Regarding valuation, the market is valuing FLYW at significantly lower valuation multiples than DLocal, likely due to DLO’s higher growth rate and strong profitability.
The primary risks to the company’s outlook are its recent history of uneven financial results while remaining below operating breakeven.
The stock may see an upside catalyst if management can convincingly reach positive operating results but given the firm’s spending on headcount, it is difficult to see their resolve in this regard.
While some investors may see a bargain in FLYW, given Flywire’s uneven results and headcount additions going into what is likely a recession, I’m on Hold for FLYW.
Be the first to comment