

ipopba
A Quick Take On Flywire
Flywire (NASDAQ:FLYW) reported its Q3 2022 financial results on November 8, 2022, beating expected revenue but missing projected EPS estimates.
The company provides enterprises with cross-border payment technologies and services.
I’m on Hold for FLYW in the near term due to the increasing likelihood of a recession in the U.S. in the coming quarters, negatively impacting transaction volumes and growth potential.
Flywire Overview
Boston, Massachusetts-based Flywire was founded to develop a SaaS platform providing enterprises with the ability to charge and receive payments in countries around the world.
Management is headed by Chief Executive Officer, Michael Massaro, who has been with the firm since 2012 and has previously held positions of increasing responsibility in various technology companies such as edocs and Carrier IQ.
The company’s primary offerings include:
-
Payment platform
-
Vertical-specific software
-
Proprietary global payment network
The firm seeks relationships with cross-border oriented firms via its dedicated sales and marketing team as well as through a third-party sales force and partners.
The company’s system has launched more than 6,000 client payment portals, customized for the relevant client vertical.
Flywire’s Market & Competition
According to a 2020 market research report by Juniper Research, the global market for B2B cross-border payments was an estimated $27 trillion in 2020 and is expected to reach $35 trillion by 2022.
This represents a forecast growth of 30% over the two-year time period.
The main drivers for this expected growth are growth in instant payments, where funds settle in 10 seconds or less.
The report also notes that the rise of real-time payments is having a positive impact on the B2B cross-border payments market.
Another driver is the entry of new players into the market, such as open banking providers and cryptocurrency companies.
While blockchain-based services have significant potential, they will require additional development to achieve their ultimate value.
According to a report by Accenture, 47 percent of consumers would buy more goods and services online if they could use their local currency and said they would be willing to pay extra (2-3 percent) to use their own currency.
While the growth of the B2B cross-border payments market is certainly impressive, there are a few potential obstacles that could impede its further expansion.
One is the potential for regulatory hurdles, as various jurisdictions have different rules and regulations regarding cross-border payments.
Another is the competition from traditional players such as banks and money transfer services.
Finally, there is the challenge of achieving widespread adoption.
Major competitive or other industry participants include:
-
DLocal
-
AstroPay
-
Directa24
-
Others
Flywire’s Recent Financial Performance
-
Total revenue by quarter has grown according to the following chart:
9 Quarter Total Revenue (Seeking Alpha)
-
Gross profit margin by quarter has remained within a narrow range:
9 Quarter Gross Profit (Seeking Alpha)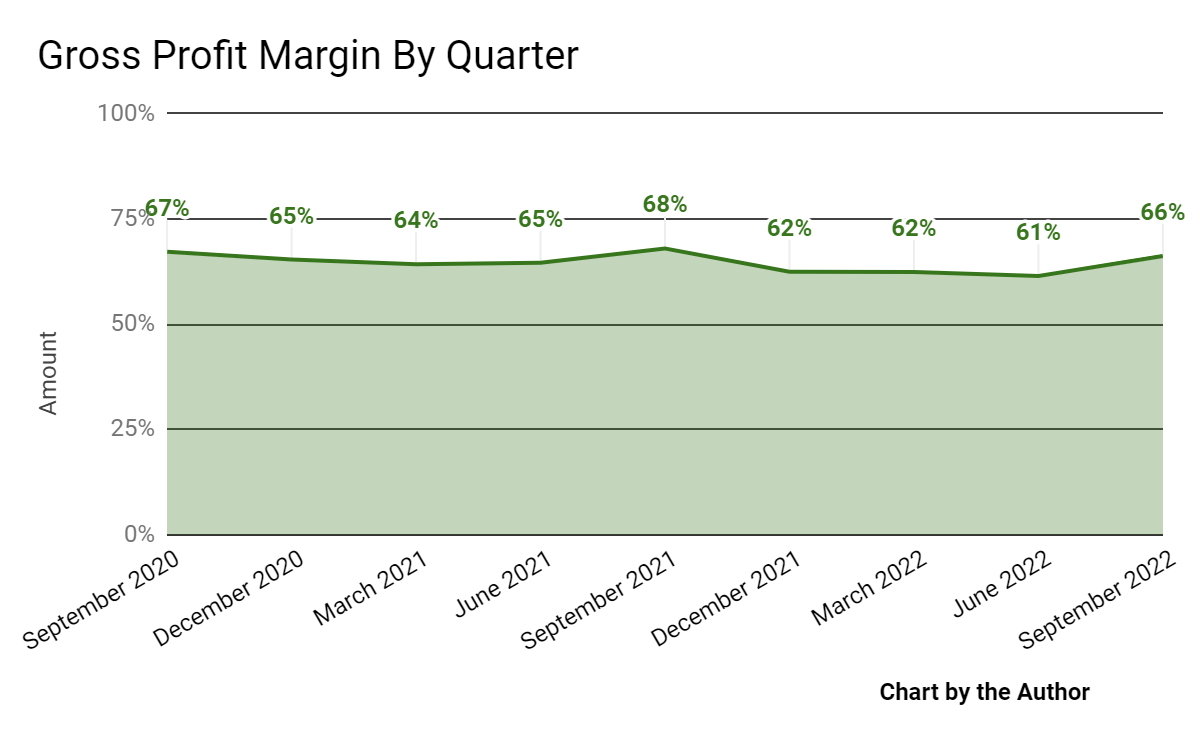
-
Selling, G&A expenses as a percentage of total revenue by quarter have varied substantially in recent quarters:
9 Quarter Selling, G&A % Of Revenue (Seeking Alpha)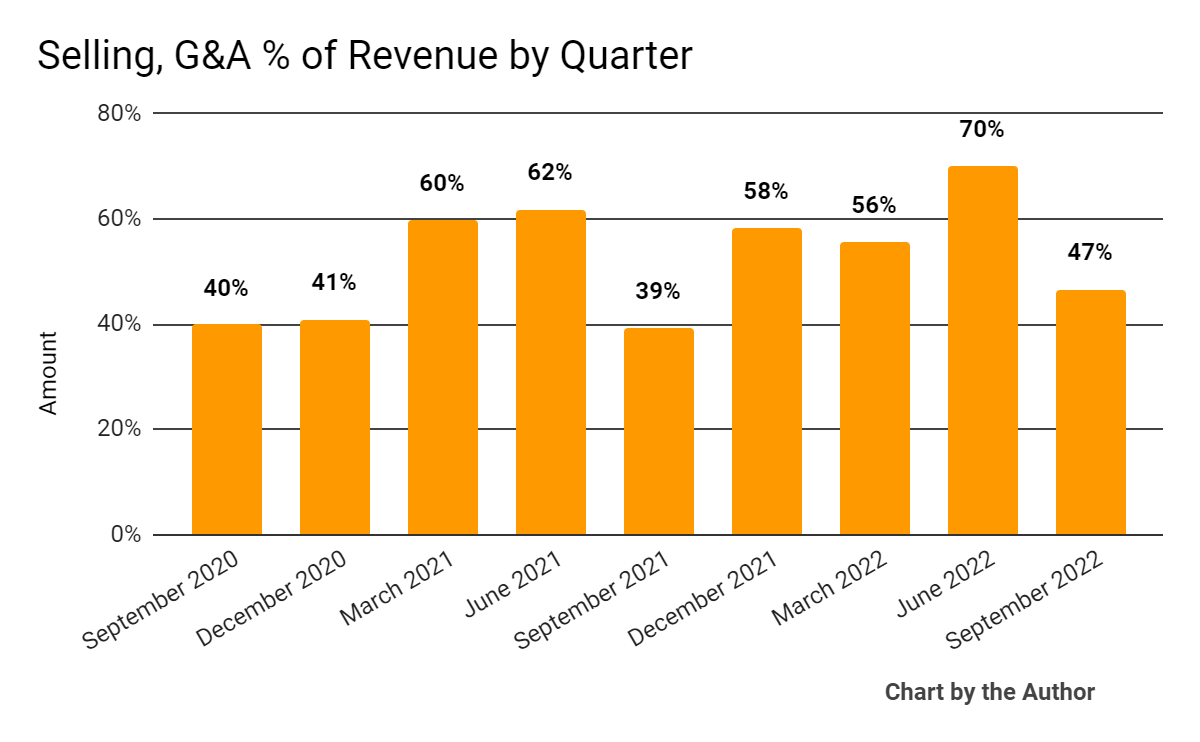
-
Operating income by quarter has alternated between income and loss in the past 9 quarters:
9 Quarter Operating Income (Seeking Alpha)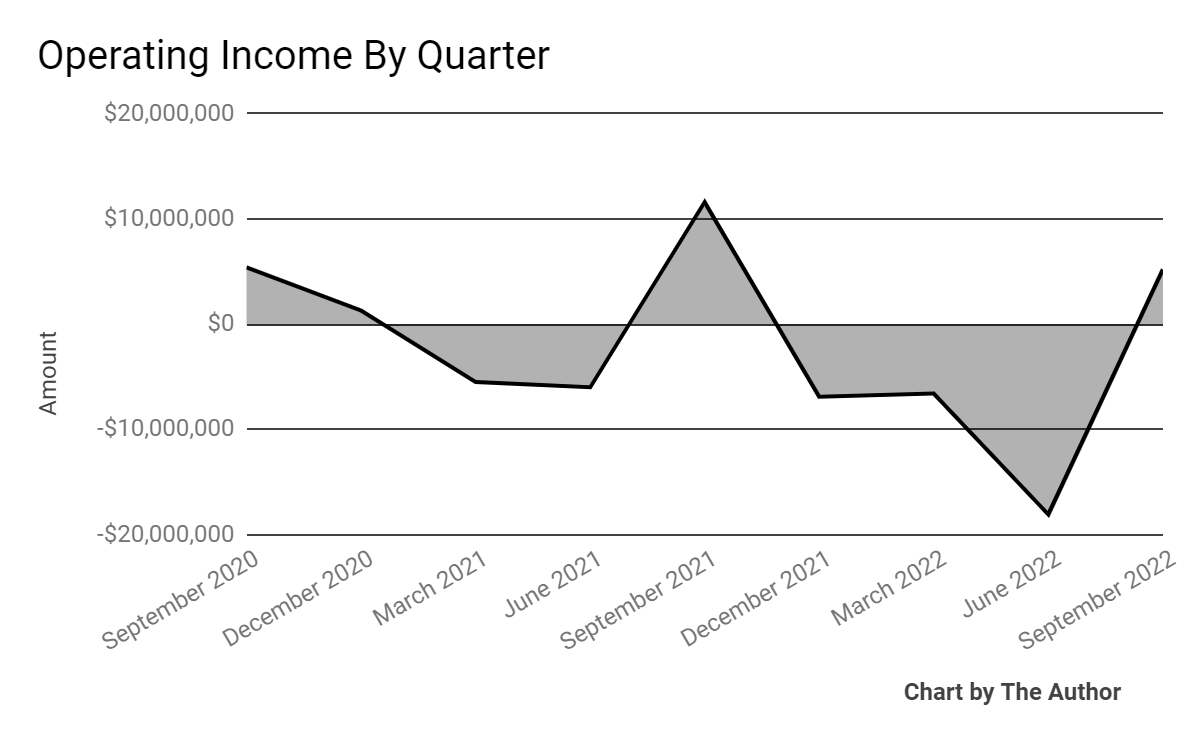
-
Earnings per share (Diluted) have remained negative in seven of the last nine quarters, as the chart shows here:
9 Quarter Earnings Per Share (Seeking Alpha)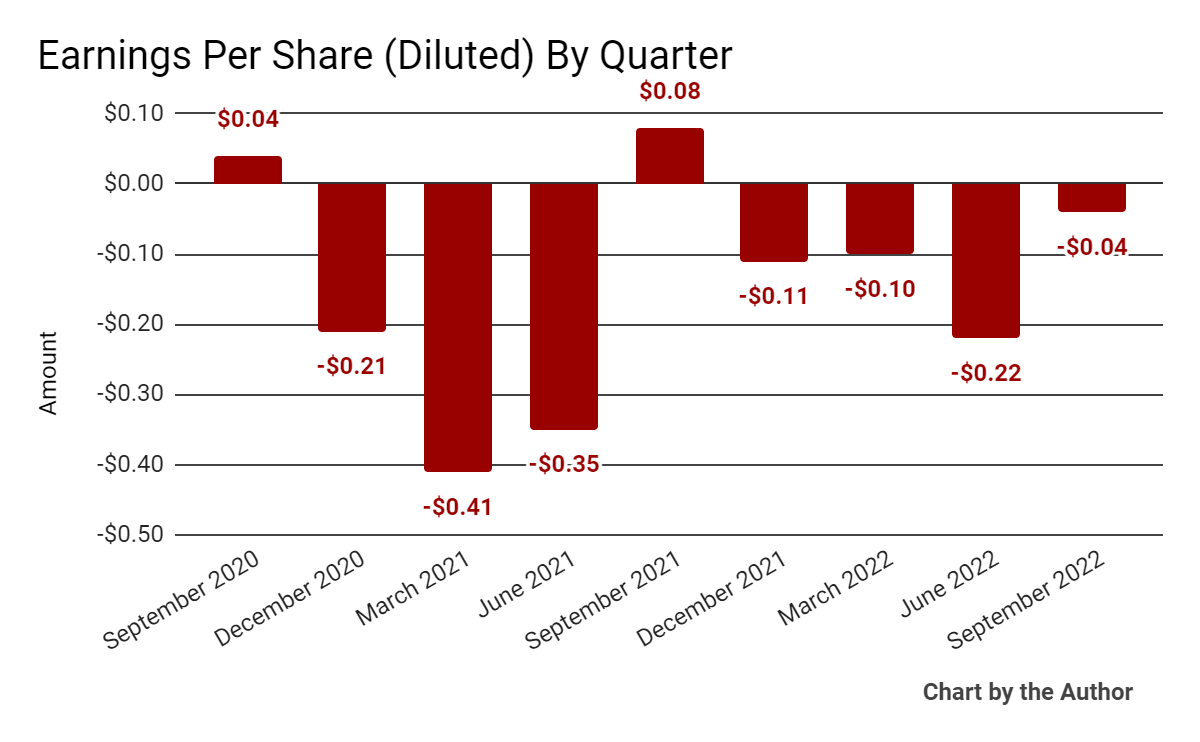
(All data in above charts is GAAP)
In the past 12 months, FLYW’s stock price has fallen 44% vs. the U.S. S&P 500 Index’s drop of around 13.9%, as the chart below indicates:
52 Week Stock Price (Seeking Alpha)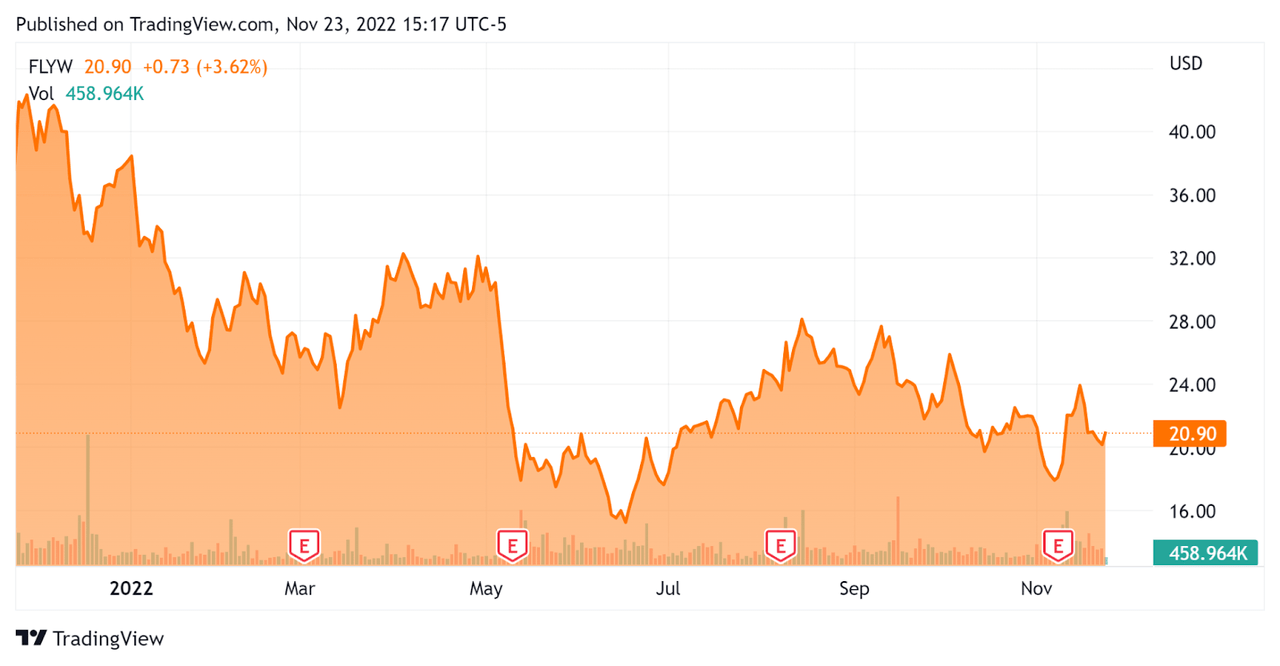
Valuation And Other Metrics For Flywire
Below is a table of relevant capitalization and valuation figures for the company:
|
Measure (TTM) |
Amount |
|
Enterprise Value/Sales |
7.2 |
|
Revenue Growth Rate |
46.3% |
|
Net Income Margin |
-18.5% |
|
GAAP EBITDA % |
-6.4% |
|
Market Capitalization |
$2,230,000,000 |
|
Enterprise Value |
$1,910,000,000 |
|
Operating Cash Flow |
-$35,400,000 |
|
Earnings Per Share (Fully Diluted) |
-$0.47 |
(Source – Seeking Alpha)
Commentary On Flywire
In its last earnings call (Source – Seeking Alpha), covering Q3 2022’s results, management highlighted the growth in its education segment due to seasonal factors.
However, the firm saw slower revenue growth from international students coming from China, although it has low market penetration and high potential for future growth.
The firm is also continuing its efforts to integrate with major healthcare IT electronic healthcare record platforms.
Flywire’s travel segment also notched significant growth due to a continued post-pandemic rebound in demand for travel.
As to its financial results, topline revenue rose 43% year-over-year, an all-time high.
The company’s education segment retention rate was over 130%, indicating strong product/market fit and excellent sales and marketing efficiency.
Adjusted gross profit rose 38% year-over-year to $61.3 million, while adjusted EBITDA was $18.2 million.
For the balance sheet, the firm finished the quarter with cash and equivalents of $349.2 million and $25.9 million in debt.
Over the trailing twelve months, free cash used was $42.0 million, of which capital expenditures accounted for $6.6 million.
Looking to the full year 2022, management raised and tightened its revenue growth rate estimate to 46.5% at the midpoint of the range, despite foreign exchange headwinds from a stronger US dollar.
The team reaffirmed previous guidance for adjusted EBITDA at around $15 million at the midpoint.
Regarding valuation, the market is assigning a slightly higher EV/Revenue multiple than when I analyzed its Q2 financial results.
The primary risk to the company’s outlook is a slowing macroeconomic backdrop going into 2023, which may put a damper on transaction volumes and revenue growth.
However, the firm has recently exceeded operating breakeven and reduced its negative EPS result. So, an upside catalyst would be continued progress toward earnings breakeven.
When earnings breakeven will occur is anyone’s guess and I’m generally quite cautious going into an economic slowdown.
I’m, therefore, on Hold for FLYW in the near term due to the increasing likelihood of a recession in the U.S. in the coming quarters.
Be the first to comment