


sham prakash/iStock via Getty Images
India is gaining traction, even as China slips
At a time when global GDP growth in 2023 is expected to come in at 2.9%, India is expected to deliver a GDP growth rate of over 2x that number, at 6.1%. Last year, both China and India were neck and neck in the GDP battle, with both delivering growth rates in excess of 8%, but there’s little doubt which way the wind is blowing.
In 2023, China will likely only witness growth of 4.9%, and its decision to prioritize public safety ahead of growth has no doubt sullied its ability to attract ample external fund flows. Whilst the country still continues to be an integral cog of the global supply chain, companies the world over, are now adopting a China-plus-one supply chain policy. India looks like one of the prime candidates to benefit from this shift and recent reports suggest that it is pulling out all the stops to emerge as a notable manufacturing hub. The Modi administration is currently putting in place a $1.2 trillion digital platform titled “PM Gati Shakti” that will leverage technology and look to fast-track projects with limited time and cost overruns.
India has also been offering attractive subsidies to foreign manufacturing specialists and it now appears that in three years’ time, something like an Apple could have 25% of its iPhone manufacturing capacity in India alone.
These changing dynamics are also being reflected in global investor positioning; according to EPFR Global, Global EM fund allocations towards India are at record highs, whilst funds towards China have only seen modest upticks after witnessing a sharp drop for much of the year. This is also mirrored in the relative performances of the MSCI China and India indices where the return differential of 33% in Q3-22 was the widest in over 22 years!
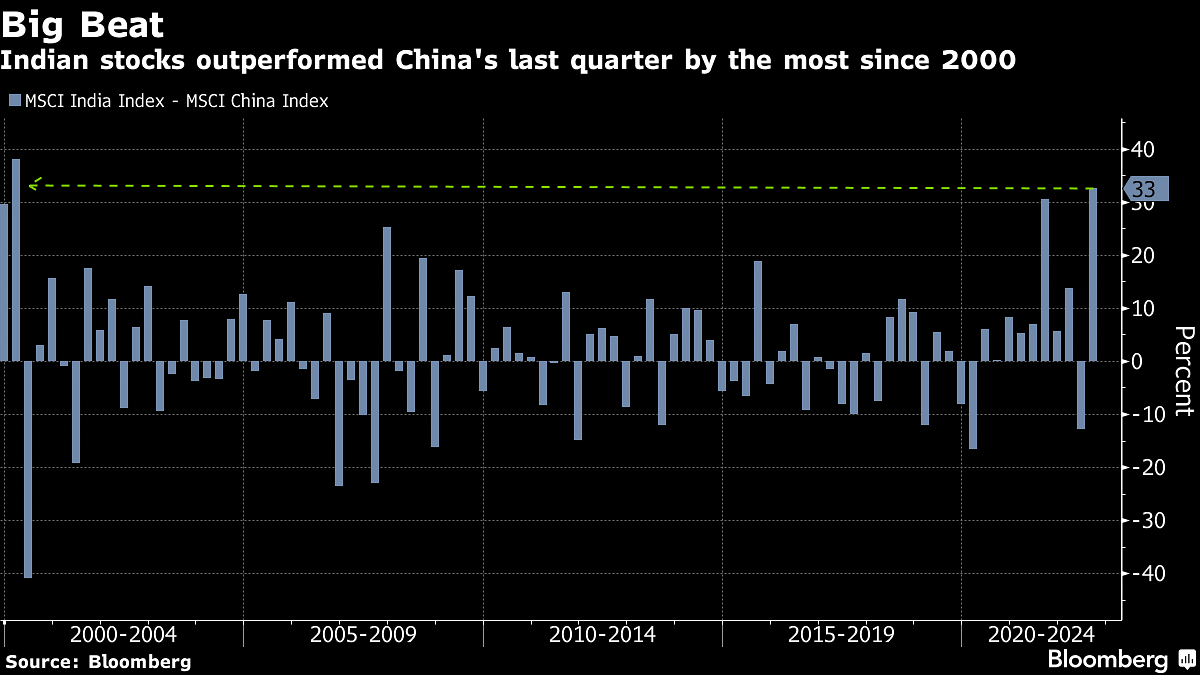
Bloomberg
FLIN is an underrated option to play India
There’s little doubt that India is fast emerging as a reliant magnet of fund flows. If you want to play the India story via ETFs you have around 10 options to pick from, but I’d like to talk up the prospects of a little known ETF that has not received any coverage on Seeking Alpha so far.
I’m referring to the FTSE Franklin India ETF (NYSEARCA:NYSEARCA:FLIN) which only made its debut in February 2018; given its relatively limited trading history it hasn’t quite been able to garner sizeable AUM; currently, you’re only looking at a little over $50m, whereas the three most popular Indian themed ETF alternatives, a) The iShares MSCI India ETF (INDA), b) WisdomTree India Earnings ETF (EPI), and c) The iShares S&P India Nifty Fifty Index ETF (INDY) have AUM figures ranging from $500m to over $4000m!
Despite the popularity of these alternatives, as a long-term structure there’s quite a bit to like about FLIN. Its most attractive facet is its cost efficiency. Whilst the likes of INDA, EPI and INDY have expense ratios in the range of 0.65% to 0.89%, FLIN comes across as inordinately cheap, with an expense ratio of just 0.19% making it the cheapest option around.
There’s also something to be said about the consistency of this portfolio as it resorts to very little churn, as reiterated by an annual turnover of just 11%. Conversely with the likes of INDIA and EPI at least one in four names gets churned every year. Then whilst FLIN’s spreads ($0.03) are not as tight as INDA or EPI ($0.01), it is still a lot better than INDY ($0.08) which has been around for close to 13 years now.
FLIN also has an optimal amount of names that it covers (a little over 200 stocks) and this does not make it too concentrated like an INDY which only covers 62 stocks, and is rather top heavy with a top-10 share of 58% (FLIN’s top-10 share is fairly respectable at only 38%). Yet you also don’t want to have too many names like an EPI (475). FLIN also comes across as the most balanced offering, sector wise as no single sector accounts for a weight of over 19%. Its well-diversified nature is in stark contrast to an INDY where 37% of the portfolio is linked to the prospects of the Indian financial sector alone.
Also consider that since its inception in February 2018, FLIN has outperformed all these other larger peers discussed in this article, delivering returns of 25.5%.
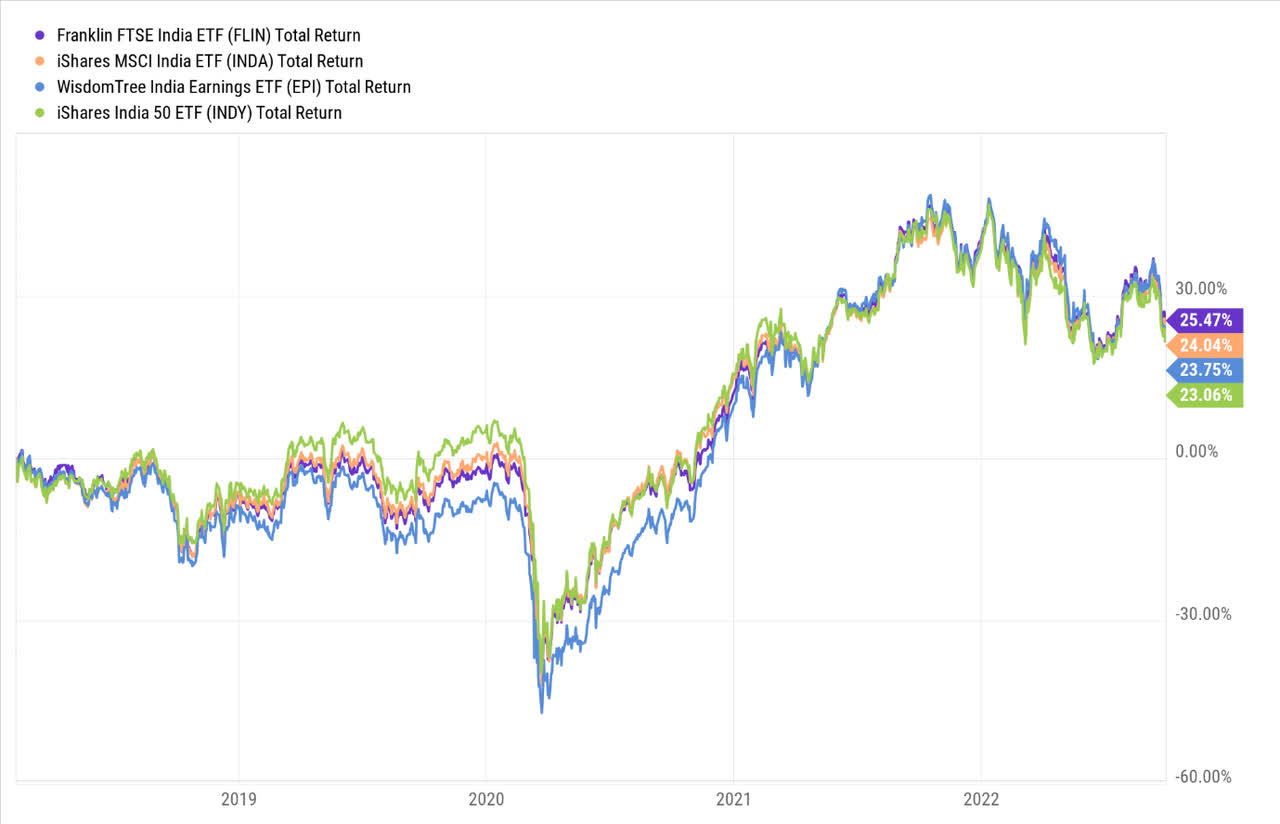
YCharts
It isn’t just the returns of this ETF; one also ought to consider the degree of risk it employs to generate those returns. Based on the risk stats from the image below we can see that FLIN comes across as a relatively low-risk bet. It has an annualized standard deviation of 23.41 which makes it one of the least volatile options around (INDA has the lowest volatility profile, but just having low volatility only covers one side of the equation; you still need to generate a good dose of excess returns (over the risk-free rate). Note that here FLIN beats INDA coming out with a better Sharpe ratio and only lagging EPI in that regard. All in all, it’s fair to say that FLIN has a good track record of mitigating risk and delivering returns.
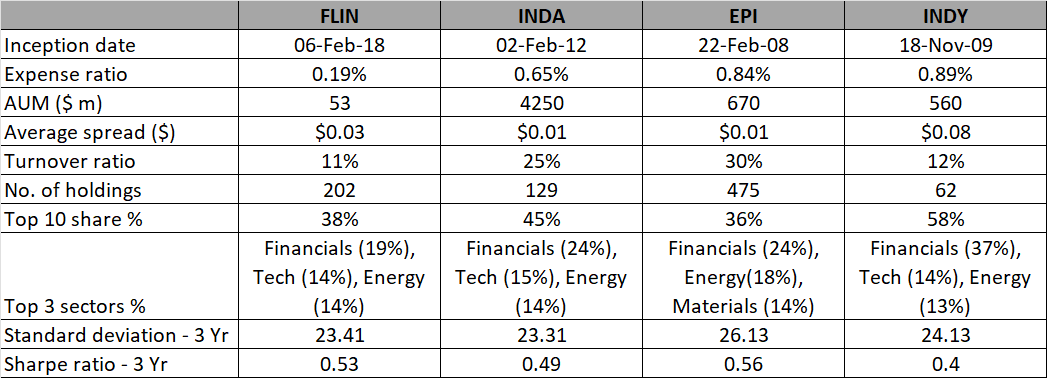
Seeking Alpha, Morningstar, ETF.com
Closing Thoughts
Whilst FLIN has some rather compelling qualities relative to other alternatives in this space, one does wonder if it is the most opportune time to start a long position in this counter. Here are some additional thoughts for your consideration.
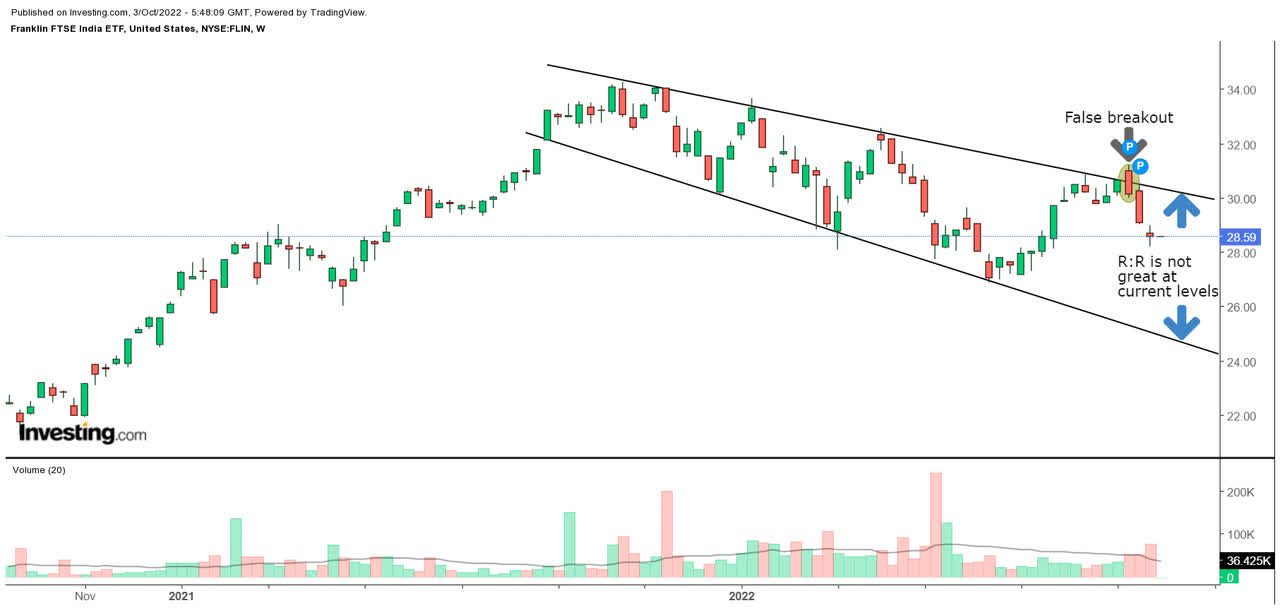
Investing
On the weekly chart, we can see that since peaking in October last year, the Franklin FTSE India ETF has been trending lower in the shape of a quasi-descending channel and quasi broadening wedge. There was an attempt to breakout of the upper boundary in mid-September, but this failed, and the ETF is currently amid another bout of correction. Since it is still trading well above the lower boundary, I don’t believe the risk-reward looks too attractive for a long position.
YCharts
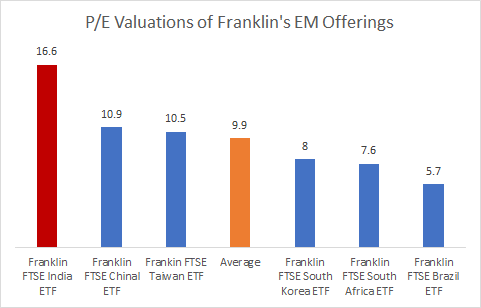
In addition to the less than ideal technical imprints, FLIN’s forward valuations are also quite off-putting; if we consider other emerging market alternatives belonging to the Franklin portfolio, one can see that all of them trade within a forward P/E range of 5.7-11x; The Indian offering, on the other hand, trades at 16.6x, a hefty premium of 67% over the average of the peer set!
Be the first to comment