


SHansche/iStock via Getty Images
At first glance, the landscape for UK equities doesn’t look great. The British economy is struggling, while corporate executives are increasingly looking to list their firms across the pond given what they perceive to be chronic discounts applied to UK listings. Abcam (ABCM), Arm Holdings (ARM) and Ferguson (FERG) are just three names that have either partially or wholly opted for listings outside of the UK in recent times.
Although it may not seem like it, the above could present a fine opportunity for value investors for a couple of simple reasons. Firstly, our vehicle of choice has somewhat limited exposure to the UK economy in any case, and secondly, discounted valuations, though perhaps irritating for CEOs, are clearly not a bad thing for anybody looking to buy. Indeed, I’d go as far as saying that UK shares look like a fair deal right now for long-term investors.
Franklin FTSE United Kingdom ETF
Enter the Franklin FTSE United Kingdom ETF (NYSEARCA:FLGB), hereafter referred to by its ticker symbol. FLGB’s fund description states that it aims to track the FTSE UK Capped Index. It currently charges a fairly respectable 9 basis points a year for this service.
Now, although it may not say so explicitly, this index looks a lot like the UK’s most commonly quoted blue chip index: the FTSE 100. Below are the top twelve holdings of FLGB compared to the iShares Core FTSE 100 UCITS ETF (ISF.L), which is a large London-listed FTSE 100 ETF. You can see that they are almost identical.
| Company Name | ISF.L (%) | FLGB (%) |
| Shell plc | 8.73 | 8.71 |
| AstraZeneca plc | 7.90 | 8.14 |
|
HSBC Holdings plc |
6.19 | 6.26 |
| Unilever plc | 5.04 | 5.18 |
| BP plc | 4.47 | 4.46 |
| Diageo plc | 3.46 | 3.52 |
| GSK plc | 2.96 | 3.06 |
| British American Tobacco p.l.c. | 2.98 | 3.03 |
| Rio Tinto plc | 2.81 | 2.90 |
| Glencore plc | 2.78 | 2.83 |
| RELX PLC | 2.60 | 2.67 |
| Reckitt Benckiser Group plc | 2.03 | 2.08 |
| Total | 51.95 | 52.84 |
Data Source: Franklin Templeton and iShares
The reason I mention this is that the international skew of the FTSE 100 has been well documented already. FTSE Russell had it at over 80% in terms of revenue share generated outside of the UK.
I’m sure this has been noted in prior analysis of this ETF, but it’s worth stressing this point for a couple of reasons. First and most obviously it means that the domestic performance of the UK economy isn’t quite so important as the ETF’s name might suggest. I’d also note that not all the ‘pure-play’ UK stocks in the portfolio aren’t all cyclical. Grocery stocks like Tesco (OTCPK:TSCDY)(OTCPK:TSCDF) and Sainsbury (OTCQX:JSAIY)(OTCQX:JSNSF), and telecoms/utilities like United Utilities (OTCPK:UUGRY)(OTCPK:UUGWF) and BT Group (OTCPK:BTGOF), for instance, are defensive.
Secondly, it means that sales and earnings are largely generated in currencies other than GBP. Most readers and potential FLGB investors are US-based, so FX effects are important to consider.
A Relative Bargain
As mentioned in the introduction, there is a degree of negativity surrounding UK equities. A lot of executives either have, or a thinking of, shifting their listings to the US because they think this will attract a higher valuation multiple. Global oil giant Shell (SHEL), the largest holding in FLGB and the FTSE 100, was even rumored to be considering a switch for that reason.
At the risk of stating the obvious, it shouldn’t really matter where a stock is listed. Its market valuation ought to reflect its intrinsic valuation. Given that, the trend of executives thinking about listing across the pond could mean that they think their market valuations in London are not a fair reflection of intrinsic value. It could also mean that the US market is simply overvalued, in which case a higher multiple would be undeserved but beneficial, at least for short-term investors.
This begs the question, are UK equities actually cheap or not? FLGB’s portfolio trades on a weighted P/E ratio of 11 according to Morningstar. Its P/B is 1.55 according to the same source.
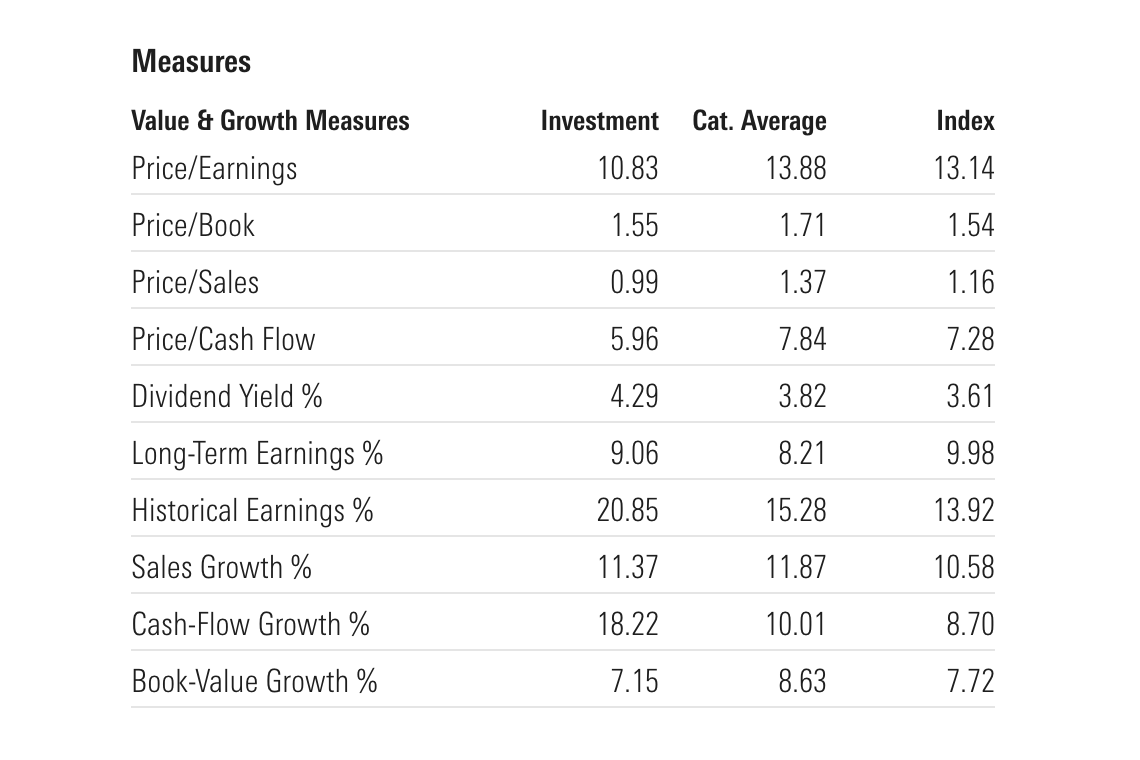
Source: Morningstar
That represents a noticeable discount to the US and, to a lesser extent, Europe. Vanguard’s S&P 500 index (VOO), for instance, trades on a P/E of 22 and 4x book value, while its FTSE Europe ETF (VGK) trades on a P/E of 12x and a P/B of 1.8x.
Such a discount applied to FLGB could be justified on three counts. The first two are that, one, stocks over in Europe and the US are higher quality, which all else equal would attract a higher multiple, and two, those stocks could also possess higher growth prospects.
On quality, we can work out the implied return on equity by multiplying P/B by the inverse of P/E. That gives us E/B, or earnings dividend by book value, which is of course ROE. Sure enough doing this for FLGB (~14%), VOO (~18%) and VGK (~15%) would imply that UK stocks aren’t quite as high quality, certainly compared to the US.
On growth, well, it doesn’t matter so much. On a P/E of 11 FLGB’s holdings could generate a circa 9% annualized return simply shipping off all their earnings to shareholders. At the higher end, multiplying the ROE by the ratio of retained earnings (~50% in FLGB’s case) would lead to around 11% annual returns including dividends. (Note that the UK does not impose withholding taxes on dividends).
The third and final point to consider is that earnings may be hitting a cycle peak. Energy and financials account for around 30% of FLGB as per Seeking Alpha, with those benefitting from a combination of higher commodity prices, higher interest rates and benign credit quality. Said differently, the “E” in P/E may be more inflated at FGLB than in, say, VOO, which would make its P/E deceptively low.
FLGB Holdings Breakdown
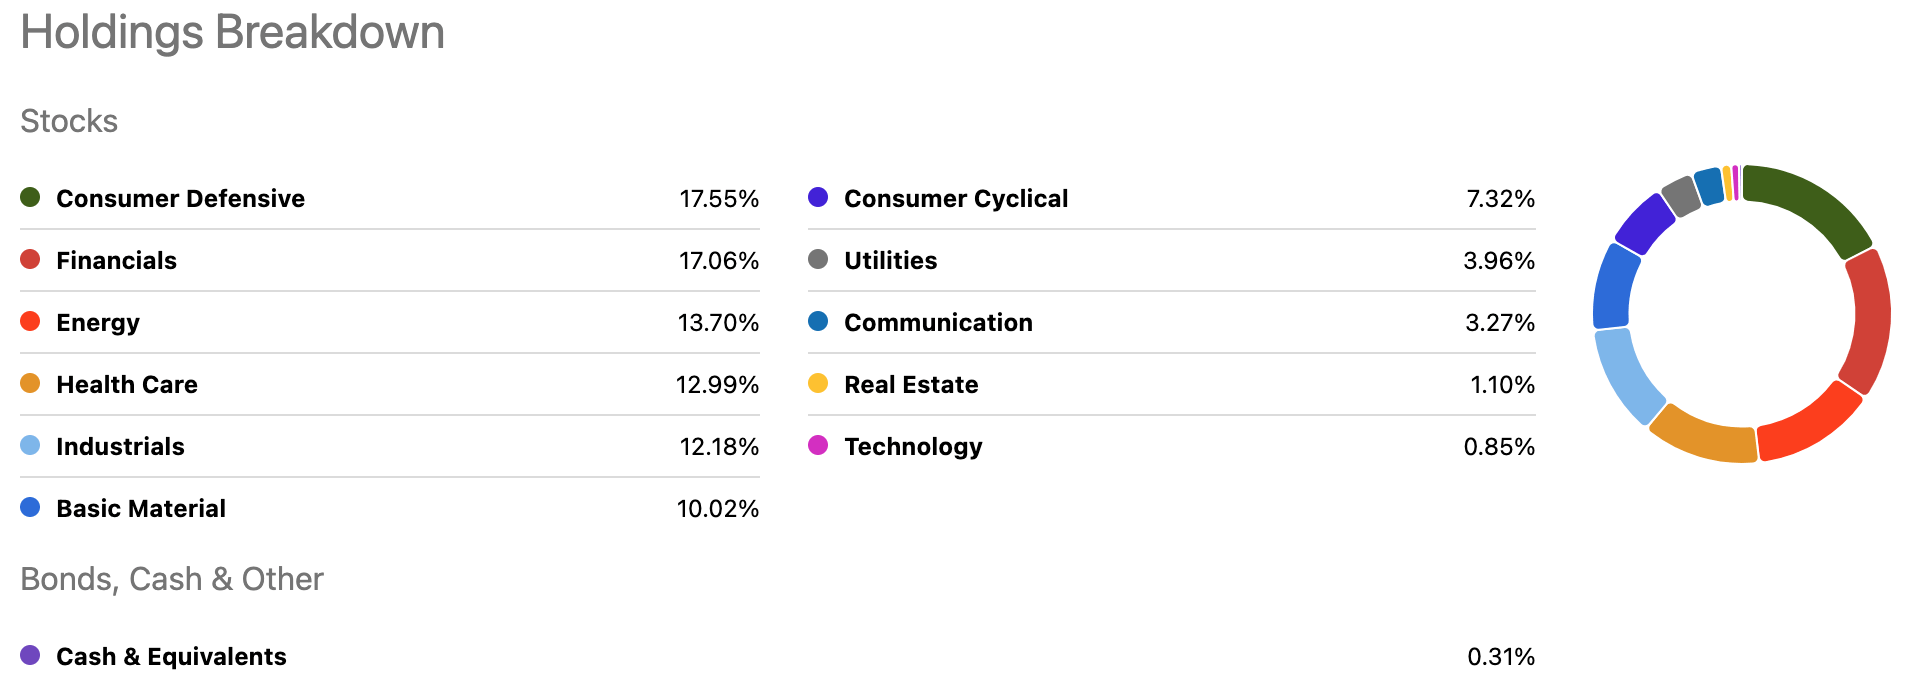
Source: Seeking Alpha
This is a fair point, which is why I’ve included the below graph of each region’s historical cyclically adjusted P/E ratio. The data is sourced from Barclays (BCS).
Historical CAPE Ratio By Region
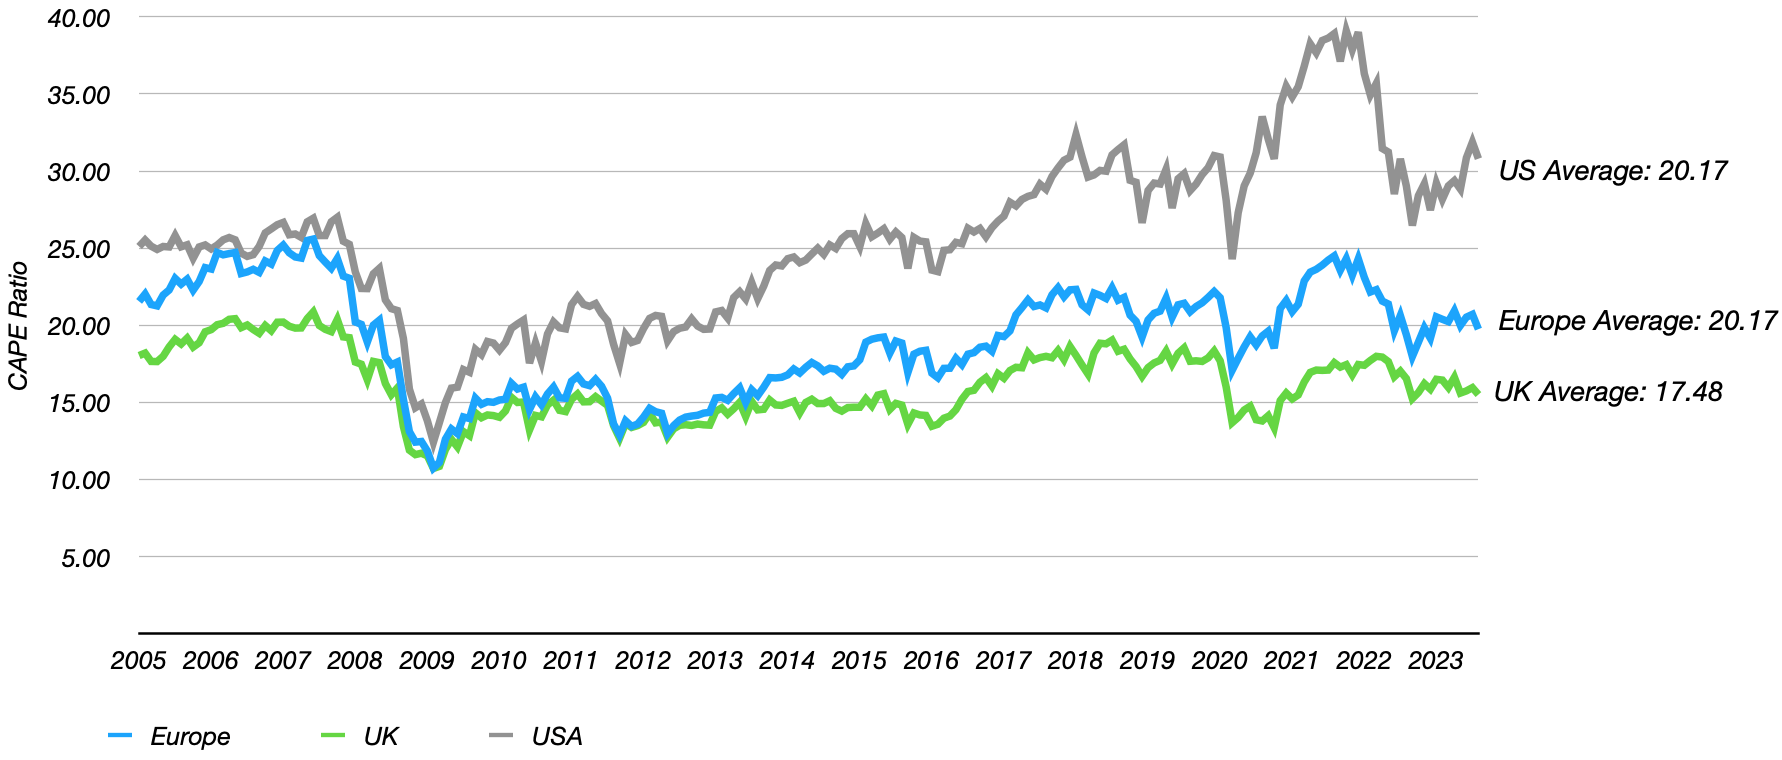
Data Source: Barclays Research
While the UK’s CAPE ratio is naturally higher than the current P/E, it is nonetheless at a discount to its historical average, unlike Europe (which is about in line with its average) and the US (a clear premium). As a result, I’m inclined to think that the UK equity space, and by extension FLGB, is indeed on the cheap side and a fair deal for long-term investors. Buy.
Be the first to comment