


Sewcream/iStock via Getty Images
Investment Thesis
The First Trust Water ETF (NYSEARCA:FIW) is one of two choices ETF investors looking to target U.S. water distribution and solutions-focused companies have. I like the diversification it offers but am troubled by its high valuation, moderate growth, and poor sentiment on Wall Street. This article will discuss its strategy, compare its fundamentals with the Invesco Water Resources Portfolio ETF (PHO), and preview the risky earnings season ahead.
ETF Overview
Strategy, Top Holdings, and Sector Exposures
FIW tracks the ISE Clean Edge Water Index, a modified-market-capitalization Index selecting companies that derive a substantial portion of their revenues from the potable and wastewater industry. Examples cited include water distribution, water solutions, and other ancillary services. Like most First Trust ETFs, FIW has a relatively high 0.53% expense ratio and has $1.14 billion in assets under management. It’s a unique thematic ETF, and PHO is its only obvious U.S. competitor. Perhaps this justifies the high fees, but both are specialty products not designed to replace broad-based equity ETFs.
The Index follows a tiered weighting scheme, assigning weights based on market capitalization according to the following rules:
- Securities 1-10: 4%
- Securities 11-15: 3.5%
- Securities 16-20: 3%
- Securities 21-30: 2%
- Securities 31-36: 1.25%
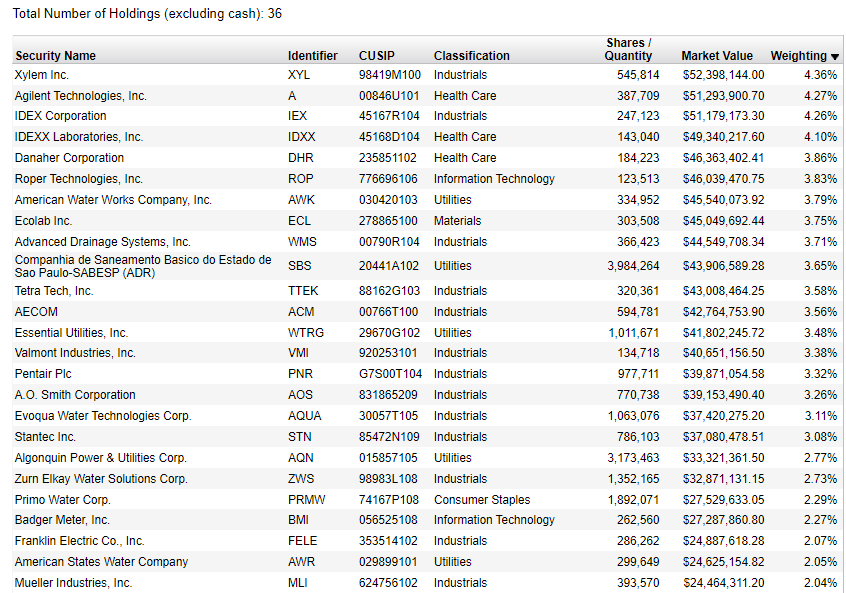
The Index rebalances semi-annually in March and September. Although there were no constituent changes compared to when I last reviewed FIW in July, there were a few material changes in weightings. For example, IDEXX Laboratories (IDXX) increased by about 1%, while Essential Utilities (WTRG) fell by the same amount.
FIW’s top 25 holdings are below, representing 82.79% of the ETF. You can see representatives from six GICS sectors, but the most prominent are Industrials stocks like Xylem (XYL) and IDEX (IEX). These are two of 31 stocks with at least a ten-year history, and FIW itself has been around since May 2007.
First Trust
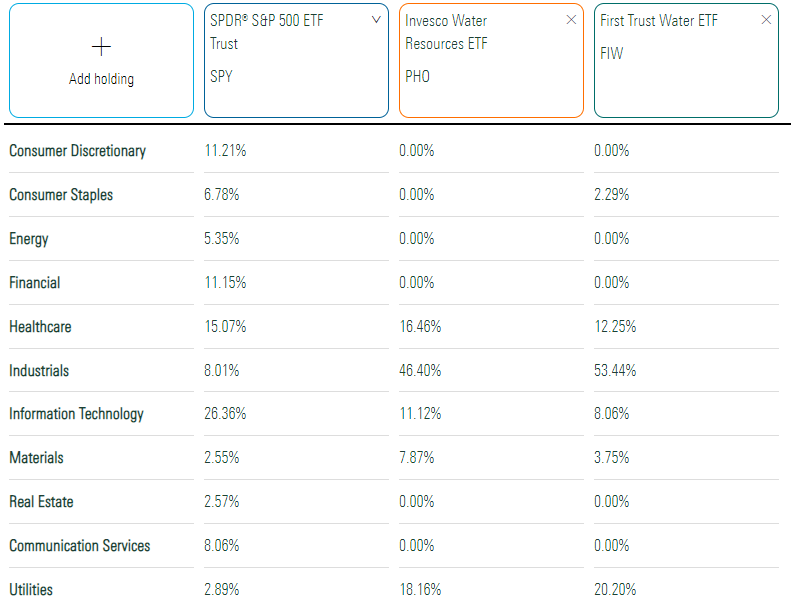
FIW is 53% Industrials, followed by 20% Utilities and 12% Health Care. Therefore, it could be better diversified, but PHO isn’t much better. It has a bit more Health Care, Technology, and Materials that offset 7% less exposure to the Industrials sector.
Morningstar
Performance History
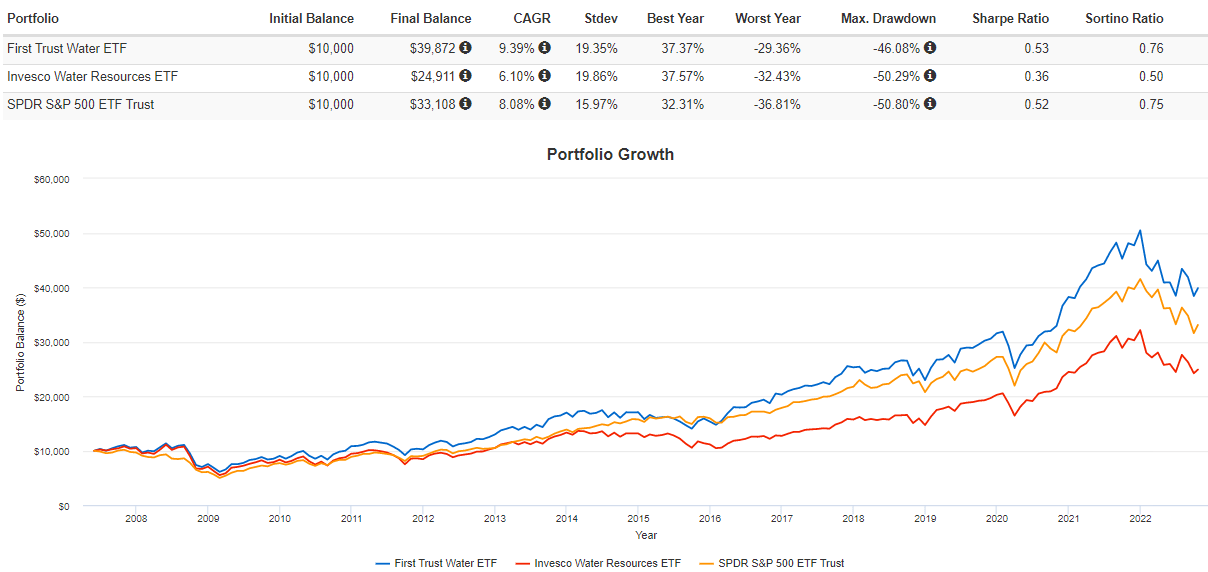
Since its inception, FIW has outperformed PHO by an annualized 3.29% with slightly less volatility, leading to substantially better risk-adjusted returns (Sharpe and Sortino Ratios). It even topped the SPDR S&P 500 ETF (SPY), so there could be a play here, especially if bullish sentiment returns.
Portfolio Visualizer
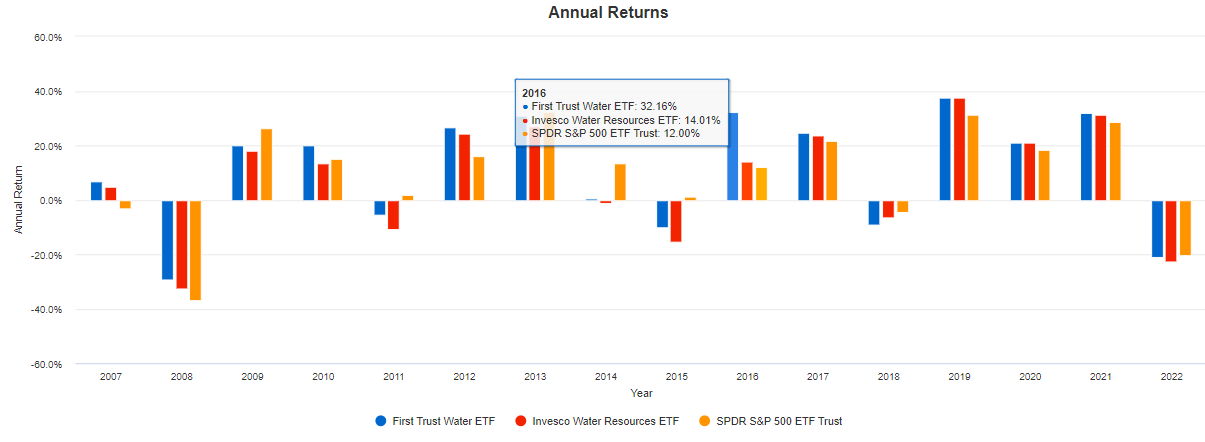
However, the annual returns chart below highlights how FIW’s superior performance can be traced to 2016, when it gained 32.16% compared to 14.01% and 12.00% for PHO and SPY. That year, a few stocks, like IDXX and TTEK, gained over 60%. They are down 49% and 21% YTD but gained 254% and 235% between 2019-2021.
Portfolio Visualizer
ETF Analysis
Company Snapshot
The following table highlights selected fundamental metrics for FIW’s top 25 holdings, which total 82.71% of the ETF. Although FIW is less diversified than PHO at the sector level, it’s superior at the company level, given how PHO’s top 25 holdings total 94.92%.
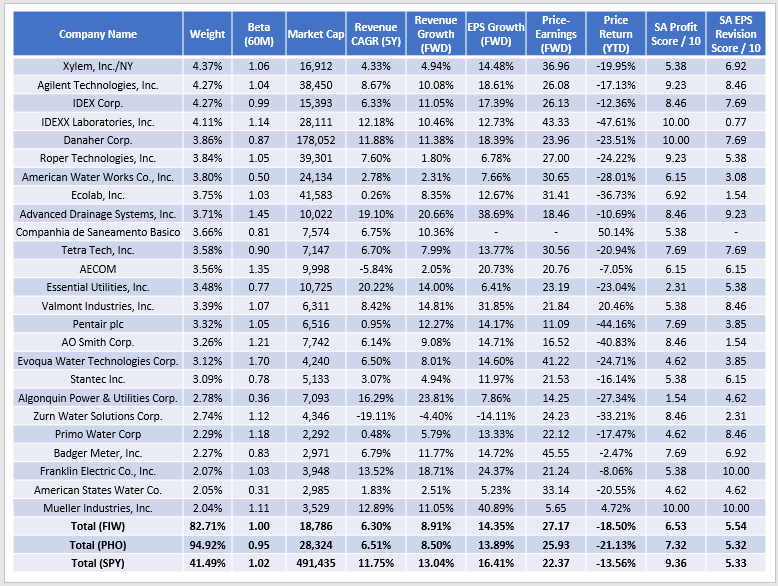
The Sunday Investor
One metric that stands out is FIW’s low weighted-average market capitalization of $18.8 billion. Most holdings are in the small- and mid-cap segments, but stocks like Danaher (DHR) skew the portfolio to the larger end. These segments are usually more volatile than large caps, so FIW and PHO’s five-year betas are relatively low. Still, there’s not much of an advantage over SPY, and there’s quite a substantial profitability difference, too. FIW’s Seeking Alpha Profitability Score, adjusted on a scale from 1-10, is just 6.53 compared to 9.36 for SPY. For context, the small- and mid-cap blend segments represented by IJR and IJH have profitability scores of 6.21 and 6.64. Therefore, FIW’s scores aren’t necessarily unusual but something to keep in mind as you weigh the benefits of diversification.
Little has changed in recent months regarding growth and valuation. FIW holds slow-and-steady growers, with a weighted average 6.30% and 8.91% historical and estimated sales growth rate. FIW also has an estimated 14.35% earnings growth rate, just below the 14.63% figure I previously reported. The ETF currently trades at 27.17x forward earnings, increasing its premium over PHO to 1.24 points compared to a 0.41-point discount in July. Therefore, from a valuation perspective, FIW is now less attractive.
Earnings Season Preview
My previous article noted how early Q2 results for FIW’s constituents were encouraging, and I want to recap how the earnings season ultimately went. The following table highlights last quarter’s results and next quarter’s estimates for a 25-company sample.
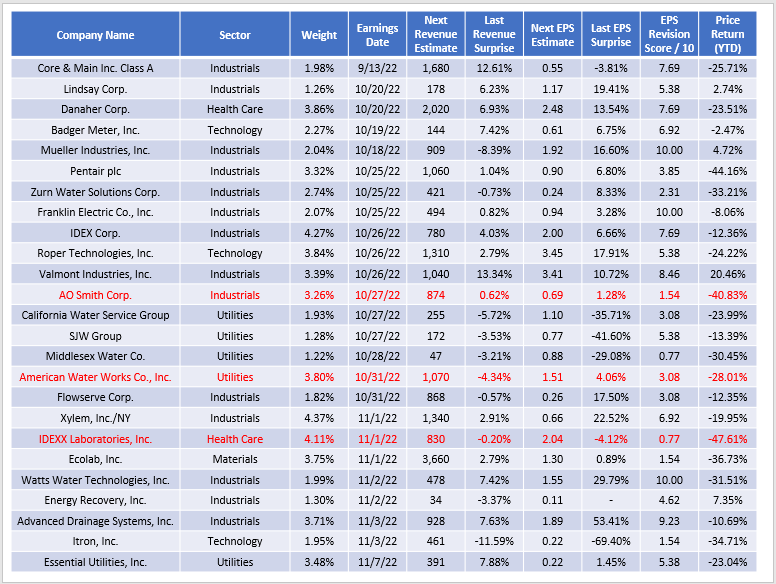
The Sunday Investor
Focusing on the last quarter’s EPS surprise column, there was a mix of solid beats and bad misses. Advanced Drainage Systems (WMS), for example, beat on sales and earnings by 7.63% and 53.41% and raised guidance for the remainder of the fiscal year. In contrast, several smaller names, including California Water Service Group (CWT), SJW Group (SJW), and Itron (ITRI), missed earnings between 35-70%. Yardeni Research reported that the earnings surprise for small- and mid-cap Industrials stocks was 15.90%. In contrast, FIW’s Industrial stocks had median and average earnings surprises of around 7%, so the last earnings season was disappointing.
Looking forward, you can see that several holdings have a low Seeking Alpha Revision Score, indicating negative analyst sentiment. These scores are not unique to FIW, as most ETFs average in the 5-6 range. However, it does underscore the earnings risks these companies face. I’ve highlighted representatives from three sectors that are high-risk.
A. O. Smith (AOS) reported preliminary Q3 results two weeks ago, surprising analysts and sending shares down 7% in the immediate aftermath. It’s recovered, along with the rest of the market, but the implied negative quarterly sales and earnings growth rates don’t look good for the stock. Already, AOS is down 41% YTD, and for those thinking it can’t get much worse, the company has an extensive history of these types of drawdowns.
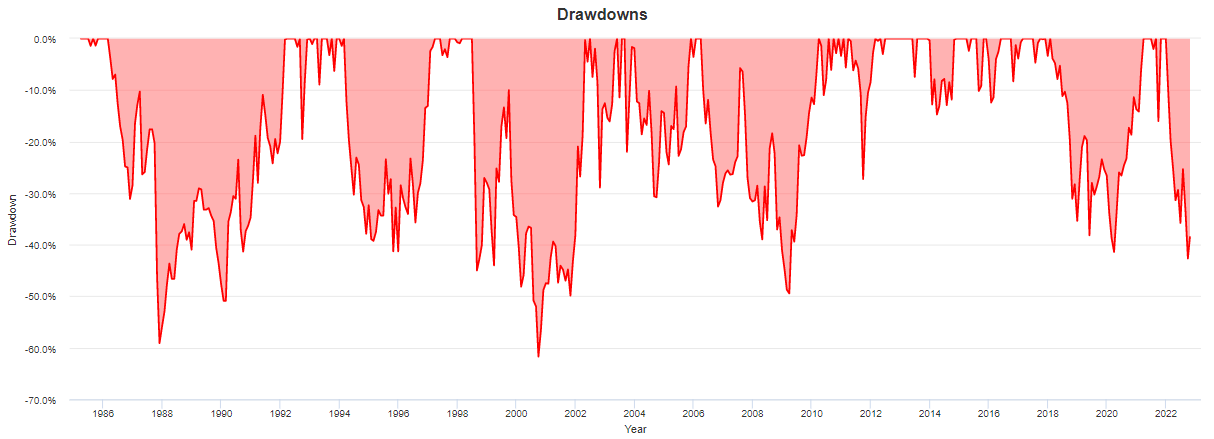
Portfolio Visualizer
American Water Works (AWK), a U.S. wastewater service provider, currently trades at $139.55 per share, sharply down from its starting price of $188.86 to begin the year. With a $24 billion market capitalization, AWK is the sixth-largest company in the portfolio. Still, it’s valued at 30.65x forward earnings and will be a natural target for bears if the company misses its $1.07 billion sales estimate on Monday. Those recent quarterly earnings surprises were mixed, AWK has missed sales estimates in seven of the last eight quarters.
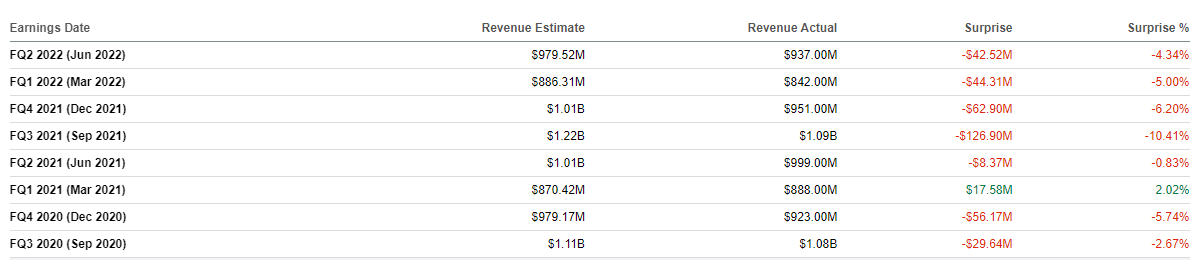
Seeking Alpha
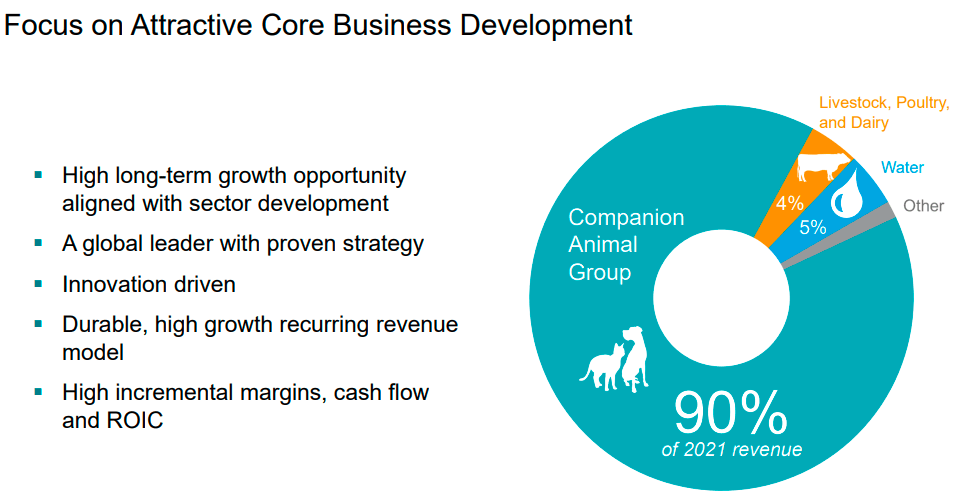
Finally, IDEXX Laboratories, through its Water Testing Solutions business, has a 4.11% weight in FIW and is set to report next Tuesday. IDEXX is one example of the seemingly loose criteria the Index has for selecting constituents, given how the water business only comprised 5% of last year’s sales.
IDEXX Laboratories
Instead, the focus is on veterinary solutions, and its 43.33x forward price-earnings ratio is outrageous for a company with flat year-over-year EBITDA. IDEXX missed sales and earnings estimates last quarter, and a second consecutive miss could send the stock price plummeting.
There are companies with much stronger prospects that offset these risks. Danaher is an example of a large-cap stock with a low five-year beta (0.87), strong estimated earnings growth (18.39%), and a relatively low price-earnings ratio (23.96x). The company consistently beats sales and earnings expectations, so there’s a reasonably good chance the stock will move higher next week. Investors may be better off skimming the ETF and saving on fees rather than buying the whole portfolio.
Investment Recommendation
FIW is an expensive portfolio of water distribution and solutions-focused companies in terms of its 0.53 expense ratio and 27.17x forward earnings valuation. Several stocks, including those with minimal focus on the water business, have performed poorly this year and could move sharply lower over the next few weeks as they report earnings. On the positive side, FIW has outperformed PHO and SPY since its inception, so there’s some potential here. However, it’s best suited in a risk-on environment, and right now, I think most investors will flock to safer, large-cap stocks due to another disappointing earnings season. Since that’s different from what FIW offers, I don’t recommend investors buy today, and I look forward to providing another update before the year closes.
Be the first to comment