

in-future
First Trust Capital Strength ETF (NASDAQ:FTCS) pursues cash-rich, debt-light large-cap U.S. companies capable of delivering returns on equity of at least 15%. This is a bellwethers-focused quality-centered ETF conscious of risk owing to the volatility screen. Selecting just the 50 fittest names from the 500-strong universe, the fund weights them equally.
I perfectly understand the rationale behind creating a portfolio like this.
Financial flexibility-centered equity strategies are now more relevant than ever. This is an especially alluring proposition amid looming capital scarcity, as the increasing cost of capital due to higher interest rates will inevitably stifle investment, which is a painful side-effect of taming inflation, and only players that managed to amass sizeable amounts of cash would have the luxury of delivering on expansion plans without turning to capital markets to fund their growth but already at higher rates. This is an environment where self-sufficiency is back in vogue. But is FTCS’ strategy capable of delivering meaningful alpha? Historical returns and factor analysis will tell.
Investing strategy
The Capital Strength Index is the cornerstone of FTCS’ strategy. Its selection universe encompasses the 500 largest liquid stocks from the NASDAQ US Benchmark Index. The candidate must hold no less than $1 billion in cash and short-term investments on the balance sheet, have its long-term debt accounting for less than 30% of the market cap, and boast an ROE above 15%. The volatility factor based on the 3-month and 12-month data is then considered to cross the riskiest players off the list.
The result of this strategy is that FTCS’ portfolio is markedly overweight in healthcare (around 30.8% as of July 28), with a similarly large share allocated to industrials (28.8%), followed by financials (around 14%). Weights on the fund’s website differ since it uses the ICB industries instead of the GICS sectors.
A fairly surprising top trio, at least for me, as I expected to find IT amongst the key allocations, a sector with traditionally stronger margins (for mature companies with lower R&D expenses as a % of revenues), as well as low capex supportive of stronger balance sheets. Still, FTCS has invested only in five IT players, including Amphenol (APH), Texas Instruments (TXN), Cisco Systems (CSCO), Paychex (PAYX), and Automatic Data Processing (ADP), together accounting for ~10.6%.
It is worth noting that industrials are deemed capital-intensive, typically with hefty net debts given material sustaining/growth capex requirements. However, the median cash & cash equivalents for FTCS’ holdings from the sector is $2.8 billion, with most having a current ratio of at least 1.2, which points to the resilience of their balance sheet, as well as Return on Total Capital of as high as 22% in the case of United Parcel Service (UPS), with the median of 11.7%, a decent result compared to the sector median of just 6.9%.
Meanwhile, the fund sees little value in the real estate, materials, and consumer discretionary sectors, with approximately 2% allocated to each while ignoring energy completely. Debt-heavy low-margin utilities also did not make the cut, together with communication.
However, a remark worth making is that in the past, the fund was less skeptical about the ICB oil & gas industry. For example, page 35 of the 2019 annual report shows it was long Phillips 66 (PSX), a refining & marketing company. It is an open question whether petroleum players would qualify for inclusion upon the next quarterly rebalancing given how lucrative this year has been for them as the crude oil price has been hovering around a $100 per barrel milestone, and most efficient firms were enjoying billions in FCF. For example, Chevron (CVX) has been reducing its total debt consistently since it peaked at $45.4 billion in March 2021, to just $26.2 billion as of 31 June 2022, while its cash & cash equivalents plus marketable securities more than doubled this year touching $12.3 billion vs. $5.67 billion in December 2021.
Performance: capital strength factor did not secure consistent alpha
For better context, I would like to compare FTCS with the Distillate Fundamental Stability & Value ETF (DSTL), a fund similarly unapologetic about finding quality in the equity market, while also mindful of the valuation factor, the one the First Trust ETF ignores. The iShares Core S&P 500 ETF (IVV) is selected to represent the market’s performance. I have also added low-fee, quality-centered Invesco S&P 500 Quality ETF (SPHQ) to bring a bit more color.
Let us examine their returns over a few timeframes. Since FTCS adopted the Capital Strength Index in June 2013, its returns before that date are essentially irrelevant, and incorporating them into the analysis would skew results. I would ignore them.
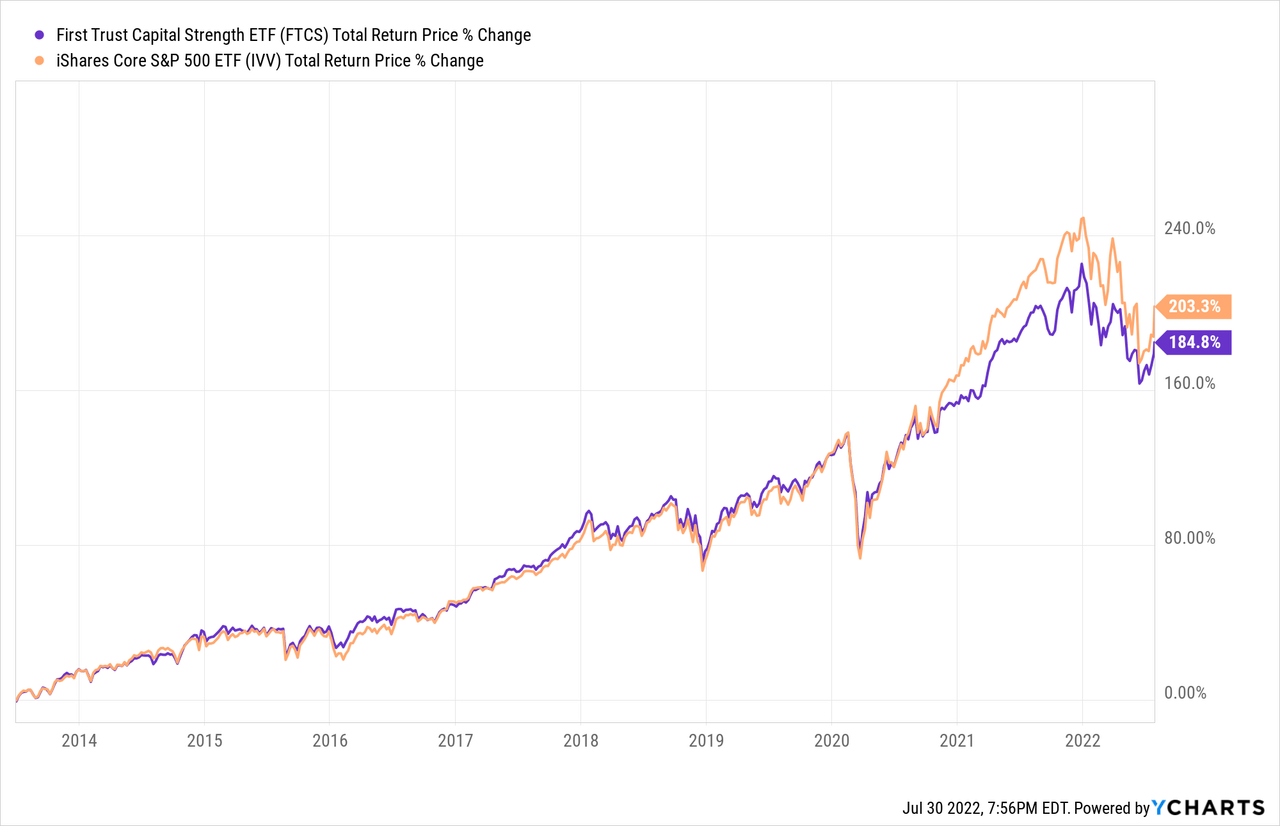
The first period in focus is July 2013 – July 2022.
Created by the author using data from Portfolio Visualizer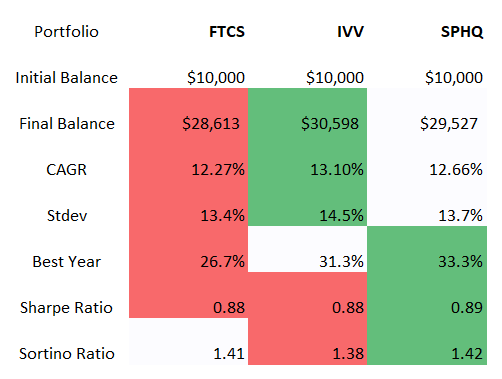
Obviously, FTCS underperformed both IVV and SPHQ, with risk-adjusted returns on par, and exhibited lower volatility.
Next, the November 2018 – July 2022 period (DSTL was incepted in October 2018).
Created by the author using data from Portfolio Visualizer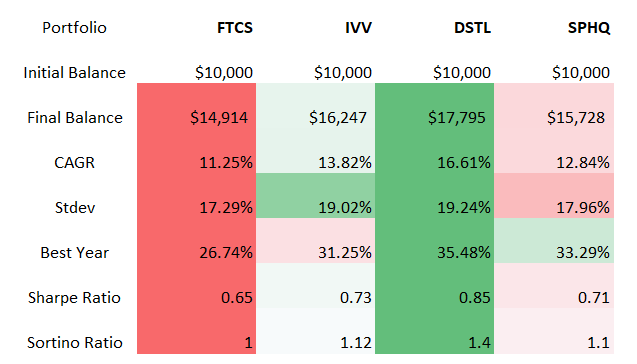
With a 16.6% CAGR and a 1.4 Sortino ratio, the Distillate ETF is unrivaled here.
Finally, let us look at the YTD results.
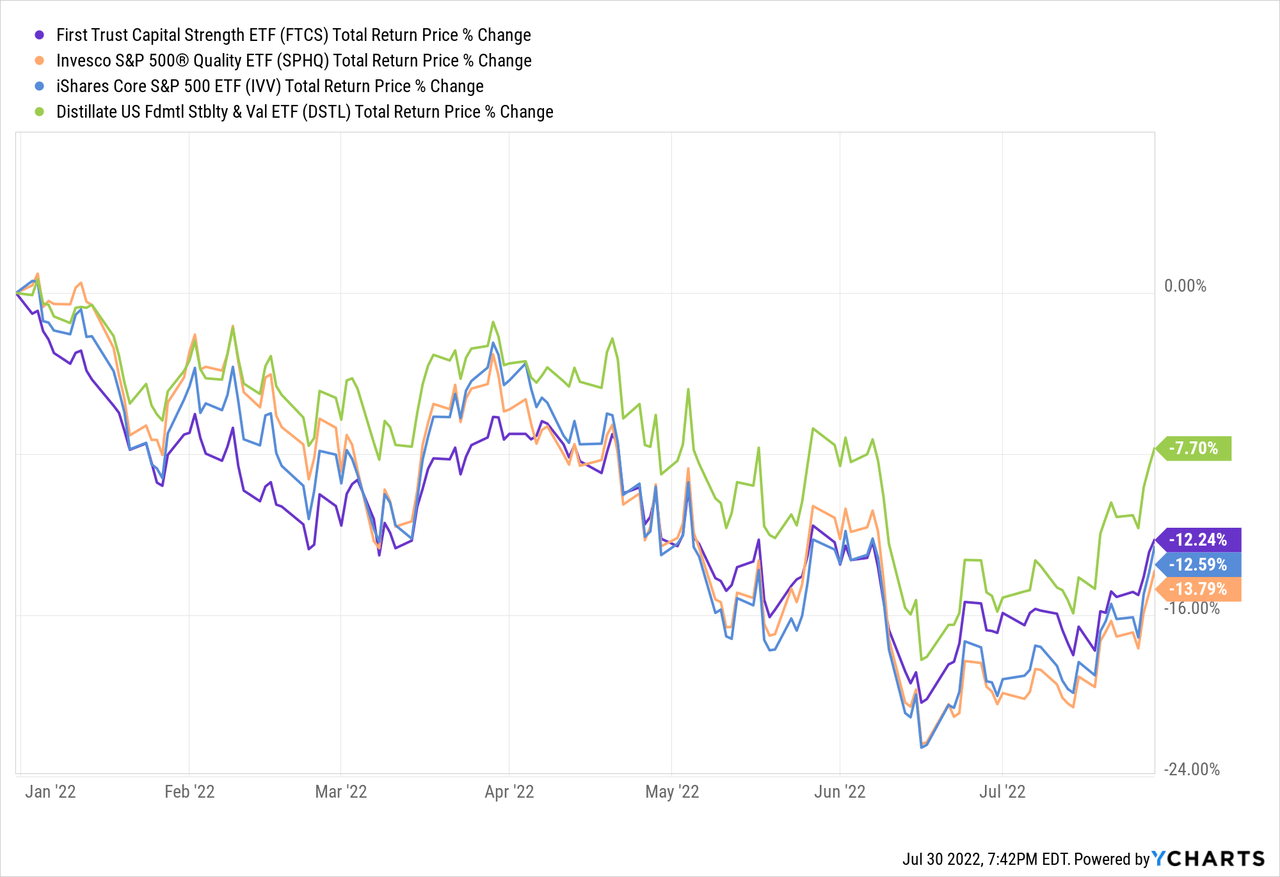
Once again, DSTL is ahead thanks to its value tilt, while the total returns of the rest are on par.
Blind spots of the strategy
The stock selection process of its underlying index does have blind spots, which jeopardizes its returns going forward should inflation data surprise to the upside and the market switch to the trimming of growth premia once again after the recent euphoria spurred by tech behemoths’ earnings.
The key blind spot is valuation. It becomes obvious from the table below which covers its 25 key investments.
Created by the author using data from FTCS, IVV, and Seeking Alpha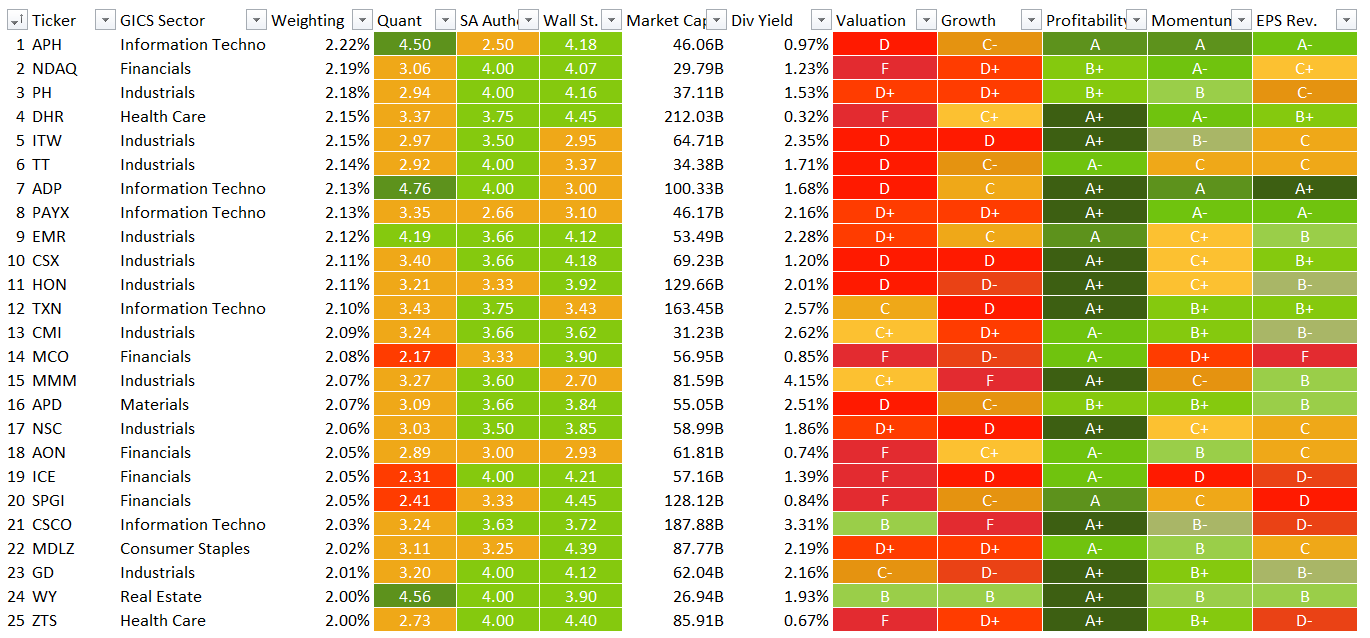
Overall, over 70% of the holdings have a Quant Valuation grade of D+ or worse, while just three stocks (5.9% weight) are comparatively undervalued (B- grade or better).
The silver lining is that companies with soft profitability characteristics are simply absent in its portfolio. All the holdings have at least B- Quant Profitability rating. A solid achievement, yet I do not think this alone is enough to assign the fund a Buy rating. I would like to see a more balanced value/quality mix.
Final thoughts
The data since the index change illustrate that FTCS does deliver positive returns over time, but its strategy does not perform as well as investors might expect. Once again, the way of reasoning that more complicated smart-beta strategies beget consistently better returns is misleading.
It is worth noting that FTCS performed almost precisely like IVV in the past, but still with marginal alpha, which is worth appreciating. A meaningful gap emerged only during the vaccine-induced capital rotation of late 2020, which looks somewhat odd given both basically ignore the value factor.
But times have changed. In an environment where capital scarcity is a real threat, lean balance sheets with hefty cash on hand have immediately gained importance. The more dry powder a company has, the easier it would be for it to outmaneuver and outperform rivals that would struggle to deploy capital efficiently as higher rates render their old models unprofitable and irrelevant.
Does that justify a bullish rating for this ETF? Hardly. I see little reason for holding a fund with a 55 bps expense ratio and a dividend yield even below IVV’s and returns almost identical (at times marginally weaker in risk-adjusted terms) to the bellwether index ETF. Slightly lower volatility is something to appreciate, though. Nevertheless, despite a solidly looking strategy, it has no edge over simplistic blue-chip ETFs, at least in my view, while DSTL and SPHQ obviously performed better over the timeframes analyzed.
Be the first to comment