

Eric Broder Van Dyke
Earnings of First Hawaiian, Inc. (NASDAQ:FHB) will grow next year partly on the back of a low deposit beta amid a rising rate environment. Further, moderate loan growth will support the bottom line. Overall, I’m expecting First Hawaiian to report earnings of $2.00 per share for 2022, down 3% year-over-year, and $2.20 per share for 2023, up 10% year-over-year. The December 2023 target price suggests a small upside from the current market price. Therefore, I’m maintaining a hold rating on First Hawaiian, Inc.
Deposit and Loan Mixes are Favorably Positioned for the Up-Rate Cycle
First Hawaiian’s net interest margin grew by 33 basis points in the third quarter and 18 basis points in the second quarter of 2022. The margin’s expansion is partly attributable to sticky deposit costs. First Hawaiian’s deposit beta was only 10% in the first nine months of 2022, which is much below the deposit beta of 18% reported for the last up-rate cycle, as mentioned in the third quarter’s conference call. I don’t expect a reversion to the historical trend because First Hawaiian’s deposit mix is a lot better now. Non-interest-bearing deposits made up 42.2% of total deposits at the end of September 2022, as opposed to an average of 35.4% in 2019.
Apart from the deposit mix, the loan mix is also somewhat favorably positioned for an up-rate cycle. Floating-rate loans make up 39% of total loans, as mentioned in the second quarter’s conference call (the company has not updated this information for the third quarter).
The management expects the margin to increase by 10 to 15 basis points in the fourth quarter, as mentioned in the third quarter’s conference call. Further, the results of the management’s interest-rate sensitivity analysis given in the 10-Q filing showed that a 100-basis points increase in interest rates could boost the net interest income by 3.2% over twelve months.
3Q 2022 10-Q Filing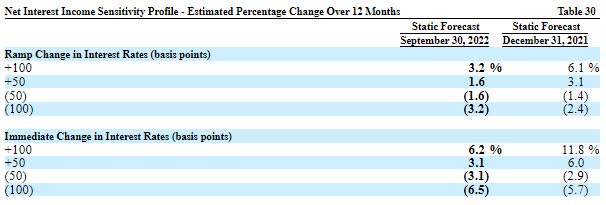
Considering these factors, I’m expecting the margin to increase by 10 basis points in the last quarter of 2022 and a further 10 basis points in 2023.
Loan Growth Likely to Moderate
First Hawaiian’s loan portfolio grew by a remarkable 3.3% during the third quarter, or 13% annualized, which is quite high in a historical context. Going forward, loan growth will likely decline towards a more normal level due to the high interest-rate environment. Credit appetite will take a hit from the high borrowing costs.
On the plus side, strong pipelines bode well for loan growth in the near term. The management mentioned in the third quarter’s conference call that its pipeline remains robust, driven primarily by commercial loans in Hawaii and Guam.
Furthermore, the state’s tourism industry is currently doing quite well, with the passenger count near the pre-pandemic level. The following chart shows the passenger count data from the Economic Research Organization at the University of Hawaii (see blue line).
The Economic Research Organization at the University of Hawaii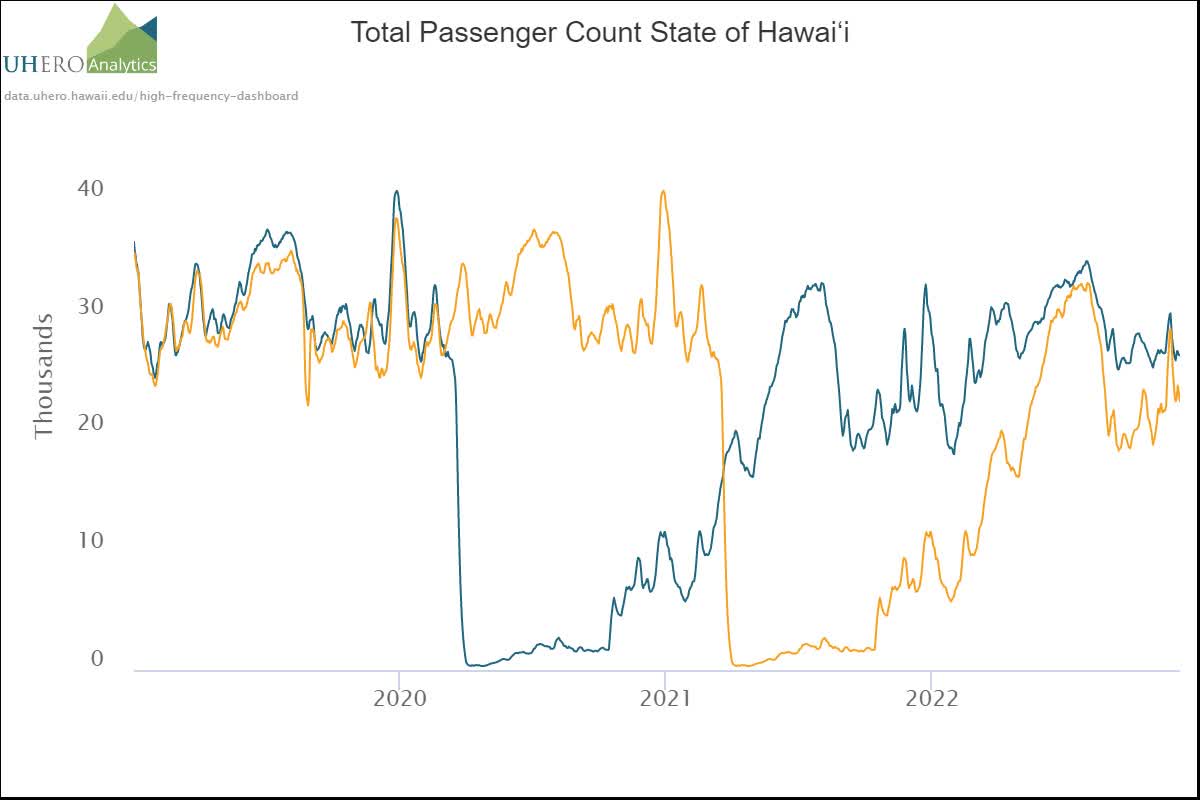
The management mentioned in the third quarter’s conference call that it is targeting mid-to-high-single-digit loan growth for 2022. Considering the factors mentioned above, I believe loan growth for the year will be near the lower end of the management’s guidance. Overall, I’m expecting the loan portfolio to increase by 1.25% in the last quarter of 2022, taking full-year loan growth to 7%. For 2023, I’m expecting the portfolio to grow by 5%. Meanwhile, I’m expecting other balance sheet items to grow somewhat in line with loans. The following table shows my balance sheet estimates.
| Financial Position | FY18 | FY19 | FY20 | FY21 | FY22E | FY23E |
| Net Loans | 12,934 | 13,081 | 13,071 | 12,805 | 13,722 | 14,421 |
| Growth of Net Loans | 6.5% | 1.1% | (0.1)% | (2.0)% | 7.2% | 5.1% |
| Other Earning Assets | 5,106 | 4,410 | 6,821 | 9,440 | 8,458 | 8,889 |
| Deposits | 17,150 | 16,445 | 19,228 | 21,816 | 22,368 | 23,507 |
| Borrowings and Sub-Debt | 600 | 600 | 200 | – | – | – |
| Common equity | 2,525 | 2,640 | 2,744 | 2,657 | 2,237 | 2,385 |
| Book Value Per Share ($) | 18.4 | 19.8 | 21.1 | 20.7 | 17.5 | 18.7 |
| Tangible BVPS ($) | 11.2 | 12.3 | 13.4 | 12.9 | 9.7 | 10.9 |
| Source: SEC Filings, Author’s Estimates(In USD million unless otherwise specified) | ||||||
Hawaii’s Improving Economy to Keep Provisioning Low
First Hawaiian’s provisioning for expected loan losses remained below normal during the first nine months of 2022. Going forward, the high interest-rate environment can potentially worsen the credit quality of loans and lead to higher provisioning. However, provisioning is unlikely to exceed a normal level because of Hawaii’s fast-improving economy. Bankruptcies in the state are near record lows, as shown below.
Economic Research Organization at the University of Hawaii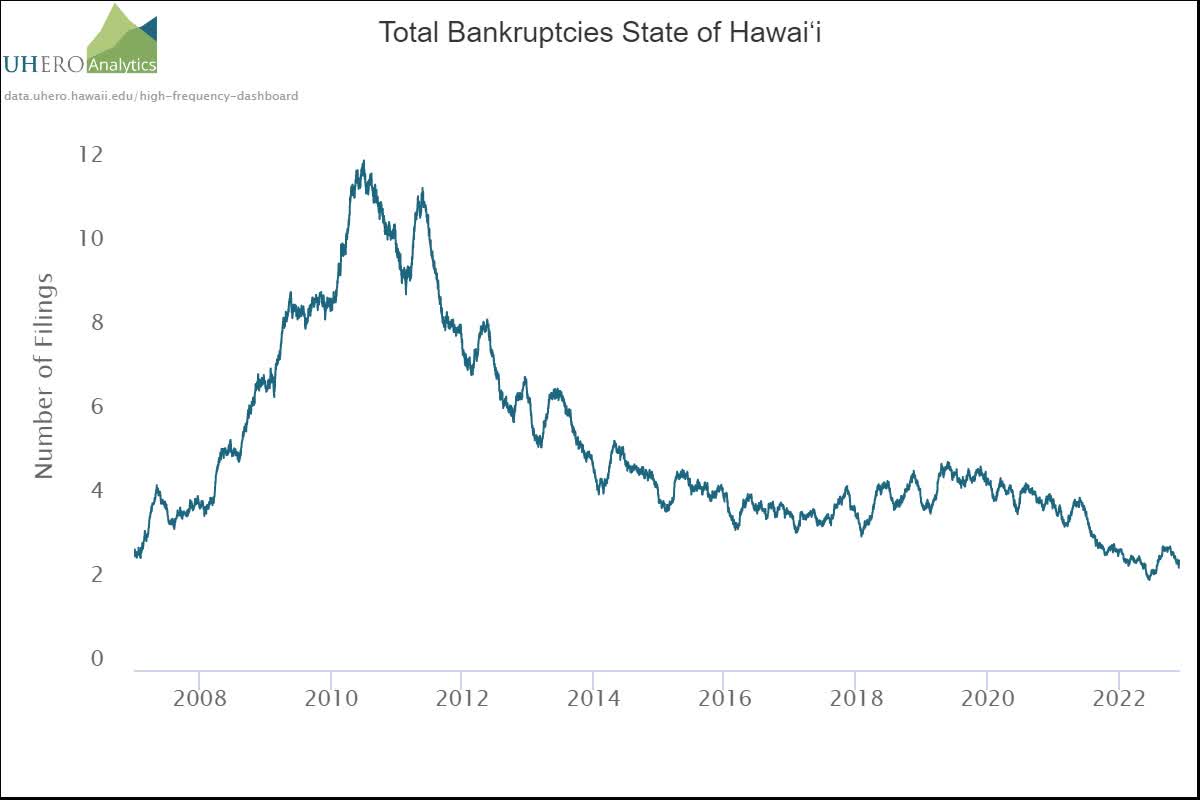
Further, the portfolio’s credit risk appears well provided for. Allowances made up 1.08% of total loans at the end of September 2022, while non-performing loans made up just 0.06% of total loans. Considering these factors, I’m expecting the net provision expense to make up around 0.14% of total loans in 2023, which is the same as the average from 2017 to 2019.
Expecting Earnings to Grow by 10% Next Year
The anticipated margin expansion will play a key role in earnings growth next year. Further, loan additions will support the bottom line. Overall, I’m expecting First Hawaiian to report earnings of $2.00 per share for 2022, down 3% year-over-year. For 2023, I’m expecting earnings to grow by 10% to $2.20 per share. The following table shows my income statement estimates.
| Income Statement | FY18 | FY19 | FY20 | FY21 | FY22E | FY23E |
| Net interest income | 566 | 573 | 536 | 531 | 609 | 710 |
| Provision for loan losses | 22 | 14 | 122 | (39) | 2 | 20 |
| Non-interest income | 179 | 193 | 197 | 185 | 177 | 187 |
| Non-interest expense | 365 | 370 | 368 | 405 | 443 | 503 |
| Net income – Common Sh. | 264 | 284 | 186 | 266 | 256 | 281 |
| EPS – Diluted ($) | 1.93 | 2.13 | 1.43 | 2.05 | 2.00 | 2.20 |
| Source: SEC Filings, Author’s Estimates(In USD million unless otherwise specified) | ||||||
In my last report on First Hawaiian which was issued before the second quarter’s results, I estimated earnings of $1.85 per share for 2022. I’ve increased my earnings estimate for this year because the net interest income growth so far this year has beaten my expectations.
My estimates are based on certain macroeconomic assumptions that may not come to pass. Therefore, actual earnings can differ materially from my estimates.
The Current Market Price is Close to Next Year’s Target Price
First Hawaiian is offering a dividend yield of 4.2% at the current quarterly dividend rate of $0.26 per share. The earnings and dividend estimates suggest a payout ratio of 47% for 2023, which is below the five-year average of 58%. The management mentioned in the third quarter’s conference call that it is looking to rebuild its tier I capital ratio up to 12%. Therefore, I believe a dividend hike is unlikely next year.
I’m using the historical price-to-tangible book (“P/TB”) and price-to-earnings (“P/E”) multiples to value First Hawaiian. The stock has traded at an average P/TB ratio of 2.06 in the past, as shown below.
| FY18 | FY19 | FY20 | FY21 | Average | ||
| T. Book Value per Share ($) | 11.2 | 12.3 | 13.4 | 12.9 | ||
| Average Market Price ($) | 27.8 | 26.6 | 19.6 | 27.7 | ||
| Historical P/TB | 2.50x | 2.16x | 1.46x | 2.14x | 2.06x | |
| Source: Company Financials, Yahoo Finance, Author’s Estimates | ||||||
Multiplying the average P/TB multiple with the forecast tangible book value per share of $10.9 gives a target price of $22.4 for the end of 2023. This price target implies a 9.8% downside from the December 9 closing price. The following table shows the sensitivity of the target price to the P/TB ratio.
| P/TB Multiple | 1.86x | 1.96x | 2.06x | 2.16x | 2.26x |
| TBVPS – Dec 2023 ($) | 10.9 | 10.9 | 10.9 | 10.9 | 10.9 |
| Target Price ($) | 20.3 | 21.3 | 22.4 | 23.5 | 24.6 |
| Market Price ($) | 24.9 | 24.9 | 24.9 | 24.9 | 24.9 |
| Upside/(Downside) | (18.6)% | (14.2)% | (9.8)% | (5.4)% | (1.1)% |
| Source: Author’s Estimates |
The stock has traded at an average P/E ratio of around 13.5x in the past, as shown below.
| FY18 | FY19 | FY20 | FY21 | Average | ||
| Earnings per Share ($) | 1.93 | 2.13 | 1.43 | 2.05 | ||
| Average Market Price ($) | 27.8 | 26.6 | 19.6 | 27.7 | ||
| Historical P/E | 14.4x | 12.5x | 13.7x | 13.5x | 13.5x | |
| Source: Company Financials, Yahoo Finance, Author’s Estimates | ||||||
Multiplying the average P/E multiple with the forecast earnings per share of $2.20 gives a target price of $29.7 for the end of 2023. This price target implies a 19.4% upside from the December 9 closing price. The following table shows the sensitivity of the target price to the P/E ratio.
| P/E Multiple | 11.5x | 12.5x | 13.5x | 14.5x | 15.5x |
| EPS 2023 ($) | 2.20 | 2.20 | 2.20 | 2.20 | 2.20 |
| Target Price ($) | 25.3 | 27.5 | 29.7 | 31.9 | 34.1 |
| Market Price ($) | 24.9 | 24.9 | 24.9 | 24.9 | 24.9 |
| Upside/(Downside) | 1.7% | 10.6% | 19.4% | 28.2% | 37.0% |
| Source: Author’s Estimates |
Equally weighting the target prices from the two valuation methods gives a combined target price of $26.1, which implies a 4.8% upside from the current market price. Adding the forward dividend yield gives a total expected return of 9.0%. As this return is not high enough for me, I’m maintaining a hold rating on First Hawaiian, Inc.
Be the first to comment