

cemagraphics
Our portfolio, consisting of 35-40 stocks, ETFs and royalty trusts, is built to both capture growing, safe yield and take advantage of opportune times to buy and sell based on price patterns over the last six months. Currently, the portfolio yields 6.11% versus a median yield over the past five years of 4.25%. In the past 12 months, our portfolio’s dividend payout has increased 24.4%, although much of that is due to higher energy prices which flow through directly to royalty trust unitholders. A better measure is the five-year average increase in dividend payout, which was 18.37%. Excluding the energy royalty trusts, the median average annual increase over the last five years was just over 13%. The stocks in our portfolio are selected based yield, yield safety as determined by free cash flow coverage, and yield growth. Each company’s financial statement trends are summarized in a thirteen-page report. The ETFs are selected based on yield and yield growth.
The highest-yielding security in our portfolio is the San Juan Basin Royalty Trust (SJT, yield: 14.65%), a trust that has a 75% net overriding royalty interest carved out of Southland’s oil and natural gas interests in properties located in the San Juan Basin (New Mexico). Because SJT’s royalties are dependent on gas prices, SJT’s stock (technically trust units) has declined 27% in price from $15.15 in August to $11.08 now. The Royalty Trust has no debt and cannot take on debt under its charter.
SJT Six Month Buy Sell Pattern (TradingView)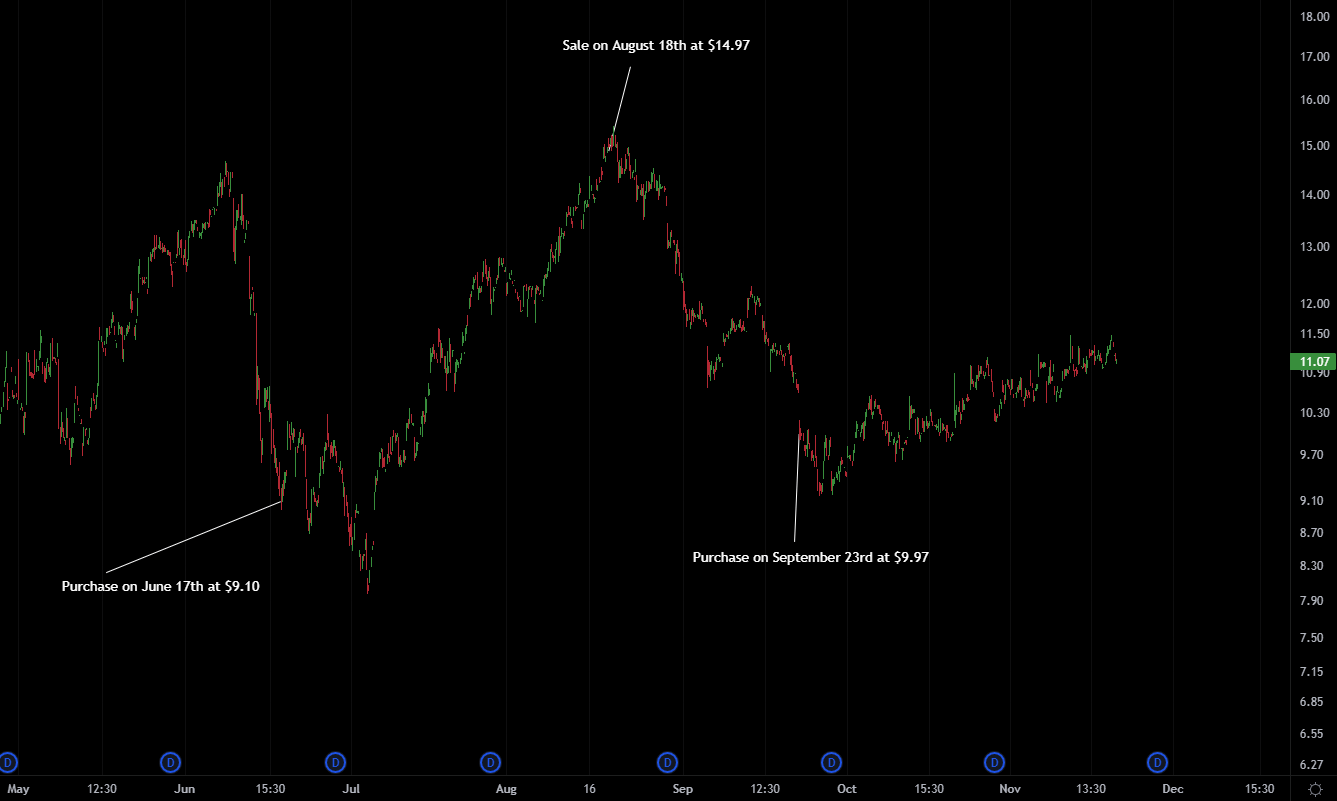
The lowest-yielding security in the portfolio is currently the ProShares S&P 500 Dividend Aristocrats ETF (NOBL) which yields 2.01%. It tracks the S&P 500 Dividend Aristocrats Index consisting of S&P 500 companies that have raised their dividends for at least 25 consecutive years. The ETF reached a high of $99.75 in January and has since declined 7.4%, though with numerous tradeable troughs and peaks that our algorithm identified. We include this ETF for that reason: the dividends are safe and growing, and our software tells us when the stock price is attractive based on dip patterns over the last six months.
NOBL – Six Month Buy Sell Pattern (TradingView)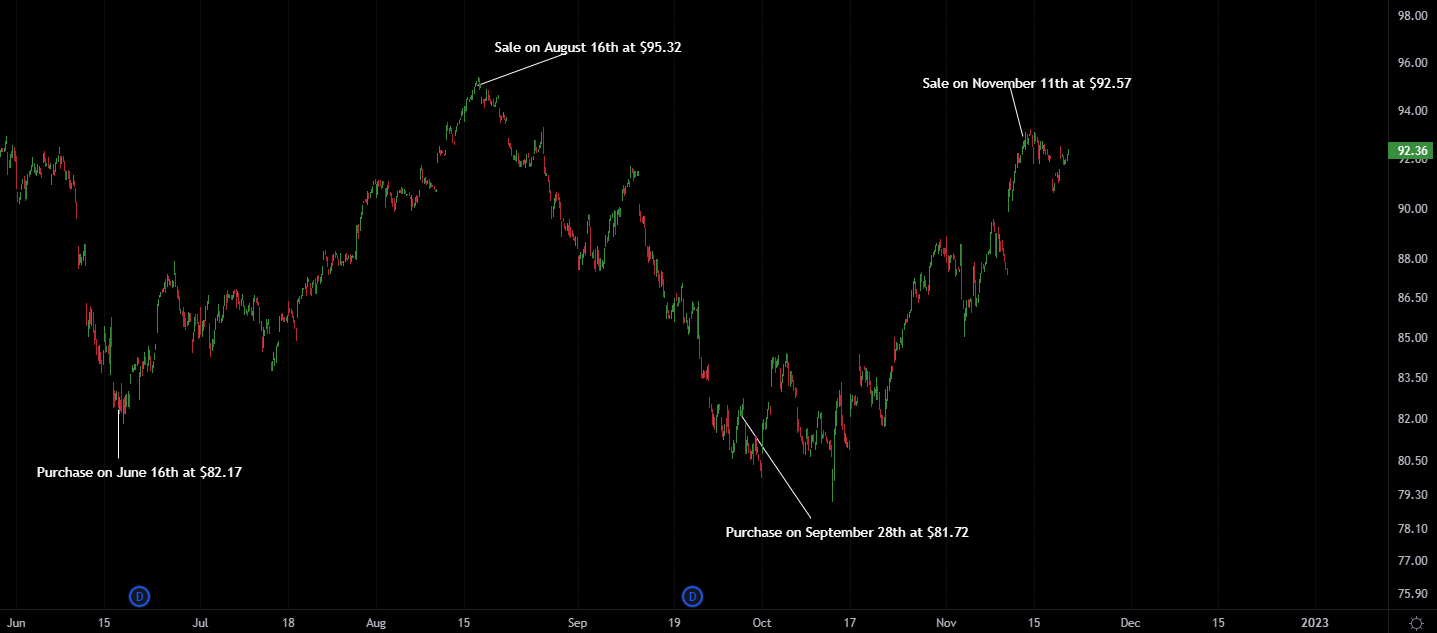
Mesa Royalty Trust (MTR), another gas-price dependent trust, currently has the fastest growing yield with a TTM growth rate of 207%, while Cisco Systems, Inc. (CSCO) has the slowest at 3% We include CSCO in the portfolio because of their profitability, dividend coverage by free cash flow, and impressive trends across several metrics we track (liabilities, leverage, return on assets). We’ve noticed, over the years, that companies with strong and improving financial strength outperform. Capital gravitates to uses and places where it is safe and treated well.
Cisco Six Month Buy Sell Pattern (TradingView)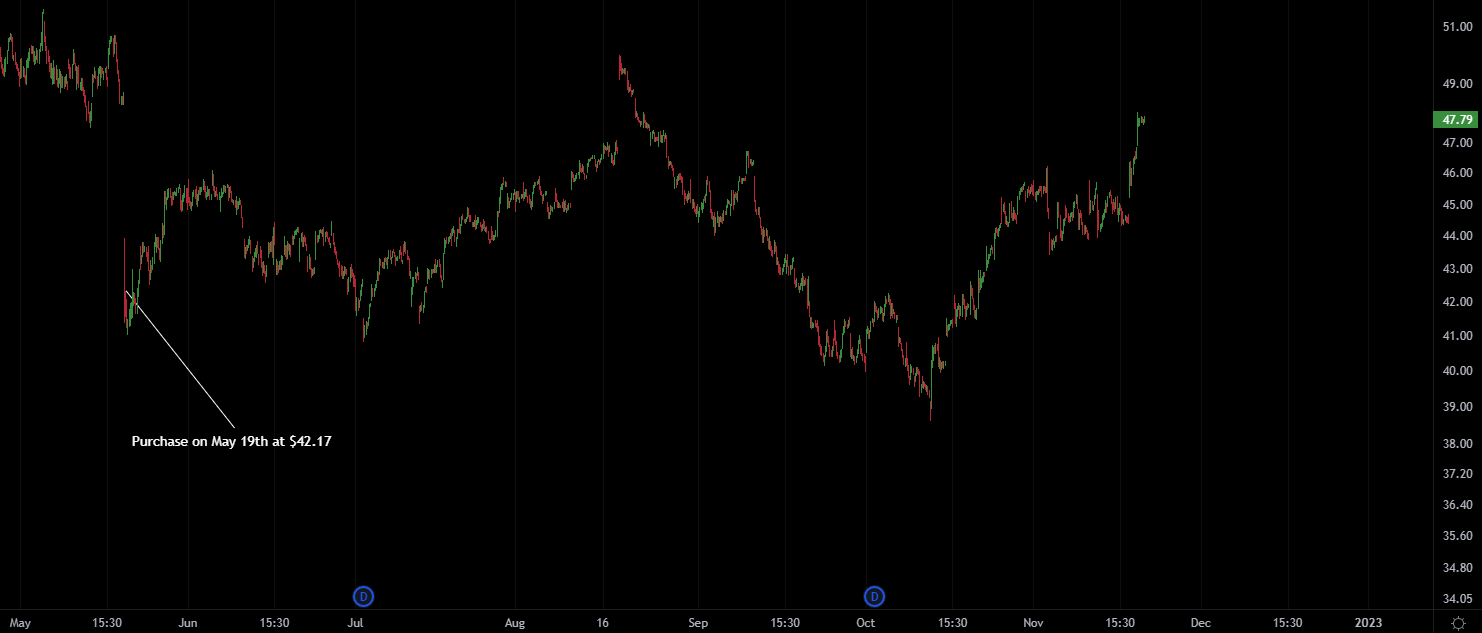
Cisco Financial Statement Trend Analysis (dividendrisk.com)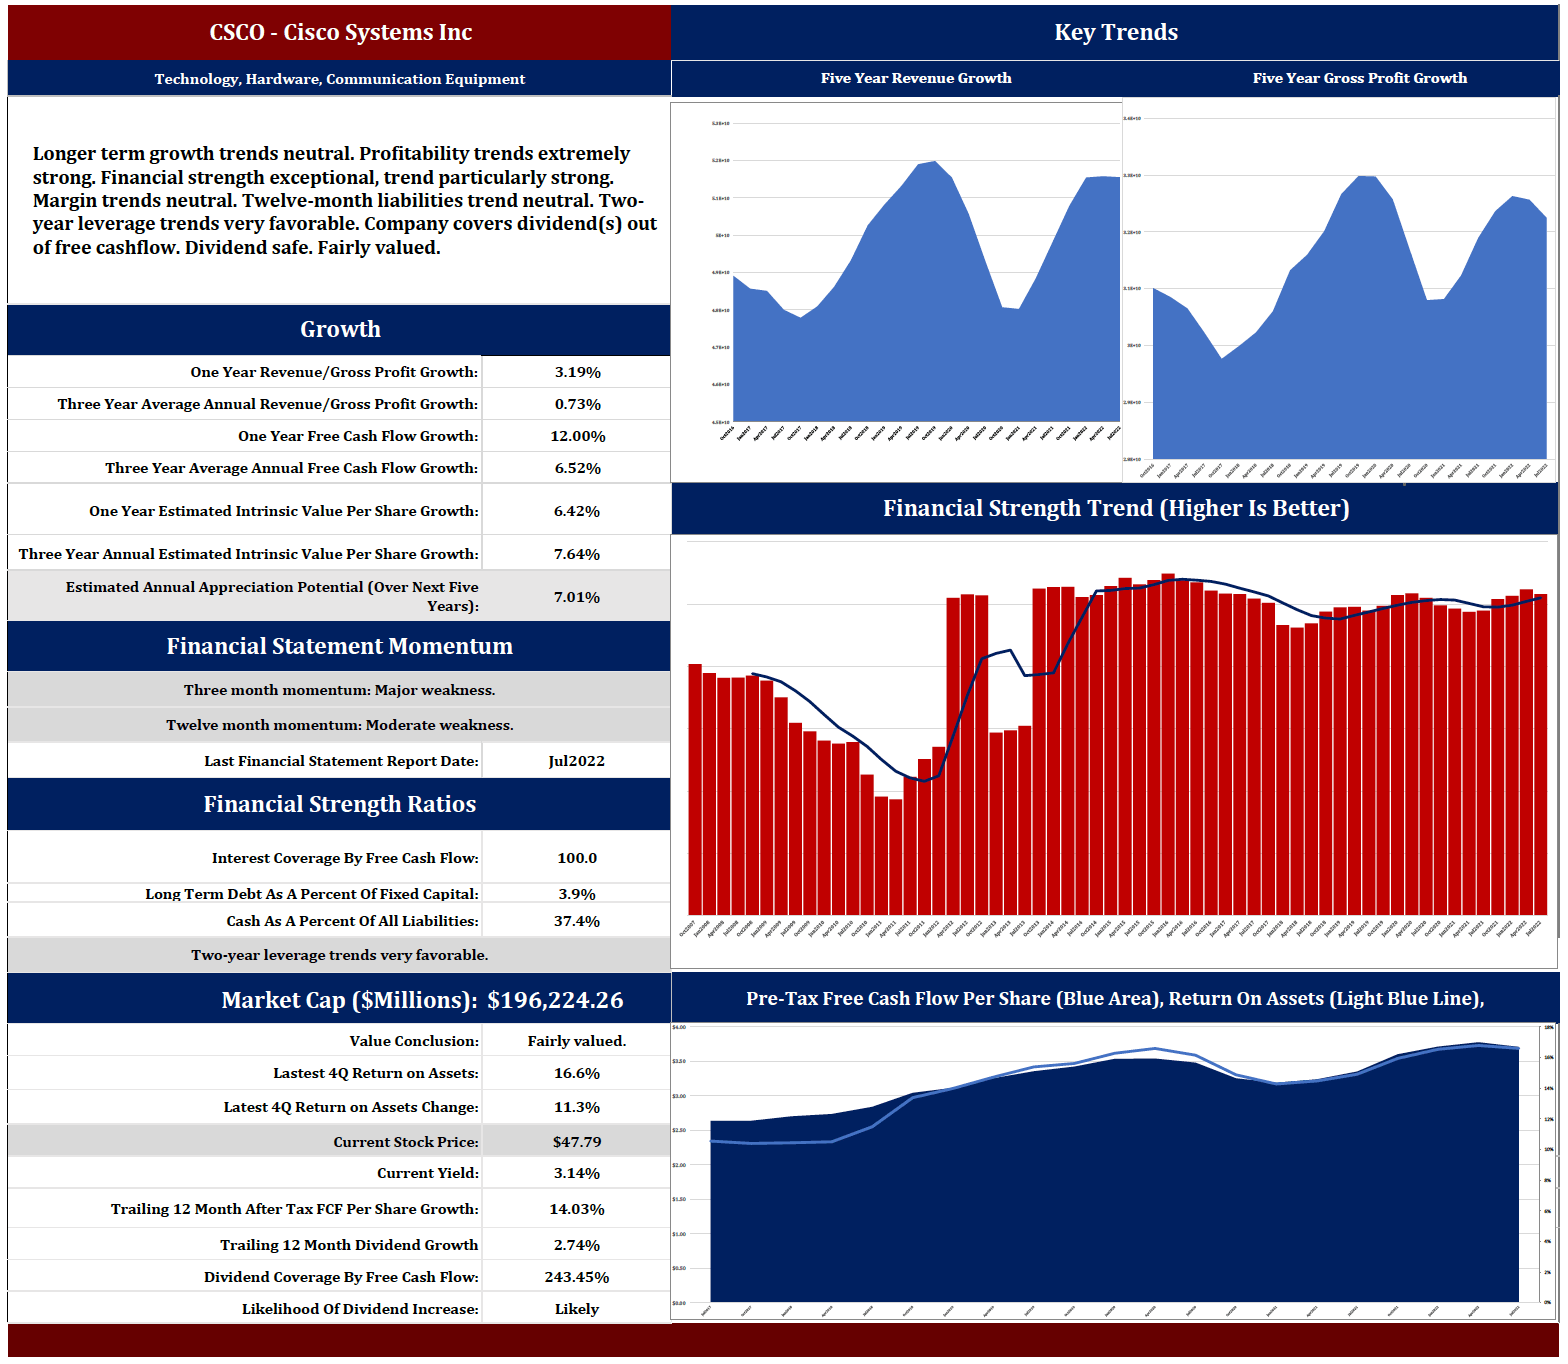
While the broader market dances to the tune of the Federal Reserve, high-yielding, financially strong companies fare better than marginally or unprofitable growth companies where the real payout is years in the future. Our research weeds out firms that underperform in this environment and identifies those that are stewards of shareholder value.
Our algorithm then takes that list of companies that meet our criteria (basically financially strong, free cash flow dividend payers) and analyzes their trading patterns over the last 6 months. The algo updates every hour to capture emerging market trends. Its results are based on the patterns established over the last six months. It is important therefore to note that the upcoming months are likely to be at least slightly different, and perhaps significantly different. But the software increases the already high odds in favor of cautious investors in quality dividend-payers.
Our software identifies mean-reversion (similar to buy-the-dip, but more nuanced and intelligent) opportunities. Say, for example, a particular security has moved from $8 to $10 three times in the past six months. Our algorithm picks up on that and provides, every hour, a buy-under and sell-over zone for subscribers that captures 75% of similar moves, should they materialize. If we enter a position and are unable to exit at a sell target, we are still capturing attractive yield from financially strong securities.
Over the past few weeks, nineteen stocks or ETFs were in buy zones, but with the recent market strength, our portfolio now has two sells, zero buys, and nineteen holds. As the next cycle plays out, new opportunities will emerge, and the algorithm will be ready.
Be the first to comment