

littleny
Earnings of Financial Institutions, Inc. (NASDAQ:FISI) will likely remain flattish next year. Anticipated loan growth and slight margin expansion will lift the bottom line. On the other hand, inflation-driven growth in non-interest expenses will curtail earnings growth. Overall, I’m expecting Financial Institutions to report earnings of $3.75 per share for 2022, down 22%, and $3.74 per share for 2023, done by just 0.2% year-over-year. Next year’s target price suggests a high upside from the current market price. Therefore, I’m upgrading Financial Institutions, Inc. to a buy rating.
Raising my Margin Estimate
Financial Institutions’ net interest margin increased by just nine basis points during the third quarter, which is not surprising considering that only around 32% of the loan portfolio is indexed to variable interest rates. On the other hand, adjustable-rate deposits make up 56% of total deposits. When I wrote my last report on Financial Institutions in September, the company’s balance sheet was liability-sensitive, which means the repricing of its liabilities outweighed the repricing of assets in the short term. As a result, rising interest rates could hurt the margin.
During the third quarter, the management shifted from some wholesale funds to non-maturity deposits, which reprice at a slower pace than wholesale funds. As a result, the balance sheet is no longer liability-sensitive. According to the latest results of the management’s rate sensitivity model, a 200-basis points hike in interest rate could boost the net interest income by 0.36% over twelve months, as mentioned in the 10-Q filing.
Considering these factors, I’m expecting the margin to grow by four basis points in the last quarter of 2022 and five basis points in 2023. In my last report on the company, I projected the margin to remain mostly unchanged during 2023. I’ve changed my estimates now because of the change in the asset-liability sensitivity.
Loan Growth to Slow Down
Financial Institutions’ loan growth accelerated to 2.7% in the third quarter from 0.8% in the second quarter of the year. The management mentioned in the conference call that its pipeline is strong. The pipeline was close to $800 million at the time of the conference call. To put this number in perspective, $800 million is 21% of total loans outstanding at the end of September 2022.
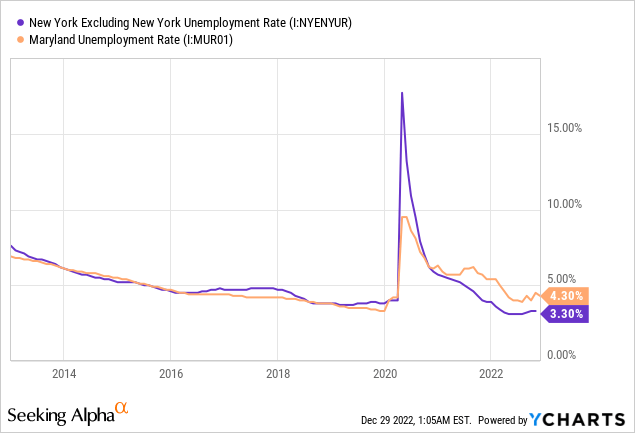
Strong job markets will further support loan growth. Financial Institutions, Inc. mostly operates in the western and central parts of New York State with a limited presence in Maryland. As shown below, New York state’s unemployment rate, excluding New York City, has remained near record lows throughout this year.
On the other hand, high-interest rates will hurt credit demand, especially in residential mortgages. Residential loans made up a sizable 17% of total loans at the end of September 2022. Therefore, troubles in this segment will have a material impact on the total loan portfolio.
Overall, I’m expecting the loan portfolio to grow by 1% in the last quarter of 2022, taking full-year loan growth to 6%. For 2023, I’m expecting the portfolio to grow by 4%. Further, I’m expecting deposits to grow mostly in line with loans. The following table shows my balance sheet estimates.
| Financial Position | FY18 | FY19 | FY20 | FY21 | FY22E | FY23E |
| Net Loans | 3,053 | 3,191 | 3,543 | 3,640 | 3,861 | 4,018 |
| Growth of Net Loans | 13.0% | 4.5% | 11.0% | 2.7% | 6.1% | 4.1% |
| Other Earning Assets | 895 | 781 | 904 | 1,390 | 1,171 | 1,195 |
| Deposits | 3,367 | 3,556 | 4,278 | 4,827 | 4,954 | 5,155 |
| Borrowings and Sub-Debt | 509 | 315 | 79 | 104 | 145 | 150 |
| Common equity | 379 | 422 | 451 | 488 | 357 | 376 |
| Book Value Per Share ($) | 23.8 | 26.3 | 28.1 | 30.6 | 23.2 | 24.4 |
| Tangible BVPS ($) | 19.0 | 21.6 | 23.5 | 25.9 | 18.4 | 19.6 |
| Source: SEC Filings, Author’s Estimates(In USD million unless otherwise specified) | ||||||
Surge in Non-Interest Expenses to Keep Earnings Flattish
The high inflation environment will lift non-interest expenses, especially salary expenses. Additionally, the tight labor market will push up salary costs as the management will have to give pay raises to retain talent. As mentioned in the conference call, the management expects the efficiency ratio for the full year to be around 59% to 60%, as opposed to a ratio of 58.9% in the third quarter of the year.
The anticipated loan growth and slight margin expansion will counter the effect of a surge in non-interest expenses. Overall, I’m expecting Financial Institutions to report earnings of $3.74 per share for 2023, almost unchanged from my earnings estimate of $3.75 per share for 2022. The following table shows my income statement estimates.
| Income Statement | FY18 | FY19 | FY20 | FY21 | FY22E | FY23E |
| Net interest income | 123 | 130 | 139 | 155 | 168 | 179 |
| Provision for loan losses | 9 | 8 | 27 | (8) | 10 | 13 |
| Non-interest income | 36 | 40 | 43 | 47 | 47 | 47 |
| Non-interest expense | 101 | 103 | 109 | 113 | 129 | 139 |
| Net income – Common Sh. | 38 | 47 | 37 | 76 | 58 | 58 |
| EPS – Diluted ($) | 2.39 | 2.96 | 2.30 | 4.78 | 3.75 | 3.74 |
| Source: SEC Filings, Earnings Releases, Author’s Estimates(In USD million unless otherwise specified) | ||||||
In my last report on Financial Institutions, I estimated earnings of $3.65 per share for 2022 and $3.64 per share for 2023. I’ve slightly increased my earnings estimates mostly because I’ve raised my margin estimates.
My estimates are based on certain macroeconomic assumptions that may not come to fruition. Therefore, actual earnings can differ materially from my estimates.
Upgrading to a Buy Rating
Financial Institutions’ dividend has increased every year since 2011. Given the earnings outlook, I’m expecting the company to raise its quarterly dividend by only $0.01 per share next year to $0.30 per share. The earnings and dividend estimates suggest a payout ratio of 32% for 2023, which is close to the five-year average of 36%. Therefore, the dividend appears quite secure. Based on my dividend estimate, FISI is offering a forward dividend yield of 5.0%.
I’m using the historical price-to-tangible book (“P/TB”) and price-to-earnings (“P/E”) multiples to value Financial Institutions. The stock has traded at an average P/TB ratio of 1.25 in the past, as shown below.
| FY18 | FY19 | FY20 | FY21 | Average | |
| T. Book Value per Share ($) | 19.0 | 21.6 | 23.5 | 25.9 | |
| Average Market Price ($) | 31.1 | 29.2 | 20.0 | 30.1 | |
| Historical P/TB | 1.64x | 1.35x | 0.85x | 1.16x | 1.25x |
| Source: Company Financials, Yahoo Finance, Author’s Estimates | |||||
Multiplying the average P/TB multiple with the forecast tangible book value per share of $19.6 gives a target price of $24.6 for the end of 2023. This price target implies a 2.7% upside from the December 28 closing price. The following table shows the sensitivity of the target price to the P/TB ratio.
| P/TB Multiple | 1.05x | 1.15x | 1.25x | 1.35x | 1.45x |
| TBVPS – Dec 2023 ($) | 19.6 | 19.6 | 19.6 | 19.6 | 19.6 |
| Target Price ($) | 20.6 | 22.6 | 24.6 | 26.5 | 28.5 |
| Market Price ($) | 23.9 | 23.9 | 23.9 | 23.9 | 23.9 |
| Upside/(Downside) | (13.8)% | (5.6)% | 2.7% | 10.9% | 19.1% |
| Source: Author’s Estimates |
The stock has traded at an average P/E ratio of around 9.5x in the past, as shown below.
| FY18 | FY19 | FY20 | FY21 | Average | |
| Earnings per Share ($) | 2.39 | 2.96 | 2.30 | 4.78 | |
| Average Market Price ($) | 31.1 | 29.2 | 20.0 | 30.1 | |
| Historical P/E | 13.0x | 9.9x | 8.7x | 6.3x | 9.5x |
| Source: Company Financials, Yahoo Finance, Author’s Estimates | |||||
Multiplying the average P/E multiple with the forecast earnings per share of $3.74 gives a target price of $35.5 for the end of 2023. This price target implies a 48% upside from the December 28 closing price. The following table shows the sensitivity of the target price to the P/E ratio.
| P/E Multiple | 7.5x | 8.5x | 9.5x | 10.5x | 11.5x |
| EPS 2023 ($) | 3.74 | 3.74 | 3.74 | 3.74 | 3.74 |
| Target Price ($) | 28.0 | 31.7 | 35.5 | 39.2 | 43.0 |
| Market Price ($) | 23.9 | 23.9 | 23.9 | 23.9 | 23.9 |
| Upside/(Downside) | 17.0% | 32.6% | 48.3% | 63.9% | 79.6% |
| Source: Author’s Estimates |
Equally weighting the target prices from the two valuation methods gives a combined target price of $30.0, which implies a 25.5% upside from the current market price. Adding the forward dividend yield gives a total expected return of 30.5%.
In my last report on the company, I adopted a hold rating even though my target price suggested a high price upside. At that time, I had adopted a hold rating because the up-rate cycle was far from over. As we are now further along in the cycle, I believe it’s appropriate to upgrade Financial Institutions to a buy rating.
Be the first to comment