

nespix/iStock via Getty Images
Written by Nick Ackerman, co-produced by Stanford Chemist. This article was originally published to members of the CEF/ETF Income Laboratory on April 3rd, 2022.
First Trust Energy Infrastructure (NYSE:FIF) could be considered a more conservative way to gain energy exposure. The fund has a significant weighting of utility positions in its portfolio. Both energy and utilities have been performing well as we entered into 2022. That has combined to push FIF back up to almost near its pre-2020 COVID crash levels, which many other “energy” closed-end funds haven’t been able to achieve.
That is where it appears that the utility exposure helped ease some of the downside relative to other CEFs. The more modest utilization of leverage also helped. Although, they did have to deleverage significantly too, the latest report still shows that they are running at more reduced leverage than heading into 2020.
YCharts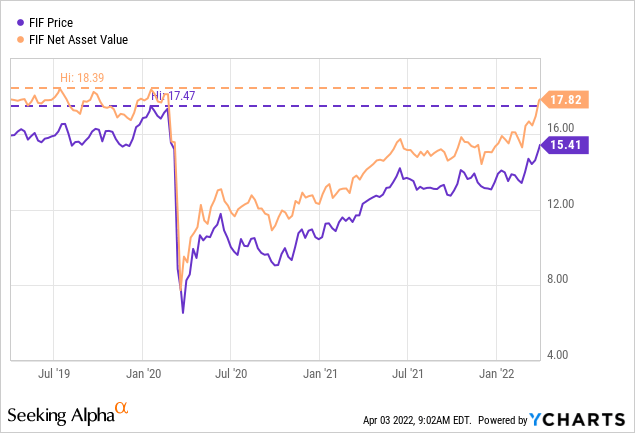
The caution here is that after such a strong run in the energy sector already, is there more upside left? I’m not one to time the market myself, so I don’t have an answer to that question. However, taking some profits from some other pure-play energy funds could make sense here. FIF could be a middle ground play if one is unsure of where energy goes next. It would allow some further upside for energy exposure but also the downside protection of utilities.
One fund, in particular, that comes across on the screener is First Trust Energy Income And Growth (FEN). A sister fund of FIF under the First Trust umbrella. This one catches my attention because it screens the highest in terms of its discount/premium. In fact, it is the only fund at a premium at the time of writing. That would make it the most suitable to take that capital and invest in FIF instead.
MLP Screen (CEFConnect)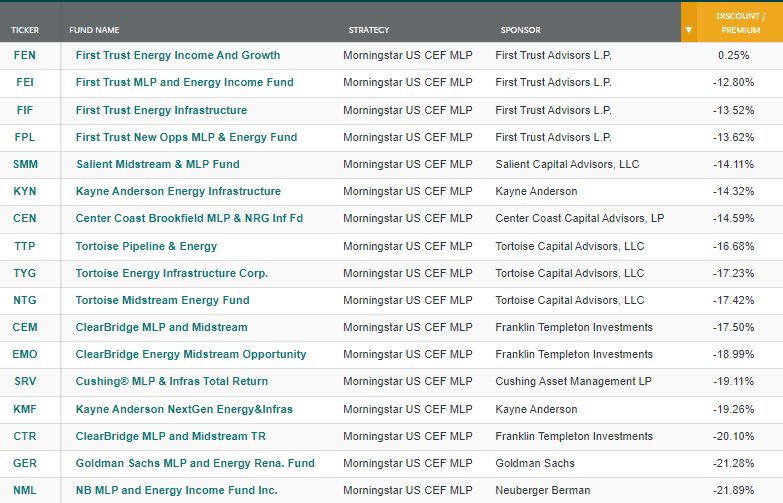
Several of these funds aren’t funds, in a manner of speaking, at least given the legal structure and when it comes to taxes. Instead, they are C-corps. FIF is a bit different because it is a regulated investment company, such as many other closed-end fund investors will be familiar with. One of the reasons for this is that any fund that wants to hold more than a 25% allocation to MLPs will have to be structured as a C-corp. That means taxes at the fund level when structured as a C-corp. FIF intends to “continue to qualify as a regulated investment company.”
The Basics
- 1-Year Z-score: -2.37
- Discount: -14.94%
- Distribution Yield: 4.90%
- Expense Ratio: 1.45%
- Leverage: 17.66%
- Managed Assets: $355.5 million
- Structure: Perpetual
The objective of FIF is “to seek a high level of total return with an emphasis on current distributions paid to shareholders.” They intend to achieve this through “investing primarily in securities of companies engaged in the energy infrastructure sector. These companies principally include publicly-traded master limited partnerships and limited liability companies taxed as partnerships, MLP affiliates, YieldCos, pipeline companies, utilities and other infrastructure-related companies that derive at least 50% of their revenues from operating, or providing services in support of, infrastructure assets such as pipelines, power generation industries.”
To sum up in fewer words, they simply invest in anything infrastructure-related in the energy and utility sectors. That leaves them quite flexible to invest within these sectors.
The expense ratio for the fund is higher relative to other CEFs. One thing I find a bit unusual is that energy funds often run with higher expense ratios. I find it unusual because they primarily invest in publicly traded companies, just the same as most other CEFs. When including leverage, the expense ratio comes to 1.70%.
Their borrowing costs are based on floating rate borrowings. With higher interest rates coming, the leverage expenses will also be rising. Their rate isn’t as straightforward as other funds. Here is the wording from their last Annual Report:
The Fund has a credit agreement with The Bank of Nova Scotia (“Scotia”). The credit agreement provides a secured line of credit for the Fund where Fund assets are pledged against advances made to the Fund. The maximum commitment amount is $72,000,000. Prior to February 10, 2021, the maximum commitment amount was $66,000,000. At the option of the Fund the borrowing rate is either (i) the applicable LIBOR rate plus 85 basis points (prior to February 10, 2021, 95 basis points) or (ii) the greater of (a) the prime rate as in effect from time to time, (b) the federal funds effective rate plus 2% and (c) the overnight eurodollar rate plus 2%. Under the credit agreement, the Fund pays a commitment fee of 0.25% when the loan balance is less than 75% of the maximum commitment or 0.15% in all other events.
At the end of November 30th, 2021, their fiscal year-end, the average interest rate was 0.98%.
As most energy-related funds had to deleverage in 2020, FIF was no different. They had borrowings of $107.5 million in 2019, which was slashed to $55.3 million in 2020. They then have added a bit back since.
FIF Indebtedness (First Trust)
Performance – Attractive Discount
What had been helping FIF during the downturn was the utility exposure. However, since the recovery in 2020, it has actually meant more of a subdued recovery too. That is, despite utilities holding their own in 2022, energy has just been so much of a stronger performer to start off this year.
That’s why a much more pure-play energy fund has performed better on a YTD basis. We will use Tortoise Pipeline & Energy (TTP) as a reference.
YCharts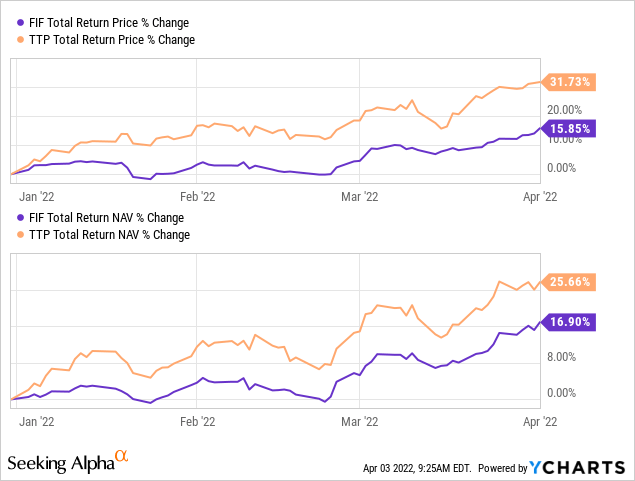
Going back to the actual bottom in 2020 shows us an even more interesting chart. The bottom was on March 23rd, 2020. We will compare FIF to TTP once again.
YCharts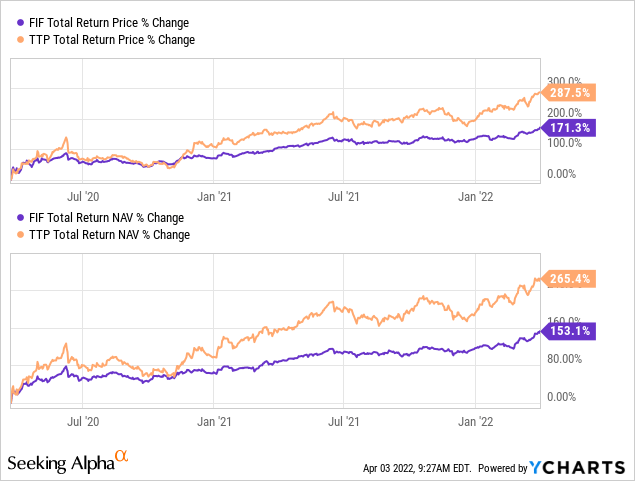
Of course, this was all due to just how significantly TTP fell relative to FIF during the crash. If we look at the last ten-year performance between these funds, we see a wholly different picture. In this case, FIF has really shined, relatively speaking.
YCharts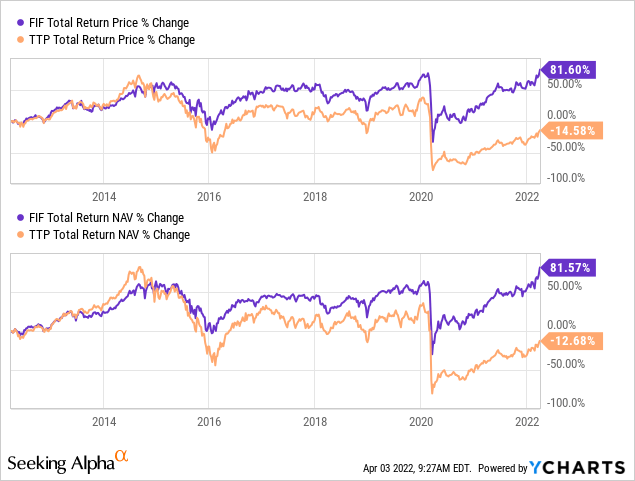
To sum up, utility exposure can be a blessing and a curse. It has helped the fund stay more stable over the longer term, where energy has been a serial underperformer. On the other hand, if energy continues its significant run – after already climbing massively – the utility exposure could hold it back.
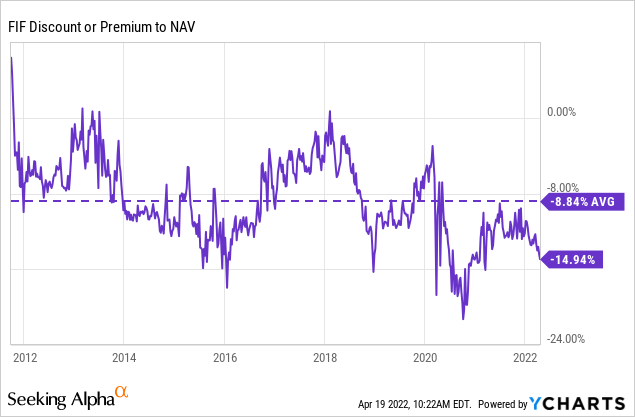
In terms of FIF’s discount, it is quite appealing at this time too. After 2020, anything related to energy is getting a bit of an “energy” discount. The funds mostly remain deeply discounted relative to where they had been trading previously.
This is easily visualized when looking at the discount/premium chart since FIF’s inception. While there had been previous times the fund has dipped to significant discounts, it seems it has been even more persistent over the past several years. Funds associated with energy have been pushed aside by most investors due to poor historical performance.
Distribution – Due For A Boost
I think for the distribution, energy funds have been mostly cautious about raising back up to the levels they were at before. However, at some point, if they ever want to take profits on their portfolio, they could be forced to start paying more. Or, at the very least, be forced to pay a couple of year-end specials if they want to avoid the excise tax.
FIF Distribution History (CEFConnect)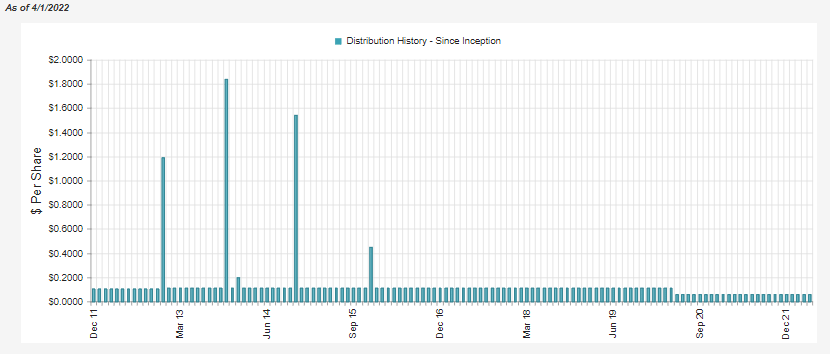
The latest distribution rate works out to a yield of 4.90%; when looking at the NAV rate, it comes to 4.16%. Being at such a low level is also likely playing a role in the fund’s wider discount.
In terms of distribution coverage, it has been quite strong for FIF. Net investment income coverage works out to 18.8%.
FIF Annual Report (First Trust)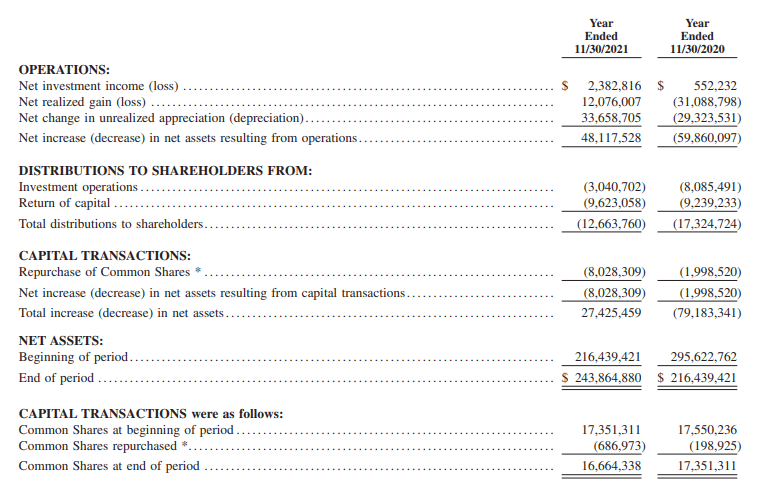
One might be thinking that is terrible coverage. That’s where the MLP exposure comes in, though. If we drop down to their cash flows from operating activities breakdown, we see the return of capital received from investments in MLPs. That is just as good as dividends and interest received from C-corps for paying out distributions to shareholders.
FIF Annual Report (First Trust (highlights from author))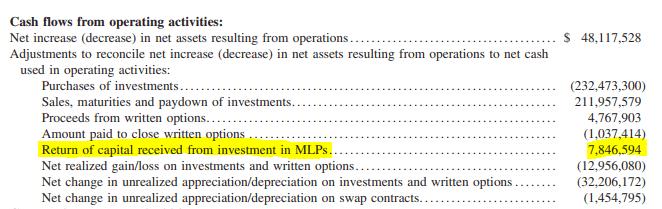
When we include that in with the NII, we arrive at $10,229,410 – which makes coverage jump up to over 80%. That still isn’t entirely enough to “cover” the payout to shareholders, but it would only require a rather small amount of capital gains on top of it to achieve full coverage. Given the realized gains they pulled in during the previous fiscal year, it was more than enough to cover the distribution entirely.
Based on the number of assets at the end of their fiscal year, it would require around 0.79% in appreciation for the fund to cover the distribution. Based on the around $355.5 million in total managed assets, going forward now, it would be around a 0.68% gain in the fund to cover the shortfall.
They have also been repurchasing their shares to try to reduce the fund’s discount. Since shares are being taken out at a discount to NAV, it is a positive for shareholders. The amount they are repurchasing is immaterial, to be quite honest, but it is an effort that other funds don’t generally bother with. The only other fund sponsor I’ve seen that is rather aggressive with share repurchases has been the Tortoise funds.
As an example, TTP had repurchased nearly $5 million in their latest fiscal year. That’s when TTP itself only has around $96 million in total managed assets at this time.
For tax purposes, FIF distributes out a significant amount of return of capital. Again, this is reflective of what the fund receives from its underlying MLP exposure that pays a significant amount of distributions classified as ROC. Of course, it hasn’t been all non-destructive ROC over the years. There have been years where the fund has been declining while paying out ROC, which we would technically identify as destructive anytime a fund pays out more than what it earns, and the NAV declines.
FIF Annual Report (First Trust)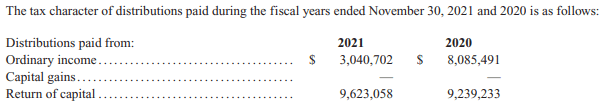
FIF’s Portfolio
The fund is quite active in terms of turnover in its portfolio. The last portfolio turnover rate was 73% in fiscal 2021. The lowest in the last five years was in 2017, at a turnover rate of 42%. While there seems to be a lot going on underneath, the overall picture of the fund remains relatively undisturbed in terms of its weightings.
FIF Sector Weightings (First Trust)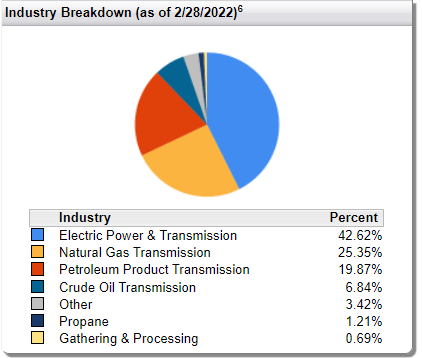
The industry breakdown from around five months ago, when we last took a look at the end of October, had electric power & transmission as the largest weighting. At that time, it was around 44.66%. The natural gas transmission was also the second-largest allocation at around 22.24%. Finally, petroleum product transmission was another sizeable allocation that had been at 18.85%. Crude oil transmission exposure is only marginal and actually changed very little over the last five months as it stood at 6.89% weighting.
This still puts FIF as essentially a hybrid fund with a roughly 50/50 exposure to energy and utilities. In the energy space, it is mostly the “transmission” type or pipeline MLPs. As a reminder, as a RIC, they can hold MLPs, but it is limited to below 25% of assets. This is worth noting because several of their most prominent positions are MLPs. Some of the most popular, too, are Enterprise Products Partners (EPD) and Magellan Midstream Partners (MMP), at the number one and number two spots.
FIF Top Ten (First Trust)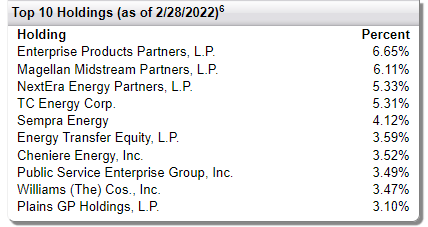
These were the top two holdings when we covered the fund at the end of October 31st, 2021.
If we go back even further than that, to the period ending July 31st, 2021, we can see MMP was the largest position. It was then followed by EPD. However, the weighting has come down since that time.
Now, if you want to go back even further than that to the end of the calendar year 2020, we once again see MMP and EPD lead the top list. In fact, several of these names appear that are present at this time.
That’s why I point out that turnover is elevated in this fund but not really producing a meaningful difference in overall weighting or even in some of the top allocations. In total, CEFConnect puts the total number of holdings at 67. That is a relatively narrow number of holdings.
These two are often seen as the most popular due to their size and their conservative management. The type of conservative management meant they saw no distribution cuts during 2020. They might have frozen their payouts to unitholders for several quarters, but no cuts.
They then turned around to raise their payouts avoiding a stagnant distribution for a year-over-year period. Meaning that they have kept their annual increases intact. It was simply the every quarter raise that was halted. These two were consistent quarterly raisers but seem content with going the more traditional annual raises at this time.
YCharts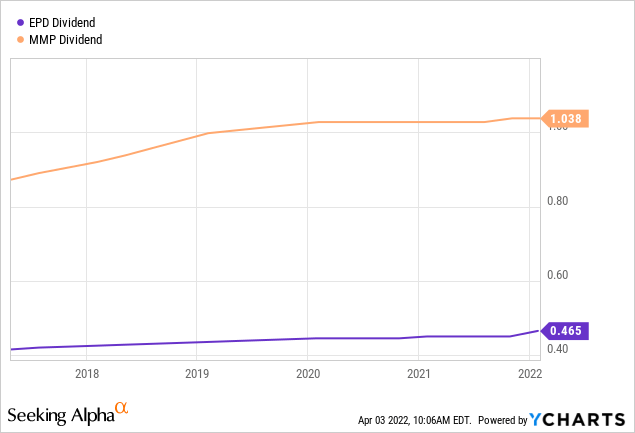
Conclusion
FIF might be a better option for investors in the energy space at this time. It is at an attractive valuation and could be a great place to park cash if you are unsure if energy can continue to run higher. The distribution at this time is rather low but seems ripe for a boost based on their strong distribution coverage. On the other hand, it also leaves them a lot of downside cushion if things start to go south again.
Be the first to comment