

alexsl
This dividend ETF (exchange-traded fund) article series aims at evaluating products regarding the relative past performance of their strategies and quality metrics of their current portfolios. As holdings and their weights change over time, updated reviews are posted when necessary.
FDRR strategy and portfolio
The Fidelity Dividend ETF for Rising Rates ETF (NYSEARCA:FDRR) has been tracking the Fidelity Dividend Index for Rising Rates Index since 09/12/2016. It has 123 holdings, a distribution yield of 2.75%, and a total expense ratio of 0.29%. Distributions are paid quarterly.
As described in the prospectus, the index:
“is designed to reflect the performance of stocks of large and mid-capitalization dividend-paying companies that are expected to continue to pay and grow their dividends and have a positive correlation of returns to increasing 10-year U.S. Treasury yields.”
FDRR invests mostly in U.S. based companies (94.7% of asset value), but also in Europe (4.7%) and a bit in Asia. Large companies represent about 83% of the portfolio. Technology is the heaviest sector. In fact, the fund’s sector breakdown is close to the S&P 500 (SPY).
FDRR sector breakdown (Chart: author; data: Fidelity)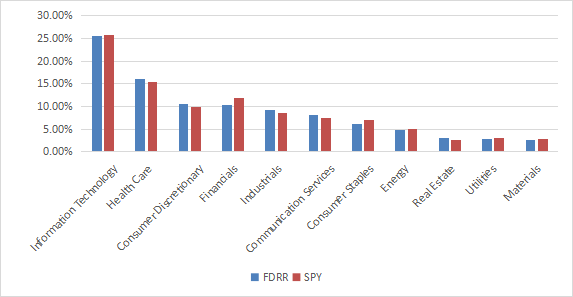
The top 10 holdings, listed below with fundamental ratios, represent 27.9% of asset value. The fund has a significant exposure to risks related to the top 2 names: Apple (6.11%) and Microsoft (5.29%). Other holdings are below 2.5%.
|
Ticker |
Name |
Weight% |
EPS growth %TTM |
P/E TTM |
P/E fwd |
Yield% |
|
Apple, Inc. |
6.11% |
8.83 |
21.42 |
21.18 |
0.70 |
|
|
Microsoft Corp. |
5.29% |
3.73 |
24.66 |
23.89 |
1.19 |
|
|
Merck & Co., Inc. |
2.45% |
112.19 |
18.44 |
14.98 |
2.64 |
|
|
Johnson & Johnson |
2.44% |
7.38 |
24.38 |
17.43 |
2.58 |
|
|
AbbVie, Inc. |
2.13% |
78.71 |
21.28 |
11.53 |
3.71 |
|
|
Visa, Inc. |
2.05% |
24.76 |
32.29 |
26.67 |
0.81 |
|
|
Gilead Sciences, Inc. |
1.93% |
-54.90 |
32.95 |
12.29 |
3.35 |
|
|
Amgen, Inc. |
1.90% |
28.55 |
21.95 |
15.50 |
3.11 |
|
|
The Home Depot, Inc. |
1.82% |
10.97 |
19.32 |
19.23 |
2.37 |
|
|
Bristol Myers Squibb Co. |
1.79% |
227.73 |
23.35 |
9.42 |
3.18 |
Historical performance
Since inception (09/12/2016), FDRR has underperformed SPY and the Vanguard Dividend Appreciation ETF (VIG) in total return and risk-adjusted performance (Sharpe ratio). It also shows a higher risk measured in maximum drawdown.
|
Total Return |
Annual Return |
Drawdown |
Sharpe ratio |
Volatility |
|
|
FDRR |
94.51% |
11.12% |
-36.52% |
0.61 |
16.75% |
|
SPY |
104.41% |
12.00% |
-33.72% |
0.66 |
16.93% |
|
VIG |
110.66% |
12.53% |
-31.72% |
0.75 |
15.15% |
Data calculated with Portfolio123.
The next chart compares FDRR since inception with 4 dividend growth ETFs in total return. It has underperformed all of them. The best performer in this group is the WisdomTree U.S. Quality Dividend Growth Fund (DGRW).
FDRR vs dividend growth funds since inception (Portfolio123)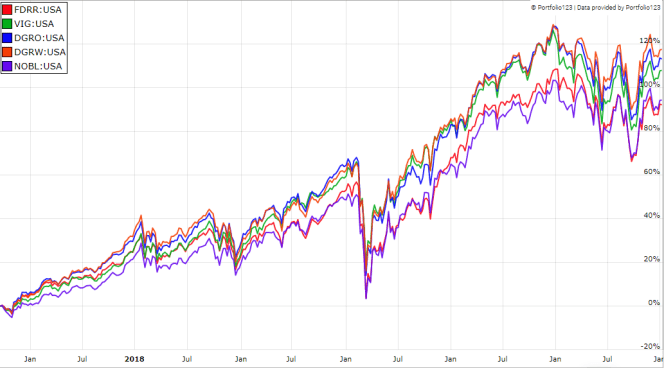
FDRR has also lagged its competitors by a short margin in the last 12 months, despite the 10-year Treasury yield increasing from 1.76% to 3.62%.
FDRR vs dividend growth funds, last 12 months (Portfolio123)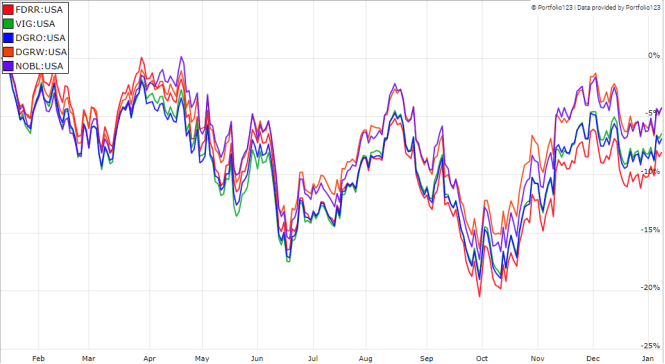
In previous articles, I have shown how three factors may help cut the risk in a dividend portfolio: Return on Assets, Piotroski F-score, and Altman Z-score.
The next table compares FDRR since inception with a subset of the S&P 500: stocks with above-average dividend yield and ROA, a good Altman Z-score, a good Piotroski F-score and a sustainable payout ratio. It is rebalanced annually to make it comparable with a passive index.
|
Total Return |
Annual Return |
Drawdown |
Sharpe ratio |
Volatility |
|
|
FDRR |
94.51% |
11.12% |
-36.52% |
0.61 |
16.75% |
|
Dividend & quality subset |
119.97% |
13.31% |
-35.84% |
0.72 |
16.98% |
Past performance is not a guarantee of future returns. Data Source: Portfolio123.
The dividend quality subset beats FDRR by 2.2 percentage points in annualized total return. However, the fund’s performance is real, and the subset is simulated. My core portfolio holds 14 stocks selected in this subset (more info at the end of this post).
The annual sum of distributions has increased from $0.89 in 2017 to $1.10 in 2022. The annualized dividend growth rate during this period is 4.4%: it is positive, but unattractive. In the same time, SPY shows an annualized dividend growth rate of 5.7%, and VIG is at 9.1%.
Scanning FDRR portfolio
FDRR is cheaper than the S&P 500 regarding usual valuation ratios, reported in the table below.
|
FDRR |
SPY |
|
|
Price/Earnings TTM |
16.3 |
20.05 |
|
Price/Book |
3.15 |
3.79 |
|
Price/Sales |
2.35 |
2.4 |
|
Price/Cash Flow |
12.27 |
14.97 |
Among 100+ holdings, 8 are risky regarding my metrics. In my ETF reviews, risky stocks are those with at least 2 red flags: bad Piotroski score, negative ROA, unsustainable payout ratio, bad or dubious Altman Z-score, excluding financials and real estate where these metrics are unreliable. They weigh less than 4% of asset value, which is a good point.
Based my calculation of weighted averages, Altman Z-score and Piotroski F-score are similar to the S&P 500. The return on assets is much better, pointing to a portfolio quality superior to the benchmark.
|
FDRR |
SPY |
|
|
Atman Z-score |
3.63 |
3.48 |
|
Piotroski F-score |
5.79 |
5.64 |
|
ROA % TTM |
10.87 |
7.8 |
Takeaway
FDRR invests in dividend stocks that should profit from rising rates, based on the correlation of returns with 10-year U.S. Treasury yields. The fund’s sector breakdown is very close to the S&P 500. The portfolio is cheaper than the benchmark regarding usual valuation ratios, and shows a better profitability, measured in return on assets. However, FDRR has lagged the major dividend growth ETFs since inception and in the last 12 months, despite rising rates. The annualized dividend growth rate is sub-par. For transparency, a dividend-oriented part of my equity investments is split between a passive ETF allocation (FDRR is not part of it) and my actively managed Stability portfolio (14 stocks), disclosed and updated in Quantitative Risk & Value.
Editor’s Note: This article discusses one or more securities that do not trade on a major U.S. exchange. Please be aware of the risks associated with these stocks.
Be the first to comment