

Coprid
Fastenal Company (NASDAQ:FAST) is a distributor of a wide range of industrial and construction products. When they were first formed, their business initially entailed supplying threaded fasteners to customers in various cities. Over time, the business expanded further into nine major product lines. Still, the sale of fasteners continues to be a large portion of revenues, accounting for about a third of total net sales.
At the end of 2021, the company had over 3K in-market locations in 25 countries. While FAST does offer some walk-in retail, the majority of their transactions are B2B. These customers are engaged primarily through the company’s branches and Onsite locations.
Through the years, FAST has greatly expanded their Onsite locations from just 214 in 2014 to about 1,400 in 2021. These strategic locations have enabled the company to provide dedicated sales and service from within or close proximity to their customer’s facilities.
With a market cap of approximately +$29B, FAST is a bit smaller than other machinery and industrial names within the broader S&P. YTD, shares are down nearly 25%, with shares currently under heightened selling pressure following their earnings release.
While value-oriented investors may scoff at FAST’s higher pricing multiple, shares do present some opportunity for upside. For one, the recent pullback has brought shares down to a new 52-week low. This is despite the release of solid quarterly results with double-digit sales growth and earnings in-line with expectations.
While the macro environment has indeed softened, volumes are up and are being supported by favorable net pricing. With the dividend also growing at double-digit rates, prospective investors could be rewarded with outsized returns upon the eventual rebound. For long-term focused investors, FAST at its lows presents an attractive entry point.
Double-Digit Sales Growth, Solid Margins
In the three-month period ended June 30, 2022, FAST reported total net sales of +$1.8B over the same number of business days as in 2021. This was 18% greater than last year and +$10M better than expected.
During the quarter, the company continued to experience strong underlying demand for manufacturing and construction equipment and supplies, with double-digit volume growth in each product category. This is despite the company charging higher prices, which contributed over 650 basis points to current period sales. While the company didn’t initiate any broad-based increases in the 2nd quarter, they benefitted from the carryover affects from earlier periods.
Q2FY22 Form 10-Q – Summary of Current Period Results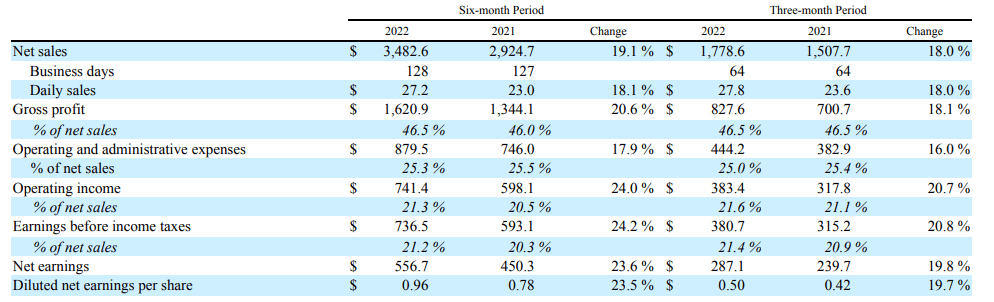
Input and transportation costs remained elevated but stable. And gross profit margins came in at 46.5%, which is in-line with Q1 and slightly higher than the 46.2% reported at the end of 2021. Product margins, however, declined slightly due to the dilutive effects of product and customer mix.
Another notable performance metric is the company’s number of Onsite locations, which is defined as sales provided within or close to a customer’s facility. During the quarter, FAST signed 102 new locations, bringing their YTD total to 208. At period end, the total figure stood at just over 1,500, which represents an increase of 13.1% from 2021. Over the remaining half of the year, FAST expects to sign 170-190 additional locations, for a full-year total of 375-400.
Within individual product categories, Fasteners accounted for a greater portion of net sales in the current period at 34.6% versus 33.6% last year, driven by sales growth of 21.2%. Safety products and other products also exhibited double-digit sales growth but at 13.8% and 17%, respectively.
Strong sales and slowing expense growth contributed to operating margins of 21.6%, up from 21.1% reported in Q2FY21 and the 21% reported in Q1FY22. Overall net earnings for the period came in at +$287.1M, which was up 19.8% and in-line with per share analyst estimates.
Conservative Balance Sheet and Effective Operating Performance
At March 31, 2022, FAST had total current assets of +$3.0B, comprised principally of A/R and inventory of +$2.7B, and total current liabilities of +$745.5M.
In the current period, inventories were up 25%. TTM turnover, however, was 2.29, representing days to sale of about 159. This is an improvement over the 161 days reported at the end of 2021 and their five-year average of 166 days.
The timing of their collections on A/R and payments of A/P also appear to be in-line with prior periods. Compared to the number of days it takes FAST to sell inventory and collect on A/R, which together is over 200 days, the company appears to be rather quick to pay off their suppliers, averaging just 25 days. While this is great for relationship purposes, it results in 175 net days in which the company is waiting on cash receipts.
Q2FY22 Form 10-Q – Partial Balance Sheet Q2FY22 Form 10-Q – Partial Balance Sheet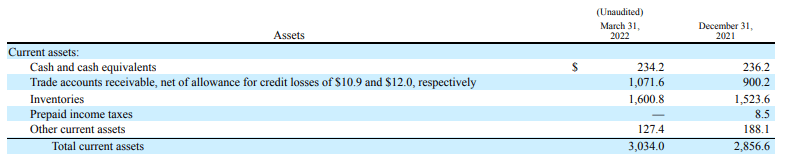
With +$234M in cash and equivalents at period end, there are no liquidity concerns, given their relatively low balance of current liabilities. Additionally, substantially all their +$700M revolving credit facility was available for use at the end of the quarter.
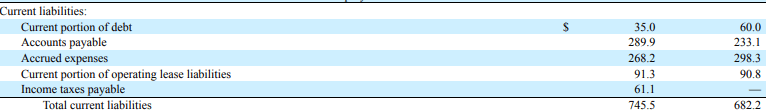
From a longer-term perspective, FAST has total debt of +$505M, which represents just 13.7% of total capital. This compares to +$405M, or 12.3% of total capital, at the end of the second quarter of 2021. While total leverage has indeed increased, it is of limited concern. At the end of December 31, 2021, the maturities on their debt were weighted towards later years, with nearly 30% due in 2027 and thereafter.
FY21 Form 10-K – Summary of Debt Maturities
With interest expense accounting for just a fraction of earnings, FAST is more than capable of servicing their obligations in the years prior to maturity.
The strong earnings potential of the company is supported by effective cost management. Even during the current inflationary environment, FAST is maintaining strong gross profit margins in the mid 40% range.
Q2FY22 Investor Presentation – Gross Profit Margins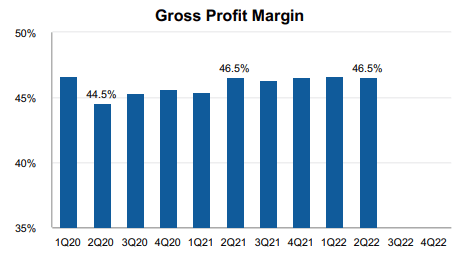
Operating margins, in fact, have increased for three consecutive quarters and are more reflective of a pre-pandemic environment.
Q2FY22 Investor Presentation – Operating Income Margins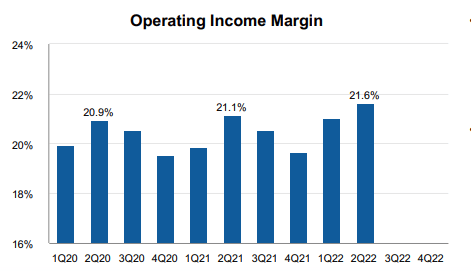
Compared to the sector average, FAST is performing strongly on all reportable metrics and are even outperforming their own averages over a five-year timespan.
Seeking Alpha – FAST Profitability Metrics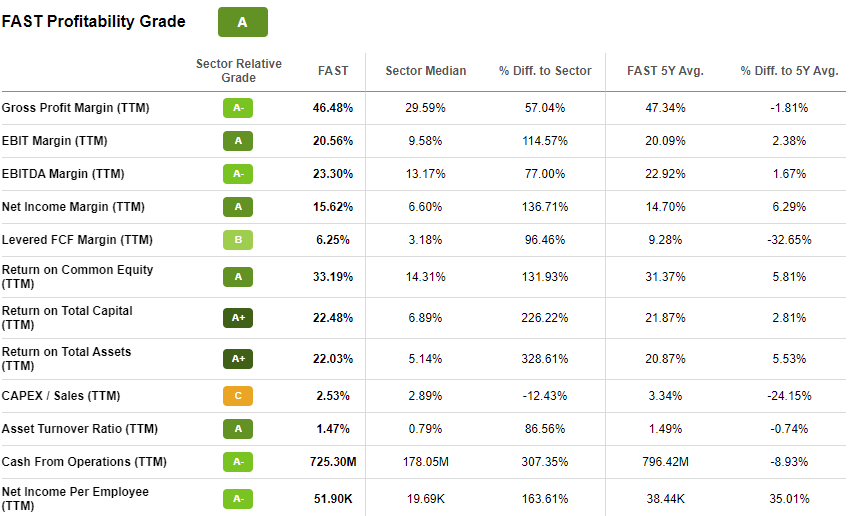
Cash flow generation also remains strong, despite recent declines in reported operating cash flows. In the current period, for example, total cash provided by operating activities was +$151M versus +$172M last year. While net income was up, increased inventory during the period required a greater use of cash. This was due to a combination of higher purchases at greater unit costs.
Q2FY22 Form 10-Q – Partial Cash Flow Statement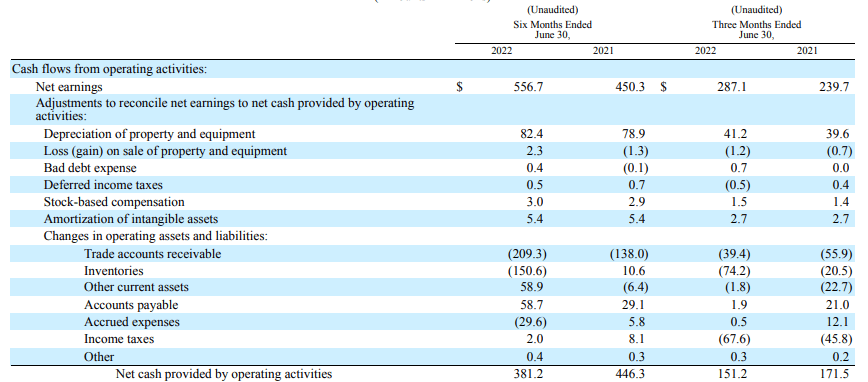
Still, free cash flow came in at over +$100M during the period. This was more than enough to cover their financing activities to end at a net cash provided position at period end.
Also, the company paid +$178.5M in dividends and repurchased +$49.3M in common stock during the quarter. Together, the total payouts represented 80% of the period’s net income.
By itself, dividends were about 60% of net income. The adequate level of coverage provides the company with the flexibility to enact continual dividend increases, with the most recent being a nearly 11% increase from 2021. With the increase, the dividend has now grown at a 5-Yr CAGR of 13.7%. For those relying on the receipt of stable income payments, FAST is unlikely to disappoint in the years ahead due to their conservative financial profile and their ability to consistently generate positive cash flows through operations.
The Takeaway
FAST experienced a nice run higher following their pandemic-era lows but are now down nearly 25% YTD and about 11% over the past one year. This lags the broader S&P YTD but is slightly better over a one-year timespan. Following a decline of approximately 6% post-earnings, shares are now down to a new 52-week low. At 26x forward earnings, the stock does not scream of a bargain. But there is some opportunity for upside, nevertheless.
Though management pointed to a softening macro environment on their earnings call, their results were still solid, with sales up double-digits, supported by both volume and favorable net pricing. Additionally, gross profit margins were largely in-tact while operating margins were actually up from prior periods.
The company’s balance sheet also remained strong through the quarter. Inventories were up but turnover improved, suggesting efficient operating performance. Growth in A/R with no material increase in allowances further supported the favorable demand environment. With limited near-term debt maturities and a strong ratio of current assets to liabilities, the company’s financial position is well-suited to weather any setbacks, should one occur.
For income-focused investors, FAST boasts of a long track record of double-digit dividend increases. At a five-year CAGR of 13.7%, new investors could quickly obtain a yield-on-cost in excess of 3% in the years ahead. Additionally, even at slower revenue growth rates in the upper single-digits, shares would be fairly valued at about $55 when applying a 10-yr discounted cash flow model using a 10.5% discount rate. While current market conditions certainly warrant extra circumspection, FAST has proved adept at navigating through challenging business conditions. As a long-term holding, the pullback, if nothing else, has presented existing shareholdings with an opportunity to average down on positions that were initiated at higher trading levels.
Be the first to comment