

AJ_Watt/E+ via Getty Images
Farmland Partners (NYSE:FPI) was one of the few REITs to post gains in share price in 2022. In fact, after opening the year at $12.07, FPI shares reached $16.29 on April 19, a run-up of 35% in less than 4 months.
Farmland Partners (FPI) share price (Seeking Alpha Premium)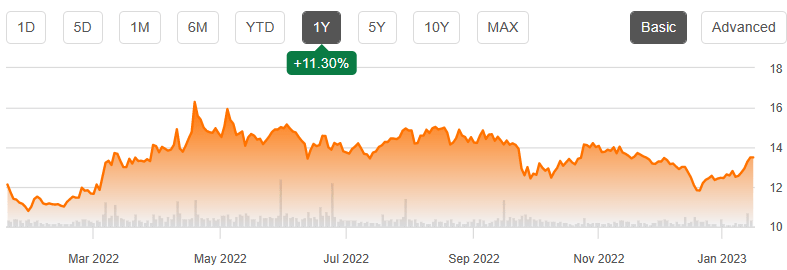
It was all downhill for the next 8 months, as FPI shares bottomed at $11.43 on December 20. Shares have been back on the rise since then, gaining 18% from the low to the current price around $13.50.
What does the future hold for this small-cap REIT?
Meet the company
Farmland Partners, Inc.
Headquartered in Denver and operating as a REIT since 2014, Farmland Partners, Inc. (FPI) buys, leases, and manages high-quality North American farmland. With 160,000 acres owned in 18 states, and 25,000 acres managed for third parties, FPI is the largest REIT owner of U.S. farm acreage (with Gladstone Land (LAND) being the only other such company). FPI has only 100 tenants producing 25 different crops, but that is good for 100% occupancy. Meanwhile, the land alone is worth $1.1 billion.
Farmland Partners investor presentation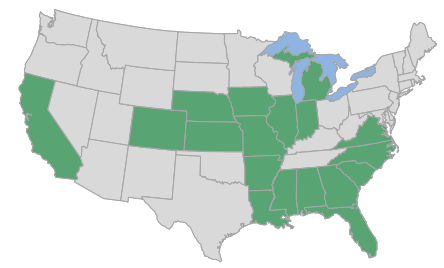
There is an estimated $2.9 trillion worth of farmland in the U.S., and publicly traded companies own less than 1% of it. Farmland is thus the largest relatively untapped category of income-producing real estate.
Farmland Partners investor presentation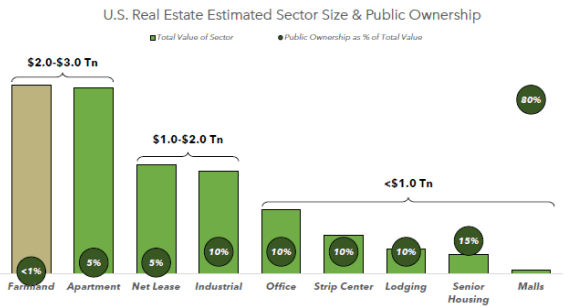
The basics of supply and demand favor increasing prices for farmland. The world population continues to grow, and the demand for food along with it, while the amount of farmland continues to shrink, as it is converted to other uses.
Farmland Partners investor presentation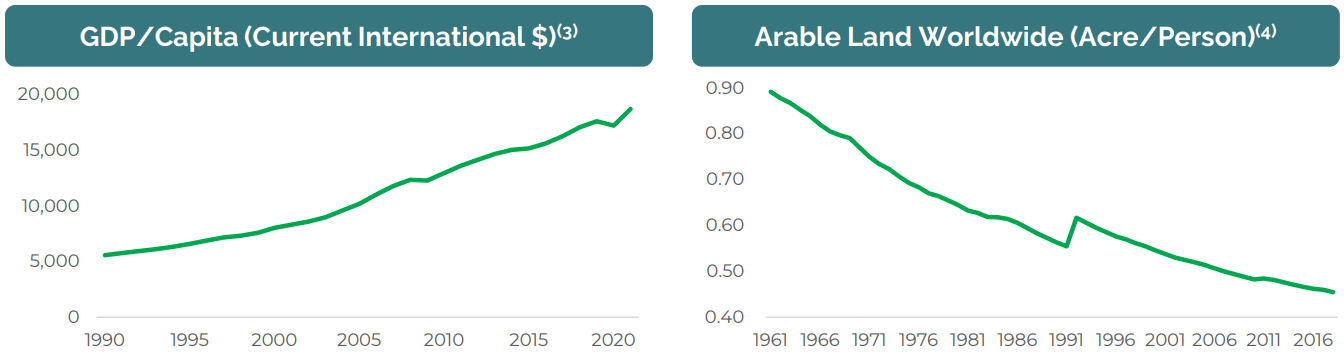
Farmland requires very little capex, and as long as the land is used according to well-established agricultural practices, it tends to be gradually more productive over time.
Management reports a pipeline of approximately $800 million in potential transactions, which includes the purchase of land and the origination of loans, but the vast majority of those land acquisitions are in preliminary stages.
Farmland Partners investor presentation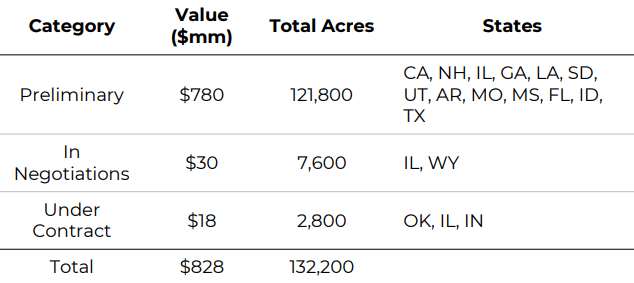
Nevertheless, FPI did acquire 12 new properties valued at $37 million in Q3 2022.
About 90%of the company’s portfolio consists of Row Crop farms, growing things like corn, soybeans, wheat, rice, and cotton. The other 10% is Permanent Crop farms, growing trees, bushes, or vines for things like nuts, fruits, and avocados.
Unlike most landlords, FPI’s cash flow is lumpy. Fixed-rent farms tend to pay the bulk of their rent before planting (usually Q1), while the low-risk Variable-Rent farms usually pay after the harvest, which happens in Q4. Cash flow for Q2 and Q3 tends to drop off sharply as a result.
Farmland Partners investor presentation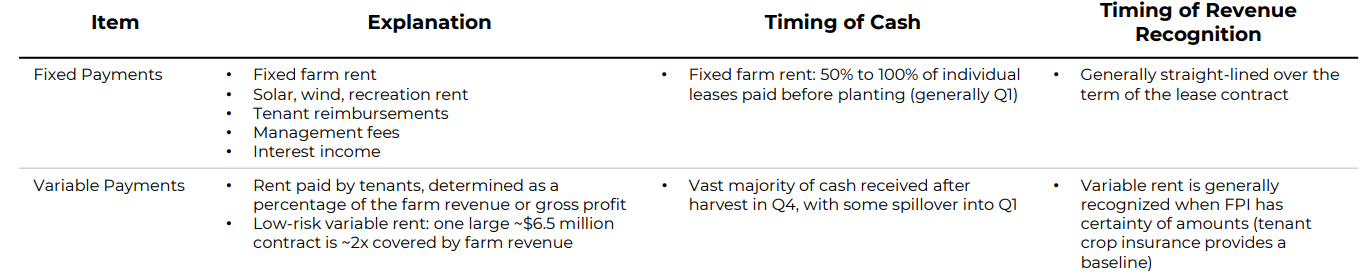
Revenue from Fixed-Rent farms nearly triples the income from Variable-Rent farms.
Farmland Partners investor presentation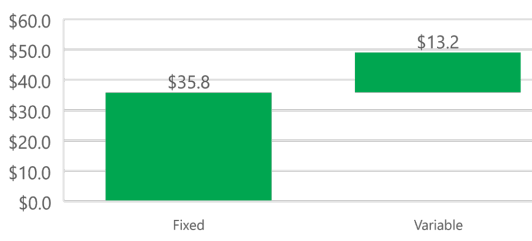
Tenant turnover is understandably low. Farmers tend to stay put.
Farmland Partners investor presentation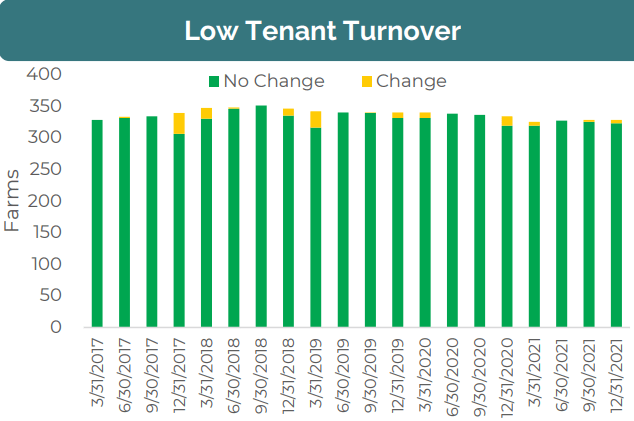
The value of the land itself is a principle reason for investing in FPI. Over the past 50 years, farmland prices have posted a CAGR (compound annual growth rate) of 5.9%, enough to exceed the rate of inflation most years.
Farmland Partners investor presentation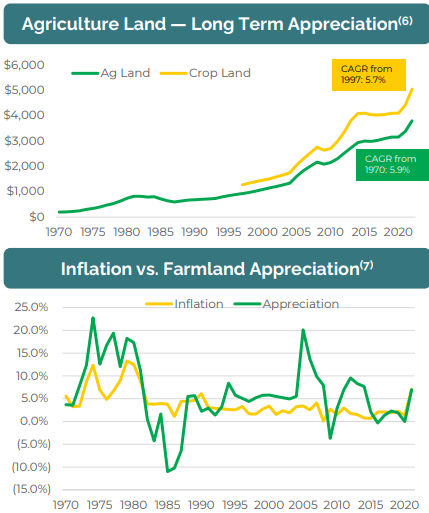
While FPI buys land solely on its value for farming, some properties lend themselves well to “higher and better uses,” such as renewable energy, in which case the land generates quite a bit more revenue. Solar farms generate about triple the revenue of crop farms, and wind turbines displace so little land that they generally just add to the revenue from the crops.
Farmland Partners investor presentation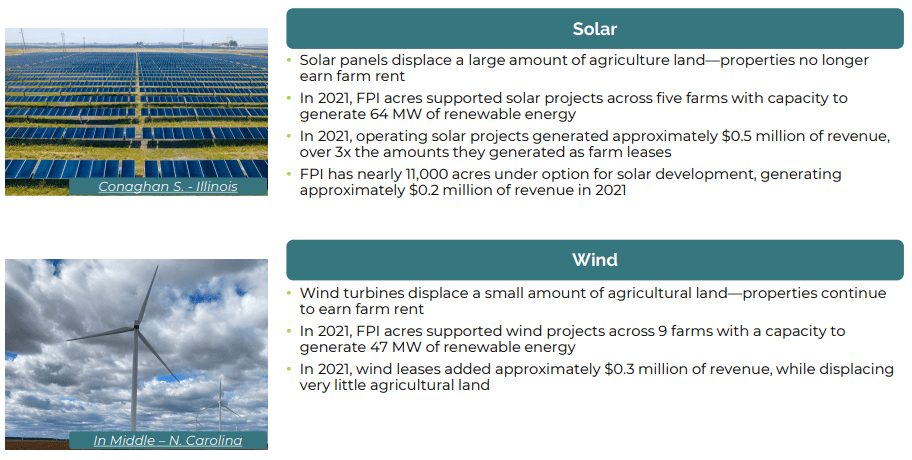
Board and management members own about 8% of the company’s shares.
Quarterly Results
YoY (Year over year), tenant rent and reimbursements were each up a modest 2.5% in Q3 2022, but revenue from crop sales boomed over 900% to $2.5 million, resulting in a 30% increase in operating revenues. Expenses held even, resulting in an increase of $3.3 million in operating income. That served to lift the company into profitability at $1.1 million, compared to the operating loss of $2.67 million in Q3 2021.
Likewise, FFO (funds from operations) came in positive, at $2.8 million, compared to (-$.65) million YoY. FFO per share came in at a nickel, compared to a loss of 9 cents YoY, and EBITDAre approximately doubled, from $3.4 million to $6.8 million.
Growth metrics
Here are the 3-year growth figures for FFO (funds from operations), TCFO (total cash from operations), and market cap.
| Metric | 2019 | 2020 | 2021 | 2022* | 3-year CAGR |
| FFO (millions) | $15.3 | $12.5 | $8.6 | $17.1 | — |
| FFO Growth % | — | (-18.3) | (-31.2) | 98.8 | 3.8% |
| FFO per share | $0.51 | $0.43 | $0.25 | $0.31 | — |
| FFO per share growth % | — | (-15.7) | (-41.9) | 24.0 | (-15.3)% |
| TCFO (millions) | $18.0 | $19.7 | $7.9 | $11.7 | — |
| TCFO Growth % | — | 9.4 | (-59.9) | 48.1 | (-13.4)% |
*Projected, based on Q3 2022 results
Source: TD Ameritrade, CompaniesMarketCap.com, and author calculations
After two years of sharp revenue decline, FPI burst into phenomenal gains this year, thanks to dramatic increases in crop revenue. Nevertheless, the 3-year CAGR figures are negative double digits. This would ordinarily signal a REIT in major trouble.
Meanwhile, here is how the stock price has done over the past 3 twelve-month periods, compared to the REIT average as represented by the Vanguard Real Estate ETF (VNQ).
| Metric | 2020 | 2021 | 2022 | 2023 | 3-yr CAGR |
| FPI share price Jan. 17 | $6.69 | $10.28 | $12.18 | $13.49 | — |
| FPI share price Gain % | — | 53.8 | 18.5 | 10.8 | 26.3% |
| VNQ share price Jan. 17 | $94.72 | $84.61 | $109.47 | $88.43 | — |
| VNQ share price Gain % | — | (-10.7) | 29.4 | (-19.2) | (-2.3)% |
Source: MarketWatch.com and author calculations
Despite the company’s horrific revenue, shares in FPI rose meteorically in 2020 and 2021, and are up another 10.8% over the past 12 months. With this company, it is definitely not about the operating results.
Balance sheet metrics
Here are the problematic balance sheet metrics.
| Company | Liquidity Ratio | Debt Ratio | Debt/EBITDA | Bond Rating |
| FPI | 2.05 | 44% | 13.0 | — |
Source: Hoya Capital Income Builder, TD Ameritrade, and author calculations
Although liquidity looks solid at 2.05x, FPI’s debt ratio of 44% and Debt/EBITDA of 13.0 are bad to atrocious. The company appears to have reached or exceeded its limit for financing acquisitions through borrowing. Further expansion will likely be financed by issuing new shares.
As of September 30, the company held $410.5 million in debt, at a low weighted average interest rate of 3.23%. Liquidity totaled $56.9 million, consisting of $8.9 million in cash and $48.0 million in undrawn funds available under its credit facility.
Dividend metrics
FPI is definitely not an appealing income proposition, especially with so many high-yield opportunities available. The paltry 1.78% yield and 2.14 dividend score are both less than half the REIT average, and the dividend growth rate of 6.3% is nothing special. So this company is not about the dividends either.
| Company | Div. Yield | 3-yr Div. Growth | Div. Score | Payout | Div. Safety |
| FPI | 1.78% | 6.3% | 2.14 | 80% | C- |
Source: Hoya Capital Income Builder, TD Ameritrade, Seeking Alpha Premium
Dividend Score projects the Yield three years from now, on shares bought today, assuming the Dividend Growth rate remains unchanged.
Valuation metrics
The price of FPI is through the roof. At 44.1x FFO ’22, it is more than double the REIT average. This type of valuation is only sustainable for REITs with phenomenal growth prospects. FPI may have such prospects, but has yet to prove it.
| Company | Div. Score | Price/FFO ’22 | Premium to NAV |
| FPI | 2.14 | 44.1 | 12.4 |
Source: Hoya Capital Income Builder, TD Ameritrade, and author calculations
Through the first 9 months of 2022 alone, FPI issued 8.6 million shares, increasing the overall share count a whopping 18%. With shares trading at a 12.4% premium to NAV, share issuance is accretive, so the company can and probably will issue all it can. For this reason, the 12.4 % premium to NAV works in the company’s favor.
What could go wrong?
The company is up to its eyeballs in debt, its dividends are pitiful compared to the average REIT, its revenues are a roller coaster, and yet its valuation is stratospheric. I smell a bubble. Sooner or later, it will pop.
Investing in FPI appears to be nothing more than rank speculation in the price of farmland, since the price is disconnected from the fundamentals. If farm prices do not climb smartly, shares in this company could plummet.
Revenues from crop harvesting play a major role in FPI’s top line, and crop prices and yields are notoriously volatile.
Investor’s bottom line
As with most small-cap REITs, FPI investors can expect quite a bit of volatility from this company. It is purely a growth play, since the dividends are meager. If this year’s surge in revenue is a portent of things to come, FPI could be a FROG in the making, but it would have to continue double-digit FFO and TCFO growth for two more years, and clean up that balance sheet, to be worthy of that title. Meanwhile, it’s a perfect company to buy low and sell high.
Currently, the revenue growth figures don’t support the stratospheric valuation. The bubble is going to pop.
If you bought shares in 2018, 2019, or 2020, chances are good that you are sitting on some handsome gains. This would be a good time to sell and take some profit.
Over the longer term, 2 to 5 years out FPI is probably a good investment, but it would be a much better investment at the more reasonable prices the nearer future likely offers.
Seeking Alpha Premium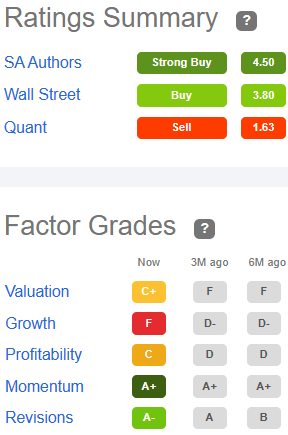
Three of the five Wall Street analysts covering the firm rate FPI a Buy or Strong Buy, with an average price target of $15.60, implying just 15.6% upside. That’s not much, for a pure growth proposition like this company.
The Seeking Alpha Quant Ratings system identifies FPI as a Sell, especially concerned about its slow growth and Price/Cash Flow ratio of 43.99. TipRanks is Neutral, and Zacks and The Street rate FPI a Hold. In other words, it’s anybody’s guess.
As always, the opinion that matters most is yours.
Be the first to comment