

Kameleon007/iStock via Getty Images
Recession predictions are coming in from seemingly every corner. Jamie Dimon, the CEO of JPMorgan Chase, said the economy could be in for a “hurricane,” while Bill Demchak, the head of PNC Financial said he sees no other possible outcome than a recession.
A recession is bad news for companies which typically see a drop in revenues due to slowing demand as well as greater difficulty in refinancing maturing debt due to tightening financial conditions.
According to Fitch, the U.S. high yield trailing 12-month default rate stood at 0.3% in Q1 – the lowest level on record dating back to 2001. Some analysts are projecting significant increases in the default rate as the Fed withdraws liquidity from the market. Deutsche Bank expects defaults to rise quickly and peak around 10% around 2025.
Deutsche Bank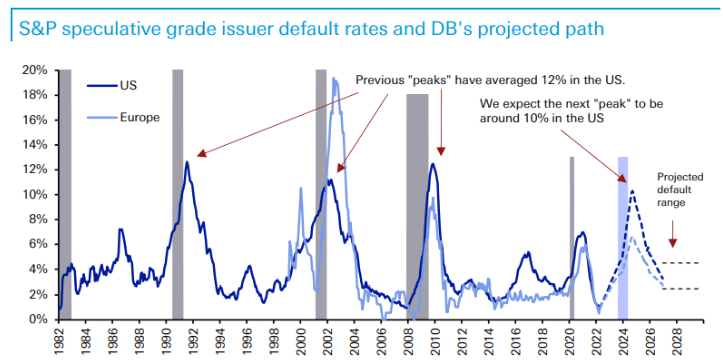
At the same time, other managers such as Guggenheim or AllianceBernstein are relatively upbeat about the sector, highlighting its decent balance sheets and strong interest coverage.
Wells Fargo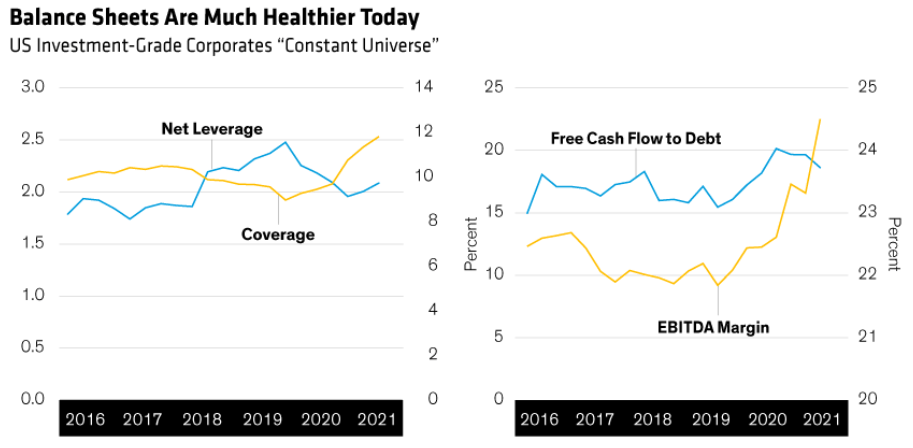
This picture is complicated further by the fact that corporate credit yields are trading at elevated levels, making the sector quite tempting to allocate to. If high-yield corporate credit yields were not trading at such attractive levels, it would be much easier to just hunker down in high-quality securities, as the opportunity cost of being in shorter-duration high-quality securities would be much less.
FRED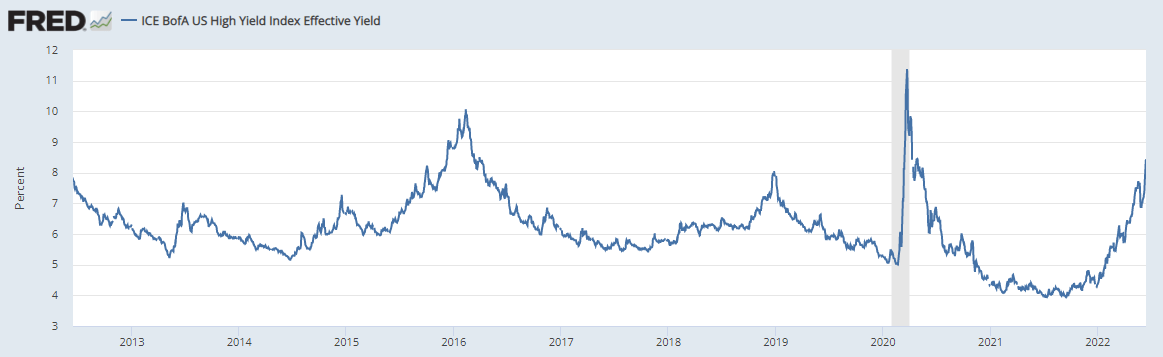
Our own view is that corporate credit is attractively valued both in absolute terms as well as relative to the broader macro environment. That said, defensive investors may want to take a more conservative approach to high-yield corporate bonds, without necessarily avoiding the space altogether.
Thankfully there are two strategies that allow investors to reduce their risk profile while enjoying most of the benefit of high high-yield corporate yields. One, that we previously have described here and here, is to shorten up the maturity profile of their bond holdings. Because the corporate credit yield curve is fairly flat, investors are not leaving a lot of yield on the table by doing so.
The second strategy that we discuss here is to rotate out of generic high-yield corporate credit exchange-traded funds (“ETFs”) (or even closed-end funds “CEFs”) and allocate to fallen angel ETFs. Fallen angels are investment-grade bonds that have been downgraded to high-yield, typically, moving from a rating of BBB (to use the S&P / Fitch notation) to BB – the highest “junk credit rating. When this happens, a large number of investors, who have investment-grade mandates, will need to shed these bonds, which further depresses their value relative to fundamentals. This allows fallen angel ETFs to buy these downgraded / technically depressed bonds and benefit from their attractive valuation relative to fundamentals.
There are two funds that pursue this strategy:
ANGL tracks the ICE US Fallen Angel High Yield 10% Constrained Index, while FALN tracks the Bloomberg US High Yield Fallen Angel 3% Capped Index. Both funds are about $3bn in size. ANGL has a 0.35% fee vs. 0.25% for FALN.
Both funds are overweight Energy and Consumer Cyclical sectors.
Systematic Income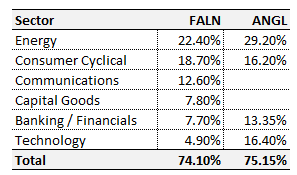
As we would expect, both funds are also overweight BB-rated bonds at about 85%. CCC-rated bonds have about a 2% allocation in both funds.
First, it should be obvious that, since the funds are overweight the highest-rung of the sub-investment-grade space, they should outperform in an environment of rising default rates. The charts below show how BB-rated bonds (right-hand chart) compared to the broader high-yield space (left-hand chart) in terms of default rates across various recessions.
Deutsche Bank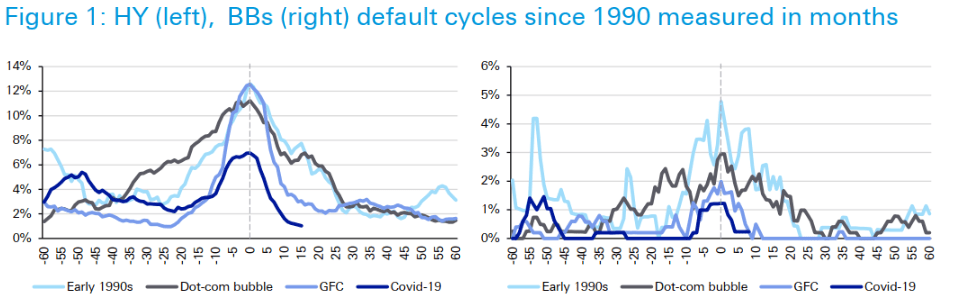
This also means that the fallen angel ETFs should outperform generic high-yield corporate bond funds in an environment of rising credit spreads. This is because credit spreads of higher-quality corporate bonds tend to widen less than those of lower quality bonds. For example, while BB-rated corporate bond credit spreads widened by 3.2% (i.e. 3.3% to 6.5%) in March of 2020, B-rated bond credit spreads widened by close to 4% over the same period. This translated to roughly a 5% outperformance over this period for BB-rated bonds over B-rated bonds.
Two, these funds have a higher duration profile than the broader high-yield bond space. This is because investment-grade bonds (which fallen angels used to be) are typically issued with longer maturities, no call dates and lower coupons – three factors which lengthen their duration profile relative to the broader high-yield space. For example, FALN and ANGL have durations of 5.5-5.8 while the two generic high-yield corporate bond ETF benchmarks JNK and HYG have durations of around 4.3. What this means is that ANGL and FALN will tend to underperform in a period of rising Treasury yields, all else equal, and vice-versa.
In our view, a longer duration profile is an attractive feature for investors worried about a recession. This is because Treasury yields tend to fall during recessions, which should also allow FALN and ANGL to outperform the broader high-yield bond market.
Finally, if a recession does materialize, we should expect a wave of downgrades from BBB-rated to BB-rated bonds. What’s particularly interesting about the current situation is that BBB-rated bonds now account for a record 57% of the investment-grade sector – up from 40% in the last 15 years. This is the kind of environment that fallen angel funds benefit from.
Let’s take a look at how the two funds compare to their generic high-yield corporate bond ETF counterparts, iShares iBoxx $ High Yield Corporate Bond ETF (HYG) and SPDR Bloomberg Barclays High Yield Bond ETF (JNK). The chart below plots total annual returns across the four funds.
Systematic Income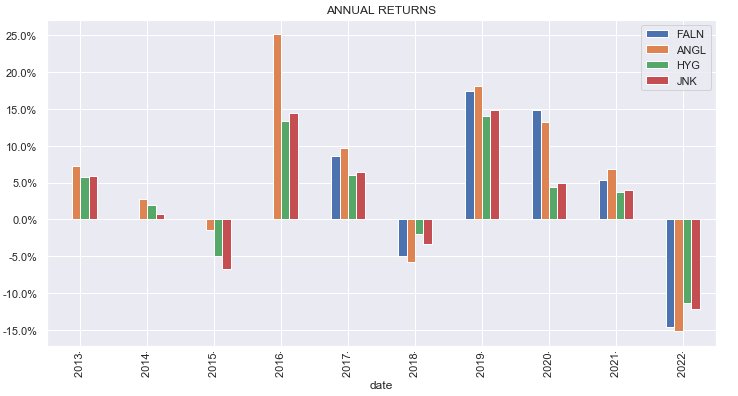
The chart shows three interesting things. First, the fallen angel funds FALN and ANGL tend to outperform their generic counterparts JNK and HYG (more obvious in the chart below).
Two, they outperform hugely in periods of significant downgrades. Specifically, the chart below shows that 2015 (energy, natural resources) and 2020 (retail, leisure, transportation, energy) had huge spikes in fallen angels. This has happened towards the back end of 2015 and around Q1/Q2 of 2020 which lines up nicely with the chart above showing that 2016 and 2020 were great years for the fallen angel funds.
AB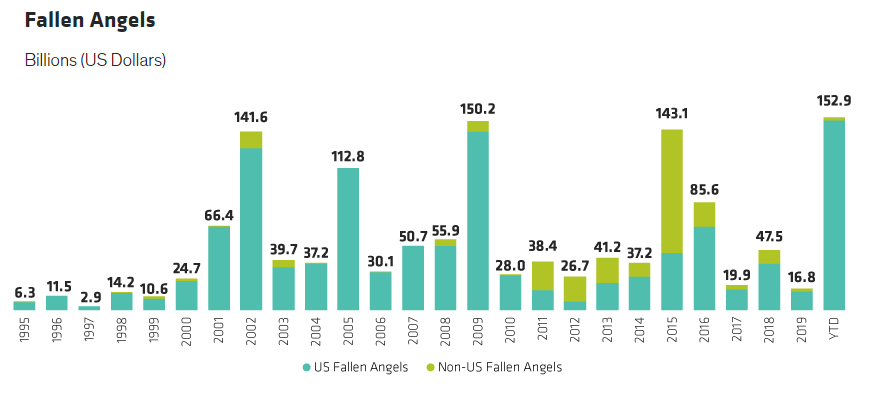
Three, fallen angel funds have tended to struggle in periods of rising rates such as in 2018 and this year. As discussed above this is due to their longer duration profile which is a benefit in a recessionary scenario.
If we try to gauge the performance of the fallen angel ETFs, we see that they have significantly outperformed their generic counterparts. The chart below goes as far back as data is available for all four funds.
Systematic Income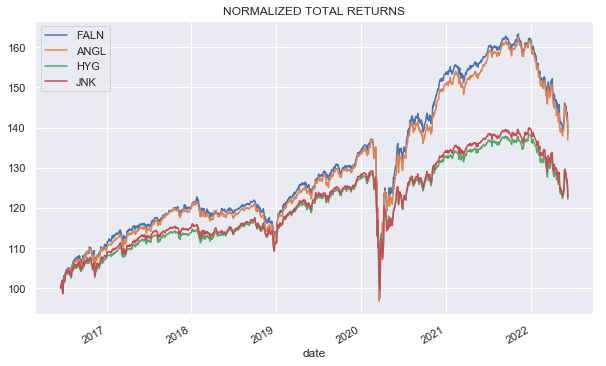
This chart makes it more clear that the fallen angel funds have outperformed the generics by about 2% per annum since mid-2016.
Systematic Income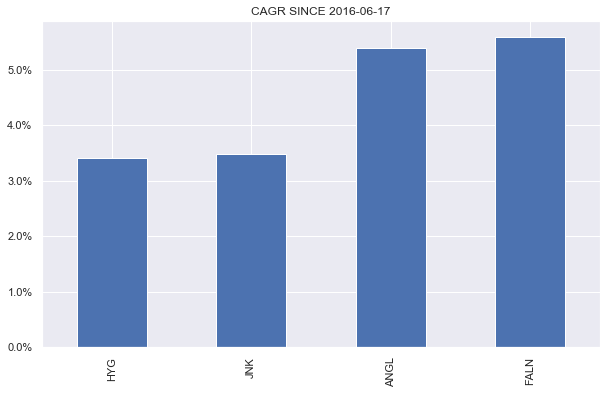
In fact, they have even outperformed the average High-Yield Corporate Bond CEF over various time periods despite using no leverage or having no active management and by a significant margin at that. The following table is from our sector Funds Tool.
Systematic Income Fund Tool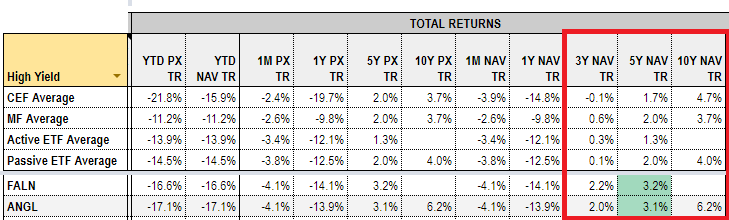
It may seem like investors who opt for a fallen angel fund over a generic high-yield one are leaving yield on the table. And it’s true that the generic ETFs are trading at portfolio yields around 1% above that of the fallen angel funds (keep in mind portfolio yields are better indicators of their underlying yield generation rather than their distribution yields which can be all over the place). JNK and FALN portfolio yield screenshots are shown below.
SPDR BlackRock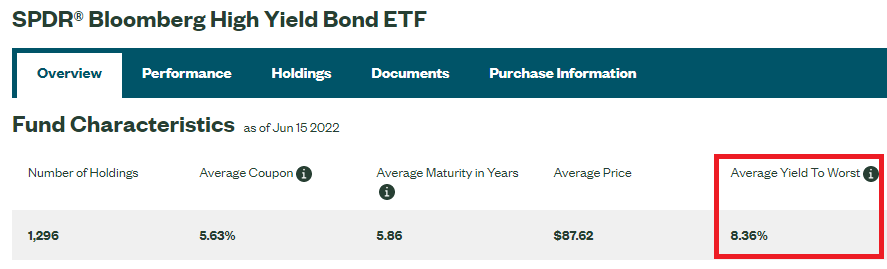
However, it’s important to adjust these yields for the higher default rates of the generic funds. For instance, while 3-year cumulative default rates for BB-rated bonds is 3.4%, it is nearly 3x as high for the broader high-yield market at 9.9%. Once we take this into account, the post-default yields are roughly similar. And obviously, the proof is in the pudding that the fallen angel funds have fairly consistently outperformed their generic counterparts so their lower portfolio yields don’t stay in the way of outperformance.
Takeaways
High-yield corporate bonds are finally living up to their name as yields are trading at the higher end of their range over the past decade. However, as recession estimates are creeping up, more conservative investors may want to participate in the sector in a more defensive way. For these investors, fallen angel funds can fit the bill.
These funds tend to stick to the higher-quality range of the high-yield bond market and can prove more defensive in a weak market environment. They can also deliver potential alpha gains if we see an increase in downgrades in case the macro picture worsens in the medium term. We have recently rotated into FALN in our Defensive Income Portfolio for these reasons.
Be the first to comment