

damedeeso/iStock via Getty Images
Investment Thesis
This article will take a look at Guggenheim Strategic Opportunities Fund (NYSE:GOF). I last looked at GOF back in March of 2021. While the yield was attractive, I was concerned about the sustainability of the distribution and the erosion of NAV. While the yield is even better now, NAV continues to erode, and I am still very concerned about the distribution sustainability. Let’s work through why, despite a long history of declining NAV but no distribution cut, I remain worried about the distribution.
What I look for in a closed-end fund (“CEF”) is a predictable flow of income. To find such funds, I have developed a method of determining if a specific CEF has been providing such an income stream. I developed my method starting with the process outlined in this article. My thinking is that rather than the share price or even the NAV, how the portfolio of the fund generates income from its assets and whether or not it is building or eroding its asset base are the determining factors in the reliability of the distribution.
I take the view that the fund’s NAV is the muscle that it uses to generate cash. So while it can be bad if the fund is eroding NAV (think muscle atrophy), it is the fund’s ability to generate cash that is the true value.
Based on that view and my analysis method, I determine if the fund has been supporting the distribution. Next, based on current holdings and past performance, I try to determine whether or not the fund will be able to support the distribution in the future. You can read a full explanation of my method and get links to the other articles in the series (published before March 27, 2022) here.
Guggenheim Strategic Opportunities Fund
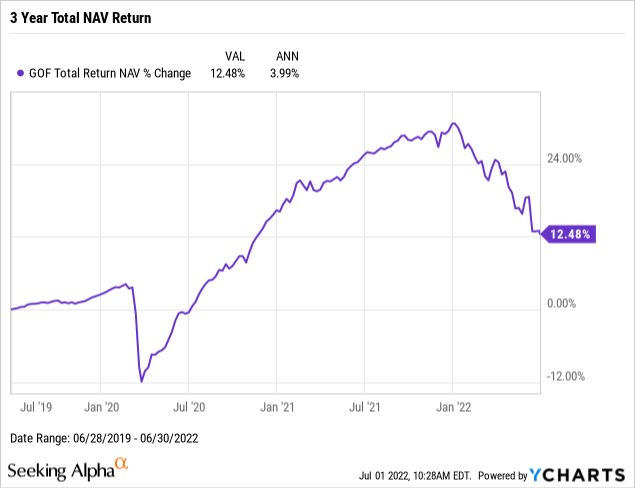
The first step in my evaluation process is to determine how a fund’s portfolio has done over the last year. I do that by looking at the fund’s Total NAV Return. This metric is important because the portfolio returns put a cap on what the fund can support paying to its shareholders.
So how did GOF’s portfolio do over the last 12 months?
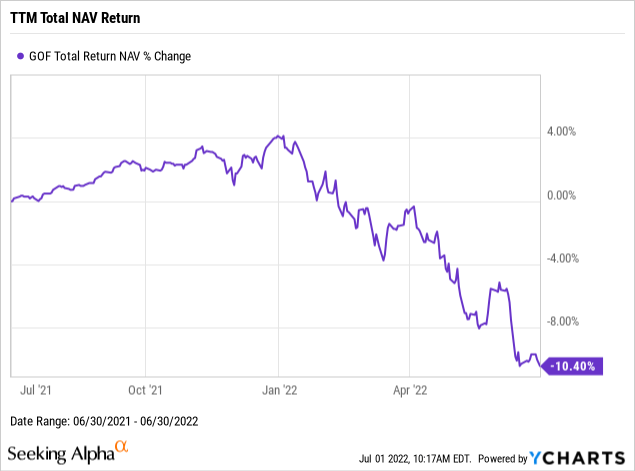
It certainly appears that the portfolio held by GOF didn’t do so well over the last 12 months. While it might not be all bad that the portfolio, including dividends paid to the fund’s shareholders, decreased in value, it is certainly less good than if it had experienced gains. And a return for the portfolio that exceeds a 10% loss in just a year is a bad sign. So while we won’t have to do the math to determine if the total NAV return exceeded the total yield on NAV (since the return was negative it exceeds to positive yield), let’s step through the rest of the metrics and analysis just to see where the fund is.
How did just the NAV do (don’t expect a surprise increase here)?
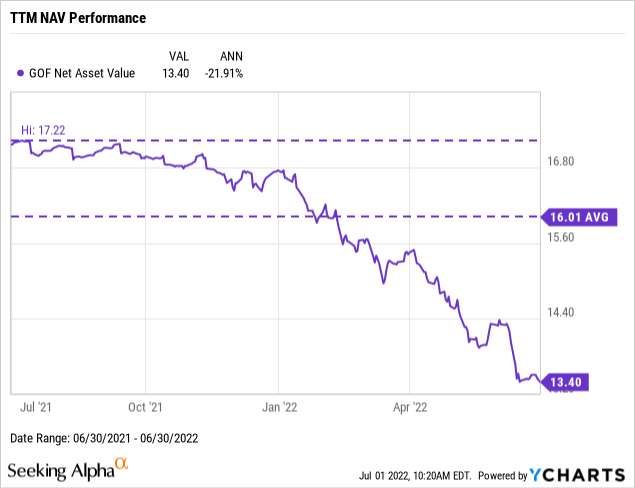
And as expected, we see that the NAV (the per-share market value of GOF’s portfolio) also declined, by nearly 22%. I don’t want to say that this is automatically bad for the fund and its shareholders. Because the decline in NAV potentially presents some opportunities that might not be there had the NAV increased. But I think we can all agree that a decline here is less good than an increase. And while a decline in NAV increases the chance that the fund is overpaying its distribution, it isn’t conclusive proof that it is doing so.
So, in our quest to determine if the fund is covering its distribution, let’s look at the last 12 months of distributions and the sources they came from.
I get a lot of data on CEF performance from CEFData. Let’s look at the distributions.
TTM GOF Distributions And their source (CEFData)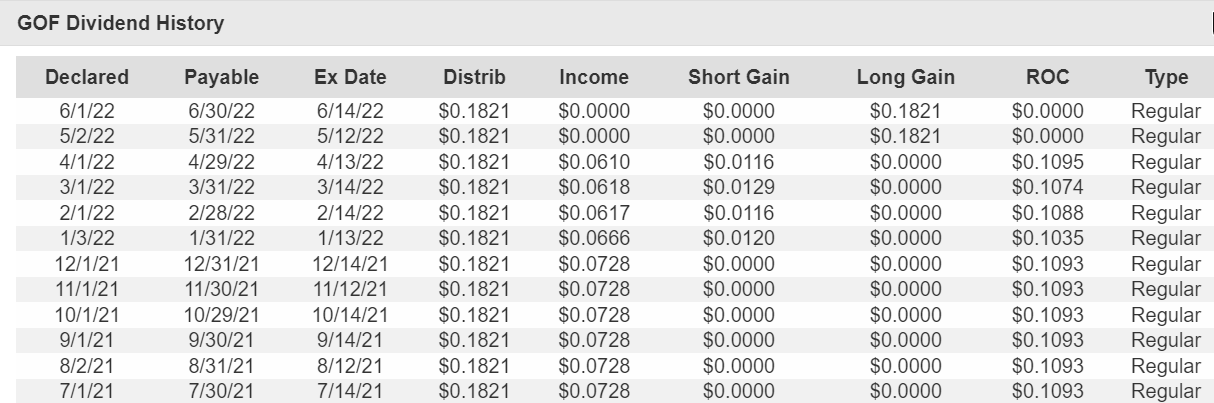
The good news is that the distributions haven’t been cut. However, we see that the source of some of the distribution was ROC. This means that the distribution exceeded taxable income. If the NAV were increasing, this wouldn’t be a problem, but with NAV declining, there is a potential problem here. Let’s look and see how various benchmarks are doing. That will enable us to see if the decline in GOF’s portfolio might be due to a general decline in asset prices.
Guggenheim doesn’t provide a benchmark for GOF, but about a third of its portfolio is invested in high-yield bonds and another third is invested in senior loans. SPDR Bloomberg High Yield ETF (JNK) is a good benchmark for high-yield bonds. Invesco Senior Loan ETF (BKLN) is a good benchmark for senior loans.
How did GOF’s portfolio do so far this year compared to these benchmarks?
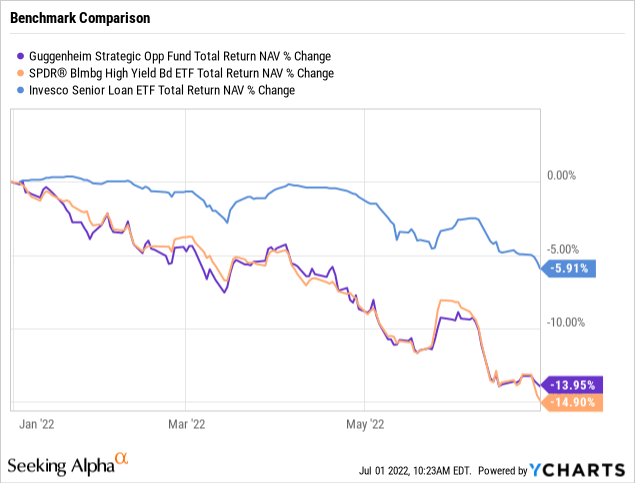
GOF did much poorer than BKLN and was comparable to JNK. That tells me that, at best, GOF is struggling to cover its distribution.
Long-Term Trends
Luck and timing can always impact performance. But it isn’t a good idea to count on luck working for you when you project future performance. Over a single year, luck and timing can make a big difference, but over longer periods their impact diminishes. I like to look at 3 years, as I see this as offering a good balance between being long enough to reduce the impact of atypical events and yet recent enough to reflect current management and conditions.
So how did GOF and its portfolio do over the last 3 years?
Okay, GOF has done much better over the last 3 years than it has done in the last year. Having a positive total NAV return means we will need to do some math to determine distribution coverage.
So, how did the NAV hold up over the last 3 years?
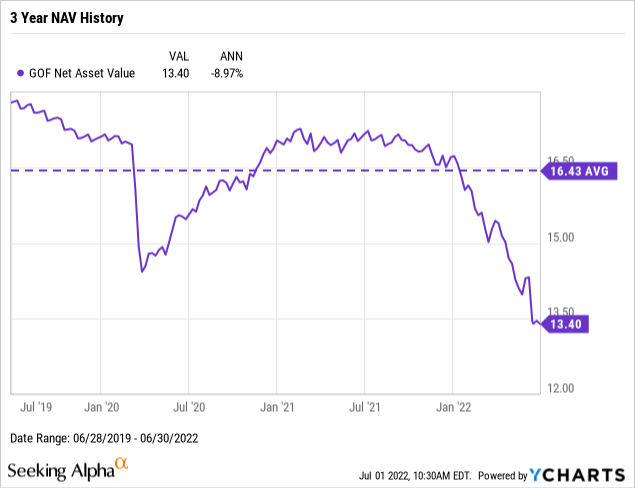
Not so good. It has been down an average of 8.97% a year. That could mean that GOF wasn’t covering its distribution. We will have to dig into the data a bit further to determine that.
While the outcome is obvious, let’s do the math, so we can see just how out of line the distribution is. Over the last 3 years, GOF has paid out $6.5556 in distributions. Based on the average NAV over that time of $16.43, that is a total yield on NAV (not an annualized number) of 39.90% or 13.30% on average per year. That exceeds the total return on NAV of 12.48% (for the whole 3-year period) or just 3.99% CAGR. The distribution has clearly not been covered for the last 3 years.
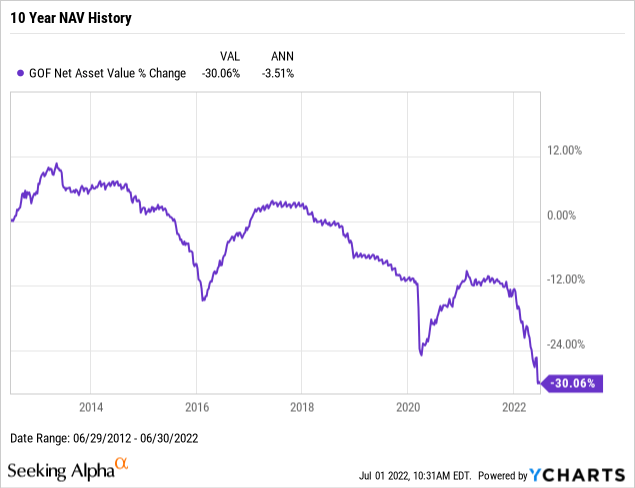
And as we can see, looking at the last 10 years of NAV history, a declining NAV is not recent for GOF. The downward NAV trend started in 2015. The average yearly decline has been just over 3.5%.
Next, let’s see how the distributions changed over the years.
GOF Distributions (CEFData)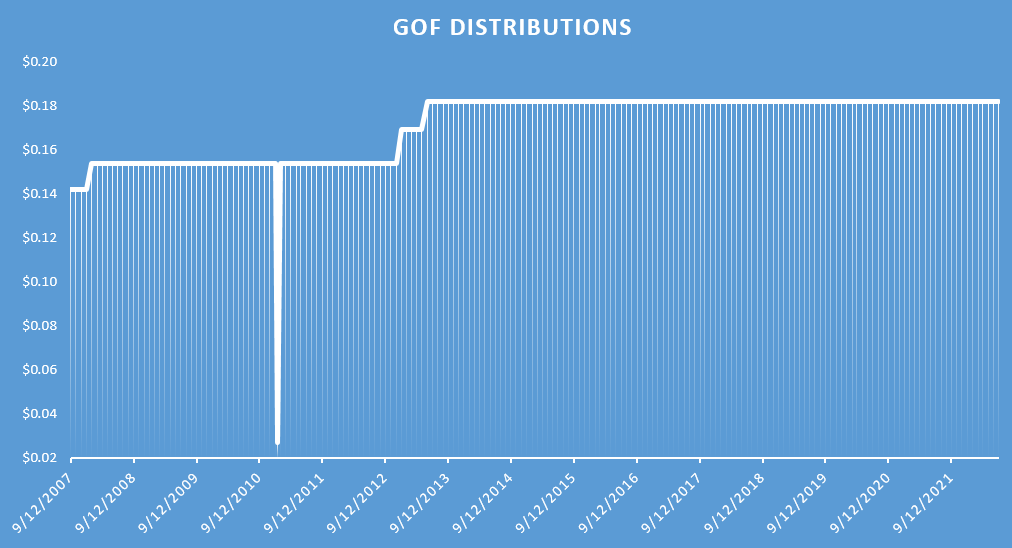
The one apparent drop in distributions (in December 2010) was actually a special distribution. Looking at the distribution trend, I see evidence that in the past anyway that GOF has been able to support and even increase its distribution. This is a good sign that even if it isn’t covering it now, it could return to doing so.
The fund has, however, not increased its distribution in some time. The last increase was before NAV started declining in 2014. So, in looking to the future, we will look for signs that this trend has been reversed.
Future Distribution Coverage
Over the last few years, GOF has not fully covered its distribution. But so far that hasn’t resulted in a distribution cut. The question for income investors is, will it be able to sustain its distribution, or will its NAV erosion force a distribution cut? So let’s look at the portfolio and see if we can identify any way for things to turn around. I’ll pull some data from the fund’s website.
GOF Portfolio Concentrations (GOF Website)
Bank loans and high yield bonds have both declined by about 600 bps from last year. Leverage is also down, and cash is up significantly. This looks like the fund has positioned itself for a declining market, and has cash (and leverage) to buy in after the bottom. But much like last year, I don’t see anything that will be a big change from the last 5 years. But that could change if they manage to catch the wave when the markets eventually turn around.
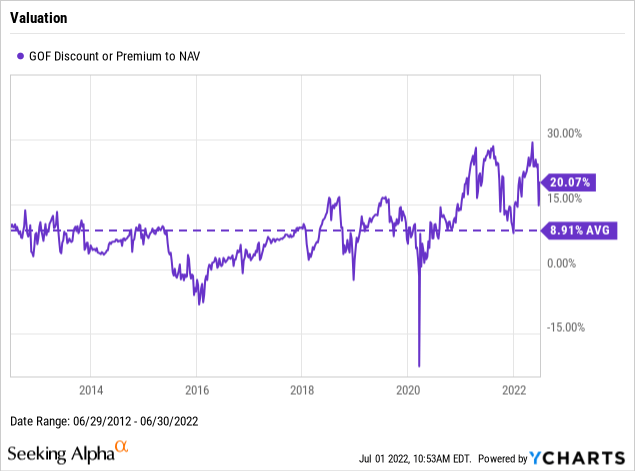
Currently, the premium to NAV is well over its 10-year average of 8.9%.
Conclusion
There could be an argument that with a yield over 13% and no signs of any change to the distribution, that GOF might be a good buy. However, the distribution isn’t fully supported and so is always at risk. And there is no certainty that we would get any advanced warning of a distribution cut. So with the premium to NAV being over twice the 10-year average, I just don’t see that GOF is a good value here.
Be the first to comment