

Euro, EUR/USD, EUR/JPY Talking Points:
Last week was a big outing for the Euro, but not really because anything to do with the Euro-zone, at least not directly.
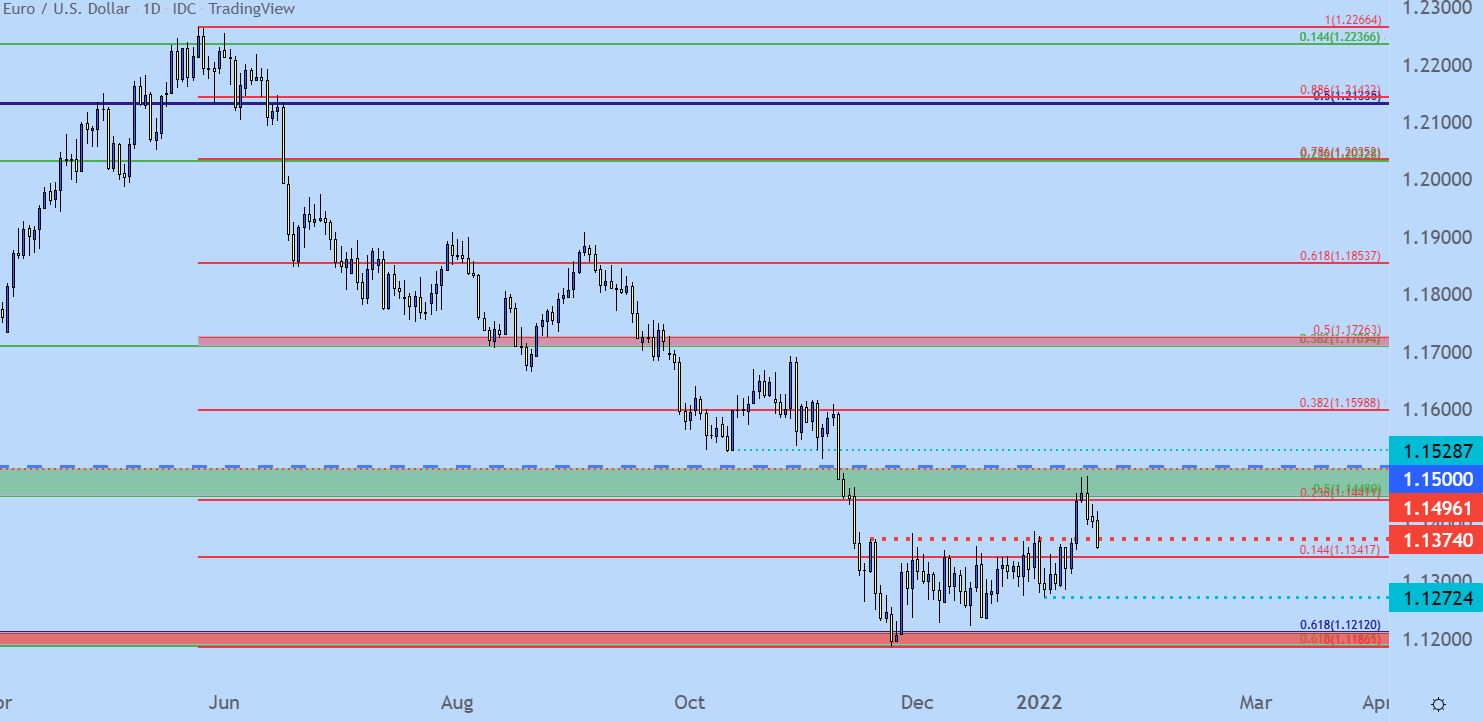
The US dollar broke down to a fresh two-month-low, helping EUR/USD to run up to a fresh two-month-high. This move filled-in the ascending triangle formation that I had looked at last week in the pair. And, also as highlighted, prices moved directly into the next zone of resistance running from 1.1448-1.1500. The latter of those prices is a major psychological level while the former is a longer-term Fibonacci retracement level.
That zone cauterized the highs on Thursday and that led into a sell-off on Friday that alluded to bears’ reaction at this very key spot on the chart. The next major price to watch is already in-play, taken from the 1.1374 level that had previously marked resistance in the ascending triangle. A support hold in this vicinity keeps the door open for possible topside continuation scenarios, driven by the premise of higher-low support following a short-term higher-high that printed last week.
The key here is the daily close. If the daily EUR/USD bar finishes with a wick-test through 1.1374, that could register as that higher-low support. And that leads in to a somewhat critical data release of the Euro-zone later this week with the issuance of December inflation data, set to take place on Thursday morning.
EUR/USD Daily Price Chart
Chart prepared by James Stanley; EURUSD on Tradingview
EUR/USD Shorter-Term – Levels
The 1.1374 level is key with the daily bar, but if buyers can’t hold the low above this level by the end of the day, bearish trend resumption strategies will look considerably more attractive. And – for those looking at Euro-strength scenarios, there may be another avenue that I’ll look at a little later.
But – if 1.1374 can’t hold the lows, another key level shows around 100 pips lower, at 1.1272, which was the higher-low that printed just ahead of the breakout setup. And below that, from 1.1187-1.1212 is the support zone that started all of this, coming into play in late-November to finally quell that EUR/USD sell-off that was so prominent for the six months prior.
EUR/USD Four-Hour Price Chart
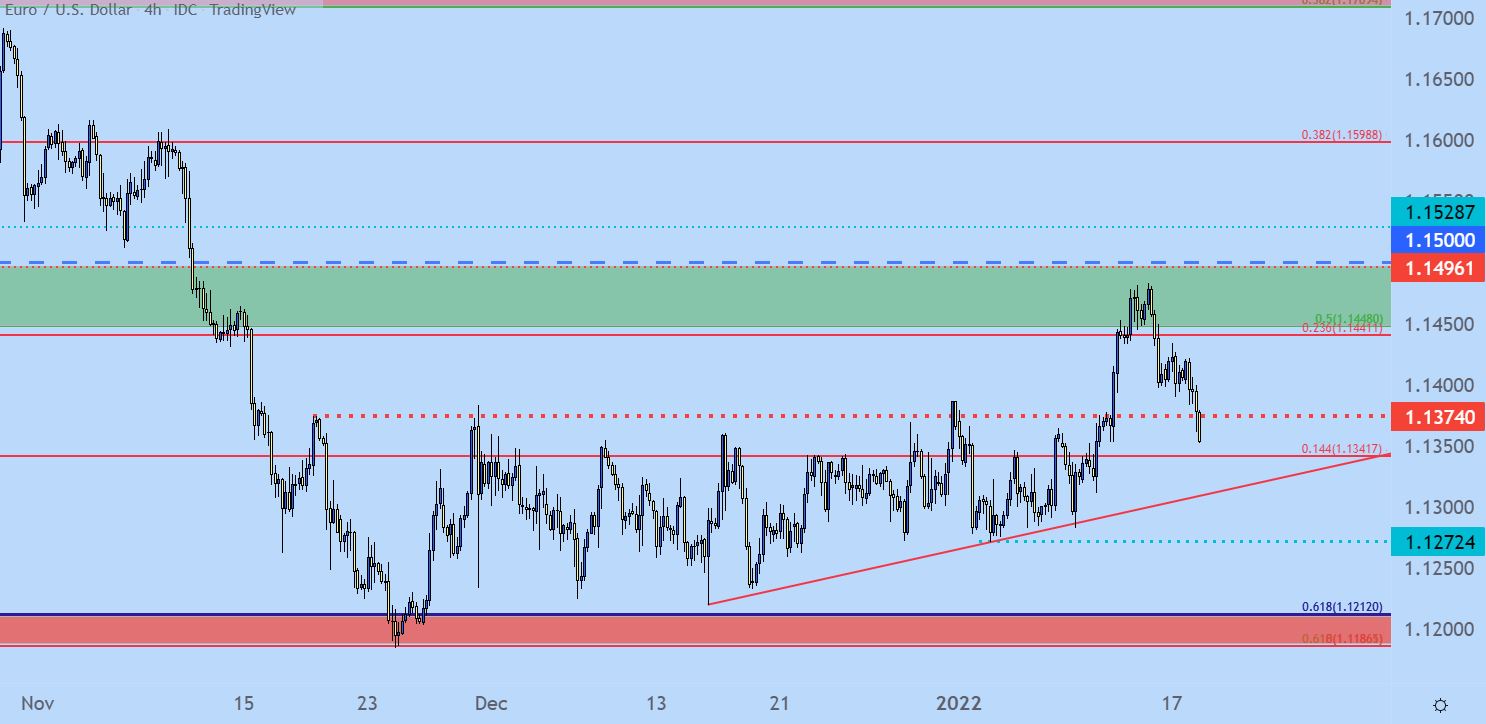
Chart prepared by James Stanley; EURUSD on Tradingview
EUR/JPY Nears Key Support
For those that are bullish on the Euro but want to side-step the US Dollar, EUR/JPY may remain of interest. The pair is closing in on a key support level around the 130.00 big figure, and this is confluent with the 23.6% Fibonacci retracement of the 2020-2021 major move, plotting at 129.47.
Similar to the above, the daily close is what’s key here as that can highlight bullish defense of the big fig provided that today’s close prints above the 130.00 level, and that can keep the door open for bullish scenarios in the pair ahead of that Thursday release of Euro-zone inflation data.
EUR/JPY Weekly Price Chart
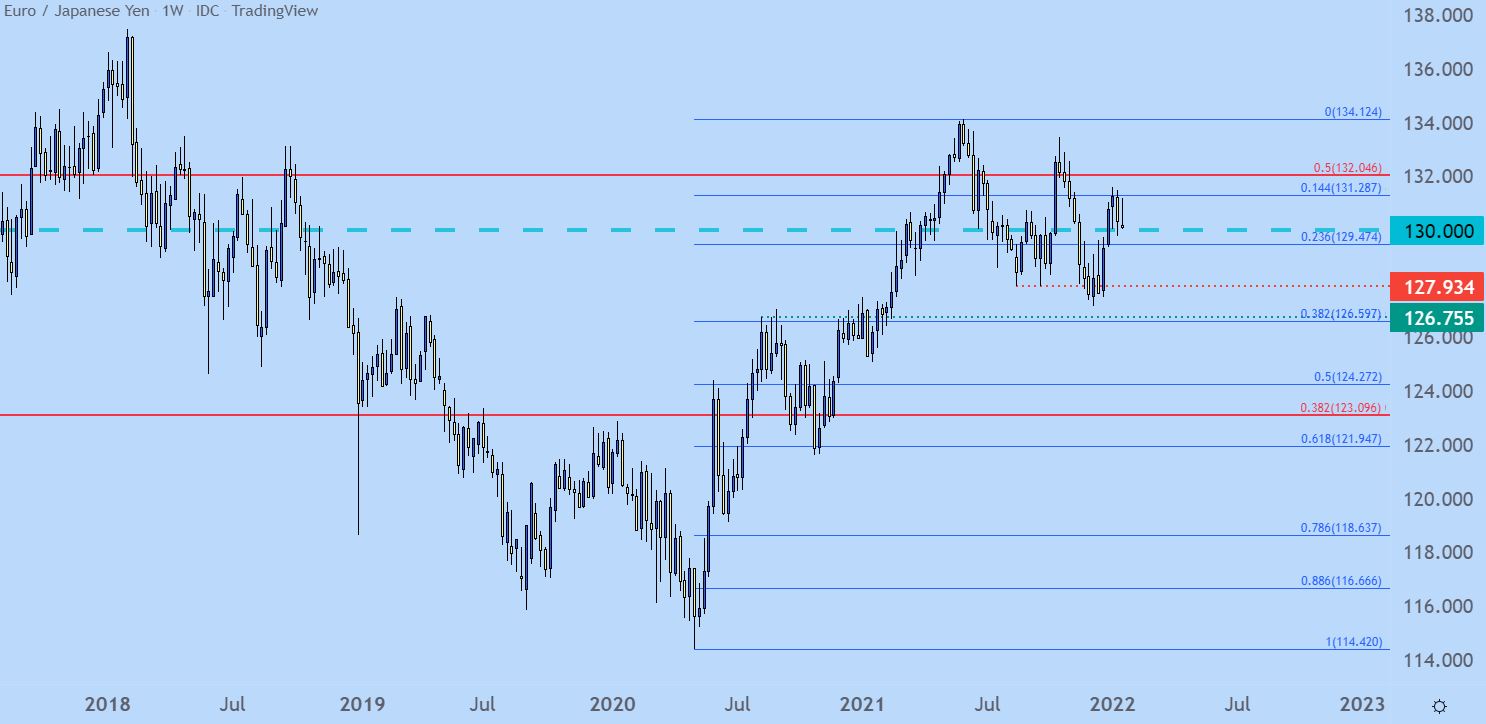
Chart prepared by James Stanley; EURJPY on Tradingview
— Written by James Stanley, Senior Strategist for DailyFX.com
Contact and follow James on Twitter: @JStanleyFX
Be the first to comment