

- EUR vs USD pauses uptrend move
- Signals and thresholds to keep in focus
EUR/USD – Bulls Still in charge
On Friday, Euro Fell against the greenback to 1.1055. The price rallied after and settled above 1.1100 handle, then closed the weekly candlestick in the red with 1.6% loss.
That said, the Relative Strength Index (RSI) remained above 50 indicating that uptrend move was still intact.
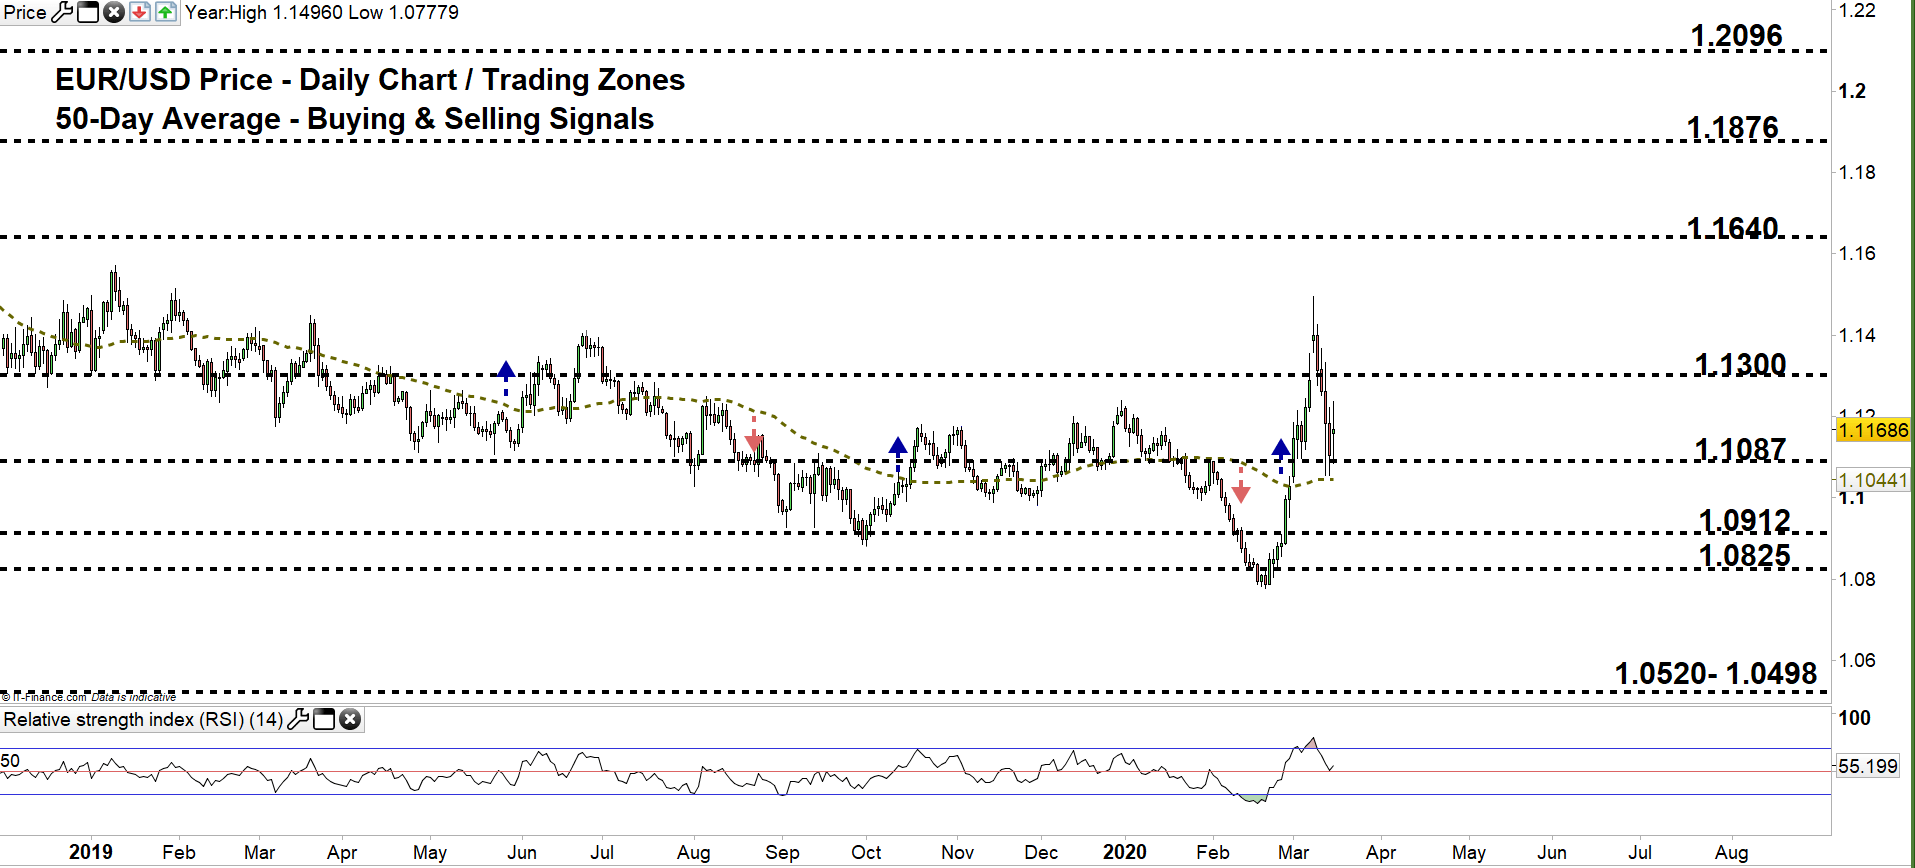
EUR/USD Daily Price CHART (JULY 1, 2018 – Mar 16, 2020) Zoomed Out

Recommended by Mahmoud Alkudsi
Building Confidence in Trading
EUR/USD Daily Price CHART (Sep 25 – Mar 16, 2020) Zoomed in

Looking at the daily chart, we noticed that at the start of last week, EUR/USD opened with a runaway gap to the upside highlighting unfinished uptrend move. On Wednesday, the market declined to current trading zone 1.1087 – 1.1300. Later on, the price have failed twice to fall further, signaling a possible bull’s comeback.
Hence, a close above the high end of the zone could push EURUSD towards 1.1640. Further close above that level may send the pair even higher towards 1.1876. In that scenario, special attention should be paid to the daily and weekly resistance levels underlined on the chart (zoomed in) as some traders may exit/join the market around these points.
In turn, any close below the low end reflects bull’s reluctance. This might lead some of them to exit the market allowing the price tow fall eyeing a test of 1.0912. Further close below this level could mean more bearishness towards1.0825. Nevertheless, the weekly support levels printed on the chart should be considered.

Recommended by Mahmoud Alkudsi
Traits of Successful Traders
EUR/USD four Hour Price CHART (Jan 29 – Mar 16 2020)

From the four-hour chart, we noticed that on Monday uptrend move led EUR/USD to 1.1496 – its highest level in over thirteen months. In the following days, the price reversed its move creating lower highs with lower lows.
Thus, a break below 1.1050 could lead EURUSD towards 1.0959. Yet, the weekly support level underscored on the chart should be kept in focus. On the other hand, any break above 1.1371 might cause a rally towards 1.1553. Although, the daily resistance level printed on the chart should be watched closely.
See the chart to know more about key technical levels in a further bullish/bearish scenario.

Recommended by Mahmoud Alkudsi
Improve your trading with IG Client Sentiment Data
Written By: Mahmoud Alkudsi
Please feel free to contact me on Twitter: @Malkudsi
Be the first to comment