

EUR/USD started a fresh decline from well above 1.1450. USD/JPY is attempting recovery and facing a strong resistance near 115.80.
Important Takeaways for EUR/USD and USD/JPY
· The Euro started a fresh decline after there was no close above the 1.1480 level.
· There is a key bearish trend line forming with resistance near 1.1350 on the hourly chart of EUR/USD.
· USD/JPY started a recovery wave after it found support near the 115.00 zone.
· There is a major bearish trend line forming with resistance near 115.80 on the hourly chart.
EUR/USD Technical Analysis
This past week, the Euro failed to clear the 1.1480 zone against the US Dollar. The EUR/USD pair started a fresh decline and traded below the 1.1420 support zone.
The pair even broke the 1.1350 level and settled below the 50 hourly simple moving average. A low was formed near 1.1280 on FXOpen and the pair is now correcting higher. There was a move above the 50% Fib retracement level of the recent decline from the 1.1417 swing high to 1.1280 low.
An immediate resistance on the upside is near the 1.1350 level. There is also a key bearish trend line forming with resistance near 1.1350 on the hourly chart of EUR/USD.
The trend line is near the 61.8% Fib retracement level of the recent decline from the 1.1417 swing high to 1.1280 low. The next major resistance is near the 1.1380 level. The main resistance is near the 1.1420 level.
If there is no break above 1.1350, the pair might start a fresh decline. An immediate support is near the 1.1320 and the 50 hourly simple moving average. The next major support is near 1.1280, below which the pair could drop to 1.1225 in the near term.
USD/JPY Technical Analysis
The US Dollar also struggled to gain momentum above a key resistance near 116.20 against the Japanese Yen. The USD/JPY pair started a major decline below the 115.50 pivot level.
The pair traded below the 115.20 support zone the 50 hourly simple moving average. It traded as low as 115.01 and is currently recovering losses. There was a move above the 50% Fib retracement level of the key decline from the 116.33 swing high to 115.01 low.
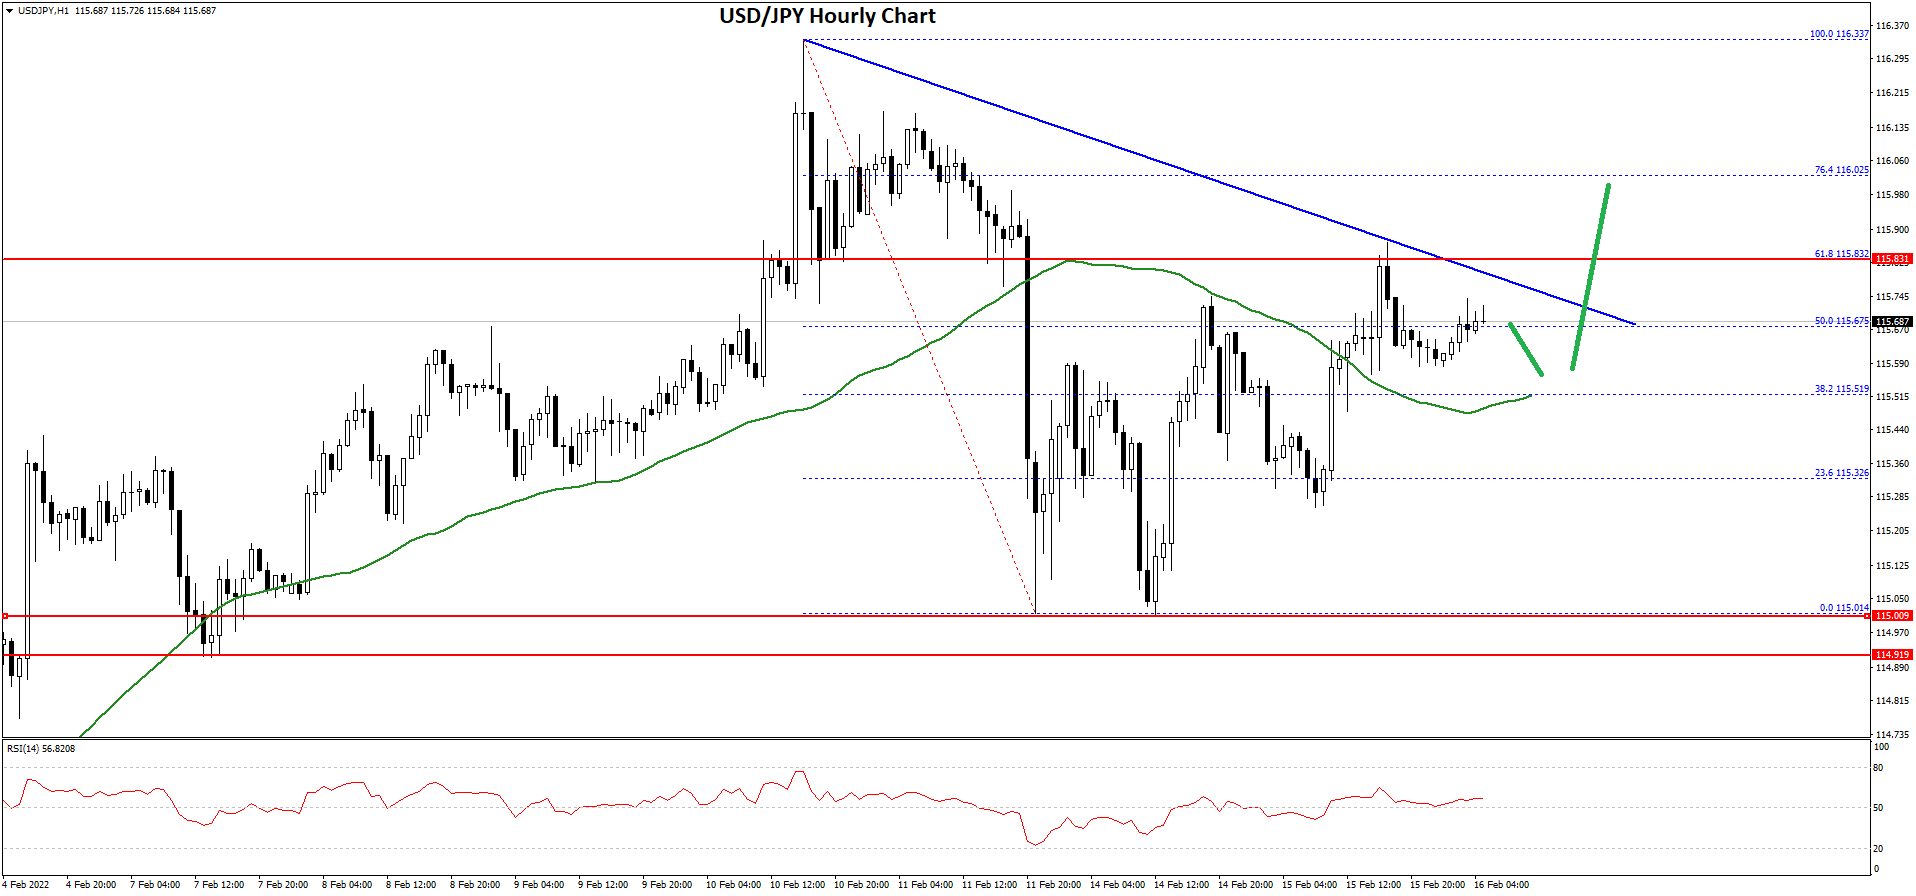
On the upside, an initial resistance is near the 115.80 level. Besides, there is a major bearish trend line forming with resistance near 115.80 on the hourly chart.
The trend line is near the 61.8% Fib retracement level of the key decline from the 116.33 swing high to 115.01 low. The next major resistance is near the 116.00. Any more gains could send the pair towards the 115.20 level. The next key hurdle is near the 116.50 level.
If not, it could resume its decline below 115.50. The next major support is near the 115.10 level or the recent low. A clear move below the 115.00 level may perhaps spark a major decline.
The next major support is near the 114.20 level. Any more downsides might lead the pair towards the 114.00 support zone, below which the bears might aim a test of the 112.50 support zone in the near term.
This forecast represents FXOpen Markets Limited opinion only, it should not be construed as an offer, invitation or recommendation in respect to FXOpen Markets Limited products and services or as financial advice.

Be the first to comment