

EUR/CHF, AUD/NZD Analysis and News
- EUR/CHF Approaching Soft Line in the Sand
- Eyes on SNB Intervention Around 1.0700
- RBNZ to Begin Hiking Cycle
EUR/CHF Approaching Soft Line in the Sand
Once again, EUR/CHF has grabbed my attention, and while I must admit, the cross is not usually the most exciting. It is, however, back within proximity to the soft line in the sand at 1.0700. This is a level I spoke about previously, given that this had been the area where weekly Swiss sight deposits grew, suggesting a pick-up in SNB FX intervention. In turn, this may be an area at which the current slide in EUR/CHF is halted with current shorts likely to take cover.
As evidenced by the correlation matrix below (Figure 1), the price action in EUR/CHF has been largely dictated by the moves across the equity space where stagflation fears have provided tailwinds for the Swiss Franc making it difficult at the current juncture to be long risk. That being said, given that the cross appears somewhat cheap relative to Bund yields (Figure 2), I suspect conviction in lower EUR/CHF will wane as we get closer to 1.0700 and perhaps may provide an opportunity to look for a reversal.
Figure 1. Cross-Correlation Matrix
Source: Refinitiv, DailyFX
Figure 2. EUR/CHF vs Bund Yield
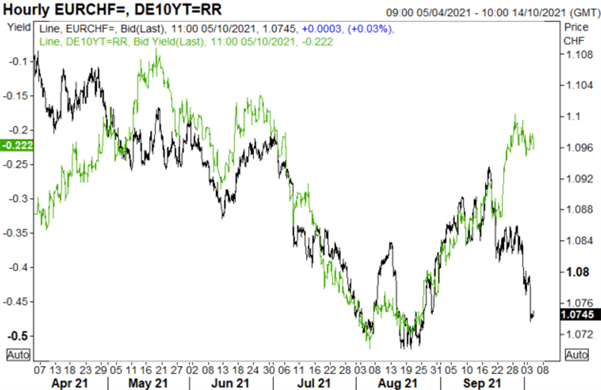
Source: Refinitiv
Tonight will see the RBNZ embark on its rate hiking cycle with the Bank expected to deliver a 25bps rate rise and likely to signal that future hikes will be on the way. This is also a key feature behind my top trade for Q4 with a look at AUD/NZD, which I have touched on previously.
Q4 Top Trade: Bullish AUD/NZD
The Great Monetary Policy Divergence is Overdone
Heading into the final quarter of the year, one of my favorite trades is long AUD/NZD with a view that the great monetary policy divergence – and arguably most consensus trade – comes to an end.
There is considerable backdrop upon which I form my views. There has been a considerable amount of negative news has been priced into the Australian Dollar – revealed by CFTC speculative positioning data, which shows record net AUD shorts. In contrast, NZD sports extremes from long interst. When analysising CFTC data, take note of the extremes. (Figure 1)
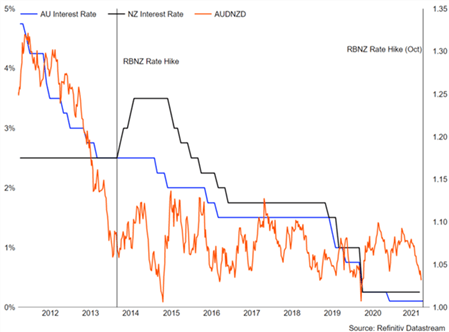
In economic terms, an increase in vaccinations will be reflected in improved Q4 Australian growth data. For traders, AUD/NZD is the most consensus short across the G10 and looking overdone. NZ rates have priced in 140bps of tightening by Oct. 2022, leaving little room for error (Fig. 2). In 2013-14, AUD/NZD put in a bottom when the RBNZ hiked. History doesn’t repeat itself, but it often rhymes (Fig. 3). Barring extreme risk aversion, parity in AUD/NZD would be hard to factor (Fig. 4).
Figure 1. Peak Bearishness for Aussie….. Net Shorts at a Record
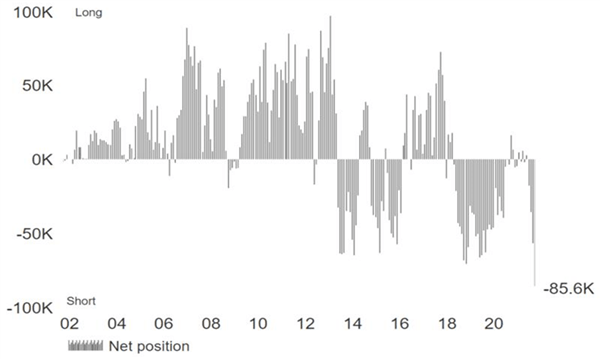
Source: Refinitiv
Back in 2013/14, AUD/NZD drifted lower as the RBNZ discussed raising interest rates before finding a bottom the moment the RBNZ hiked. My view is that we see similar price action after the RBNZ hikes, with AUD/NZD finding a bottom. This is a ‘sell the rumour, buy the fact’ scenario.
Figure 2. AUD/NZD Bottomed in 2014 After RBNZ Rate Lift-Off
Be the first to comment