

EUR/USD ANALYSIS
- EU joint bond sale props up Euro.
- Upcoming ECB rate decision crucial!
- Weekly EUR/USD chart at critical juncture.
EURO FUNDAMENTAL BACKDROP
Yesterday’s threat of oil sanctions on Russia pushed the Euro deeper into weakening territory supported by an ever diverging Federal Reserve and ECB. The Euro zone is geographically disadvantaged relative to the U.S. which seems obvious but is important to point on from a financial markets perspective where U.S. assets are generally less effected by the Russia/Ukraine conflict. Many countries within the Euro zone has been on a drive to rid themselves of fossil fuels which have left them severely exposed under the current circumstance. Should Russia completely shut off Europe from energy supply, the already failing Euro zone could come under further pressure leaving the Euro open to additional downside risk.
According to Bloomberg news, the EU is planning on a large-scale bond issue to help finance energy and defense needs in 27 member states, and could be communicated later this week at the emergency summit in France. Markets initially reacted favorably to the announcement with the Euro ticking higher against the dollar alongside German bund yields.
10-YEAR GERMAN BUND YIELD:
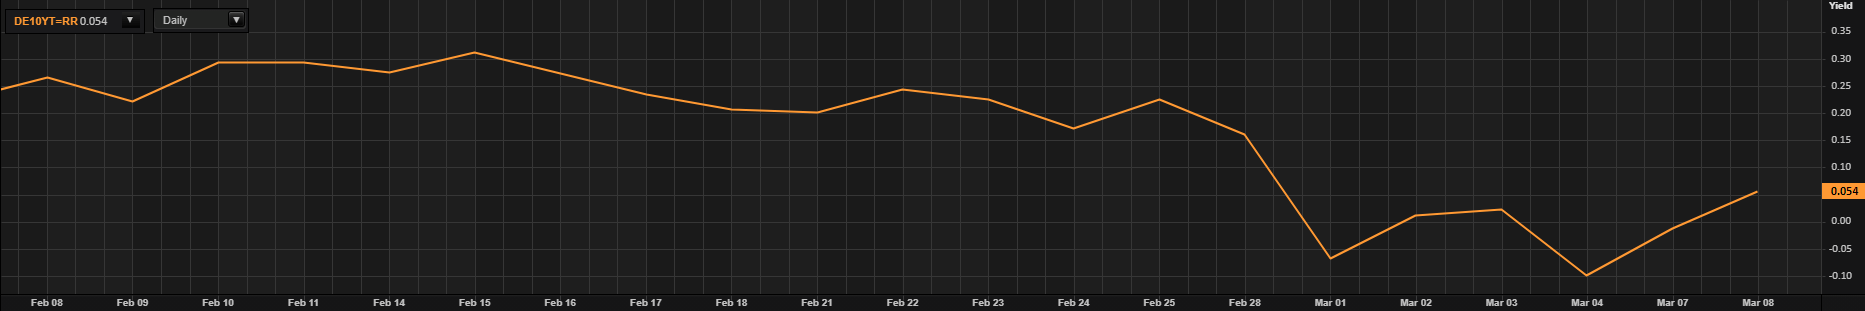
Source: Refinitiv
The upcoming ECB meeting (March 15) may be one of the most important in recent history as officials juggle the idea of almost certain higher inflation with stagnating growth in Q2 at a minimum. We are likely to see fiscal easing in an attempt to shield consumers from rampant inflation as monetary policy (rate hikes) cannot address the shortage in commodity supplies.
EU GDP for Q4 printed in line with estimates both QoQ and YoY (see economic calendar below) having minimal impact on EUR/USD price action. This data is has been overshadowed by current circumstances whereby EU GDP is anticipated to decline.
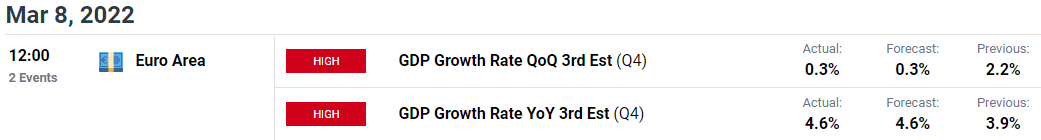
Source: DailyFX Economic Calendar
TECHNICAL ANALYSIS
EUR/USD WEEKLY CHART
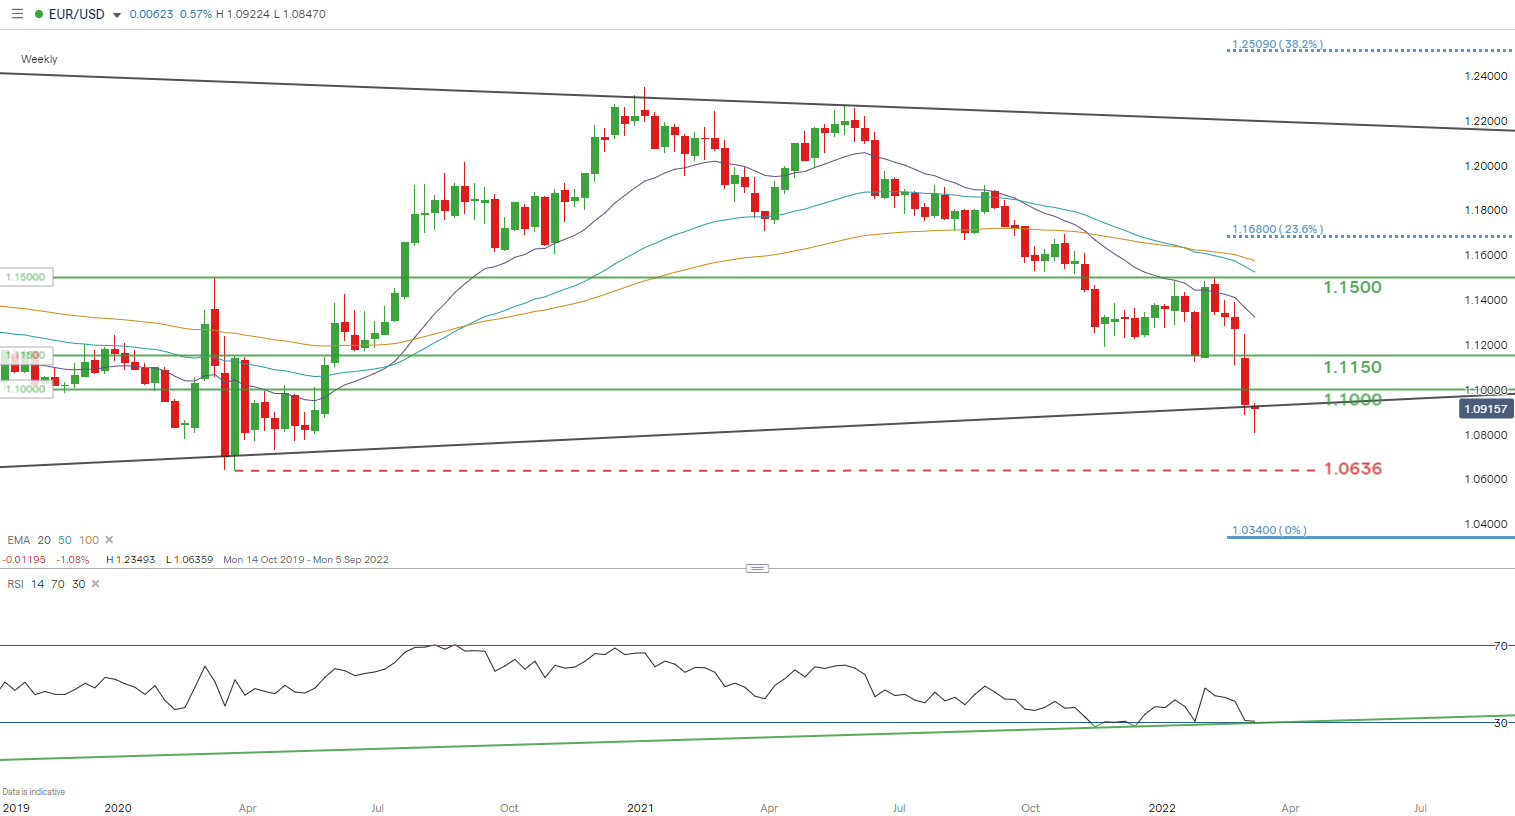
Chart prepared by Warren Venketas, IG
The threat to the long-term symmetrical triangle on the EUR/USD weekly chart may be ready to breakout. This weeks weekly candle has breached triangle support (black) with price action showing a fight back by bulls as evident from the lower long wick. A candle close below the support zone could spell disaster for the Euro as it may point to further downside.
Bullish divergence (green) is apparent on the RSI momentum indicator suggestive of impending upside however, under normal circumstances this signal is vague in terms of time frame and with the current market turmoil it points to further ambiguity.
Resistance levels:
- 1.1150
- 1.1000
- Triangle support
Support levels:
IG CLIENT SENTIMENT DATA BEARISH
IGCS shows retail traders are currently LONG on EUR/USD, with 68% of traders currently holding long positions (as of this writing). At DailyFX we typically take a contrarian view to crowd sentiment resulting in a short-term downside bias.
Contact and follow Warren on Twitter: @WVenketas
Be the first to comment