

Ethereum/Bitcoin (ETH/BTC) Chart and Analysis
- ETH/BTC spread is testing the bear trend.
- Altcoins may look to move higher.
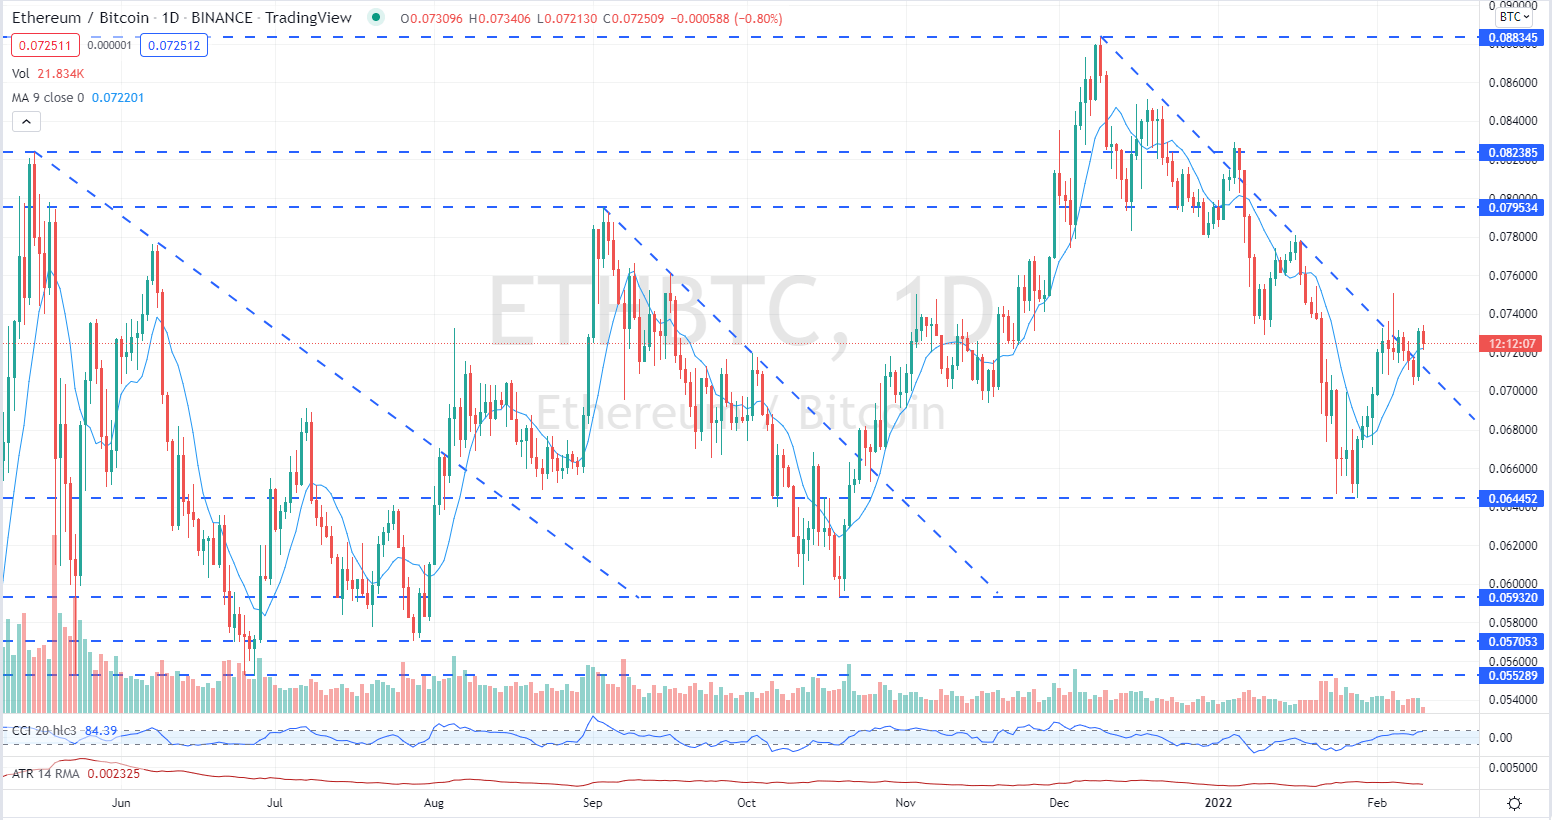
The ETH/BTC spread broke above trend resistance yesterday and now needs to consolidate this move over the next couple of sessions to allow the move to continue. This is the third time since mid-May 2021 that the prevailing downtrend has been tested, with the first two breaks seeing the spread move considerably higher (Ethereum outperforming Bitcoin). The double low made at the start of the second move in mid-October is also mirrored by a double low in late-January, suggesting that this third move, if it is confirmed, can continue with the peak of move two (0.079534) as the initial target.
The spread made a false break on January 4 before falling heavily, hence the reason that confirmation of this move is needed, while the CCI indicator also shows the spread moving into overbought territory. One to watch to see if trend resistance now turns to trend support.
If this move higher continues, the altcoin market may also move higher in tandem as has been the case in the past. The mid-November to late-January sell-off saw a wide range of altcoins hammered lower with many of the more popular names registering 50%+ losses. A lead higher by ETH/BTC could see the partial recovery in the altcoin space continue, helping to erase recent, heavy losses.
Ethereum/Bitcoin Spread Daily Price Chart February 10, 2022
Chart via TradingView
What is your view on the Ethereum/Bitcoin spread – bullish or bearish?? You can let us know via the form at the end of this piece or you can contact the author via Twitter @nickcawley1.
Be the first to comment