

utah778
Below is a look at our key ETF matrix highlighting total returns over the last five years, three years, and year-to-date. What’s most remarkable to us is how bad five-year performance has gotten for quite a few asset classes. Significant drops in price this year have erased years of built-up gains, and now a lot of areas of global financial markets are actually looking at double-digit percentage declines going back to the late 2010s.
The major US index ETFs are sitting on 20%+ declines in 2022, but they’re still up nicely over the last three and five years. The Nasdaq 100 (QQQ) is down 30% YTD but still up 95% over the last five years. Only the Technology sector ETF (XLK) has done better on a five-year total return basis out of all the ETFs listed in the matrix.
On the flip side, an unrelenting rise in interest rates this year has caused the bond market to suffer its worst drawdown in decades. This has left the aggregate US bond market ETFs (AGG, BND) now lower on a total return basis over the last five years. The long-duration 20+ Year Treasury ETF (TLT) is down 25% over the last three years and 8% over the last five years.
Outside of the US, every major country ETF in our matrix has underperformed SPY over the last five years. India (PIN) is up the most (+39.9%) and the closest to SPY’s 58.6% five-year gain. Canada (EWC) and Israel (EIS) are both up just over 20% over the last five years, while Australia (EWA) and France (EWQ) are the only others in the green. Spain (EWP) and Germany (EWG) are down the most with five-year declines of more than 25%!
Asset Class Performance YTD, 3 Yrs, and 5 Yrs – Total Return (%) (Author)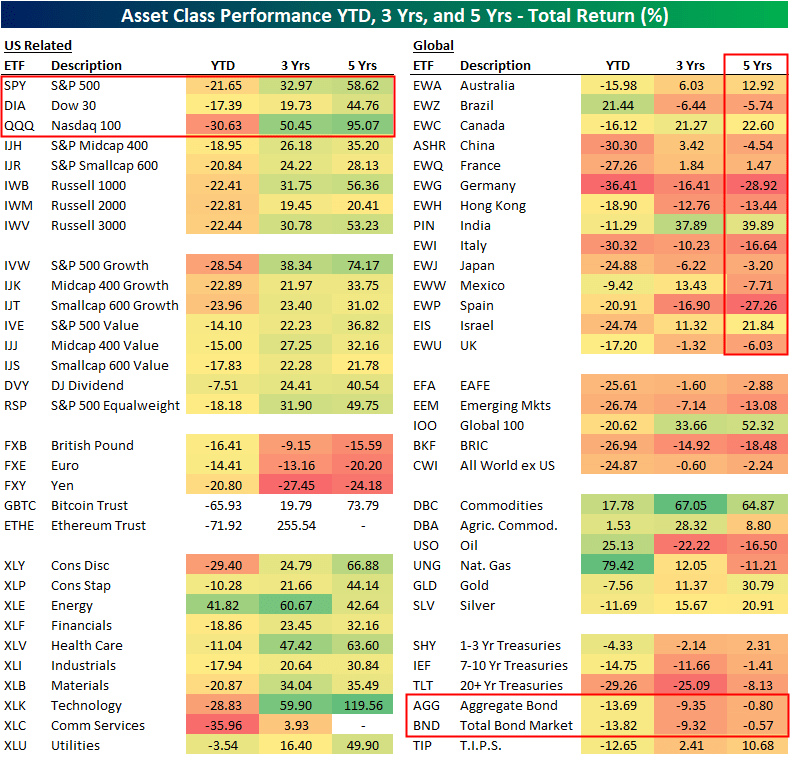
Looking more closely at stocks vs. bonds, below is the five-year total return of the S&P 500 (SPY) vs. the US aggregate bond market (AGG). Historically, there has been an expectation that bonds would cushion the blow when stocks fall, but 2022 has been uniquely painful for both asset classes. While SPY has fallen more than 20% this year, it has still posted a total return of nearly 60% on a five-year basis. The bond market, on the other hand, is now negative over the last five years.
5-Year Total Return (%) Of US Stocks Vs. Bonds (Author)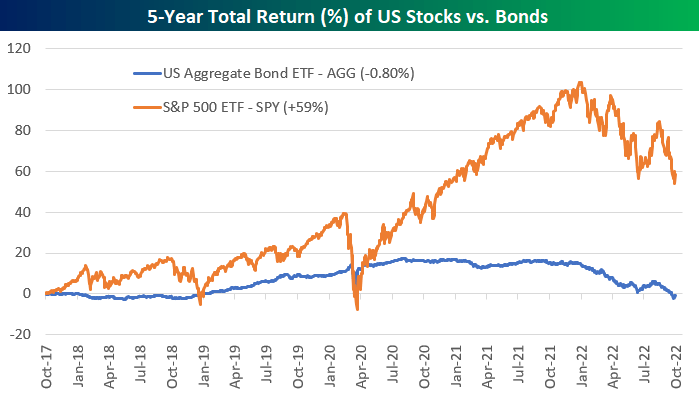
Editor’s Note: The summary bullets for this article were chosen by Seeking Alpha editors.
Be the first to comment