

CatLane
This article was written by Dividend Sensei.
Brad Thomas loves recessions, and while I personally wouldn’t go that far, I, too, love recessionary bear markets.
Why?
Because only when the market loses its mind and fear of missing out is replaced by just plain fear can you get truly spectacular blue-chip bargain opportunities.
That includes the world-beater blue chips, industry titans with exceptional assets, incredible management teams, and some of the best and most dependable yields in history.
Today I want to share with you the three reasons why Dividend Kings just recommended 4.1% yielding Essex Property Trust, Inc. (NYSE:ESS), a sweet dividend aristocrat real estate investment trust (“REIT”) bargain you don’t want to miss.
Reason One: Essex Is One Of The World’s Best REITs
REITs have been hit hard this year, largely due to a surge in long-term yields. ESS has been hit especially hard, falling 40% off its highs, far worse than the REIT sector’s 23% decline.
ESS has delivered 14% annual returns since 1994, and its average rolling returns have been 2X that of the S&P 500 for the last 29 years. But from bear market lows (this is the 2nd worst bear market in its history) it is capable of truly Buffett-style returns.
-
One-year return as high as 76%
-
three-year returns as high as 44% annually = 3X in three years
-
five-year returns as high as 34% annually = 4.3X in five years
-
seven-year returns as high as 29% annually = 6X in seven years
-
10-year returns as high as 26% annually = 10X in 10 years
-
15-year returns as high as 19% annually = 14.2X in 15 years.
Why? Likely because of a relatively sharp housing downturn, economists are starting to predict 2023 (up to a 20% decline in housing prices, according to Morgan Stanley).
“Our long-term housing market outlook remains intact. We project housing starts will rebound 8% in 2024 to 1.375 million units and continue to expand through 2027, reaching approximately 1.550 million units.
Over a longer horizon, we think that a 1.4-million-unit annual production pace is a reasonable assumption. After a challenging 2023-24, we see home price appreciation returning to the long-run trajectory of 3%-4% and repair and remodel spending growth normalizing at about a 5% annual rate.” – Morningstar
Whenever the market becomes fixated on short-term weakness and overlooks strong secular trends, that’s when it’s time to “be greedy when others are fearful.”
Why The Market Is Wrong To Sell Off Essex So Harshly
Essex was founded in 1971, one of the oldest REITs in America. ESS has survived and thrived through the following:
-
nine recessions
-
two economic crises
-
inflation as high as 15%
-
Fed funds rate as high as 20%
-
10-year yields as high as 16%
-
30-year mortgage rates as high as 16%.
ESS is built to last and will likely outlive us all.
It’s been raising its dividend for 28 consecutive years, one of the few aristocrat REITs.
-
just 13 REITs avoided cutting their dividends during the Great Recession, ESS was one of them.
The management team is skilled, adaptable, and experienced, with the average executive with the REIT for 17 years.
ESS owns 253 apartment buildings in California and Washington state.
-
42% of net operating income is from Southern California
-
40% is from North California
-
18% is from Seattle.
85% of its apartments are located in suburban markets that have been thriving through the pandemic.
ESS’s apartments are in some of the richest cities in the country, with very favorable demographics for apartments.
-
median home price of $983K
-
median household income $115K vs. $71K national median
-
average rent-to-income ratio of 23.5% (33% or less is considered affordable).
In other words, ESS is in a demographic sweet spot.
-
wealthy cities and suburbs with expensive houses
-
but where rents are still relatively affordable.
How affordable? According to Redfin, the average American household spends 54% of discretionary income on housing.
-
ESS’s customers are paying less than half that.
ESS’s combination of safety, quality, and superb quality assets shows in its exceptional historical returns.
-
40X return since 1994 IPO
-
average apartment REIT: 24X
-
S&P: 14.6X
-
all REITs: 14X.
ESS has been running circles around its peers, other REITs, and the stock market in general. Why?
Since the Great Recession, its fundamentals have been stellar, especially compared to other apartment REITs.
-
same-property NOI growth: 77% vs. 64% peers
-
core FFO/share growth 178% vs. 82% peers
-
dividend growth 139% vs. 56% peers.
In 2022, ESS has had very strong pricing power with revenue growth of 10.2%, and renewal rates in recent quarters have been over 8.1%.
Meanwhile, occupancy remains very strong at 96%, thanks to one of the tightest housing markets in the country in CA.
That occupancy will likely remain high even in a 2023 recession because it costs 2.3X more to buy a home in ESS markets than rent.
-
the highest own/rent ratio in over 20 years.
In other words, the things the market is worried about, recession, high rates, and a weakening economy, should make ESS’s value proposition to renters even stronger, not weaker.
Worried about the soaring housing supply? NIMBYism in CA means that building permits for new houses are just 1.2% of the existing supply, the lowest in the country.
That’s compared to red-hot housing markets like Nashville (+6.9%), Raleigh (+7.1%), and Austin (+10.3%).
ESS has one of the strongest balance sheets in REITdom, BBB+ stable from S&P and Moody’s.
-
3.2% average borrowing cost
-
no debt maturing in 2023 (recession year)
-
$400 million maturing in 2024
-
5.8X debt/EBITDA vs. 6.0 or less safe according to rating agencies
-
$1.2 billion in liquidity
-
90% unsecured debt for good financial flexibility.
Bottom Line: Essex Is One Of The Best Apartment REITs In The World, And It’s In A 40% Bear Market For No Good Reason
And here are some more reasons to potentially buy ESS today.
More Reasons To Potentially Buy Essex Property Today
|
Metric |
Essex Property Trust |
|
Quality |
95% 13/13 Ultra SWAN (Sleep Well At Night) Apartment REIT |
|
Risk Rating |
Low Risk |
|
DK Master List Quality Ranking (Out Of 500 Companies) |
74 |
|
DK Master List Quality Percentile |
85% |
|
Dividend Growth Streak (Years) |
28 |
|
Dividend Yield |
4.1% |
|
Dividend Safety Score |
95% |
|
Average Recession Dividend Cut Risk |
0.5% |
|
Severe Recession Dividend Cut Risk |
1.75% |
|
S&P Credit Rating |
BBB+ Stable Outlook |
|
30-Year Bankruptcy Risk |
5.00% |
|
LT S&P Risk-Management Global Percentile |
66% Above-Average, Low-Risk |
|
Fair Value |
$314.97 |
|
Current Price |
$212.61 |
|
Discount To Fair Value |
32% |
|
DK Rating |
Potential Very Strong Buy |
|
P/FFO |
13.8 |
|
Historical PE |
20.5 to 22 FFO |
|
LT Growth Consensus/Management Guidance |
7.3% |
|
5-year consensus total return potential |
13% to 15% CAGR |
|
Base Case 5-year consensus return potential |
15% CAGR (2X S&P 500) |
|
Consensus 12-month total return forecast |
30% |
|
Fundamentally Justified 12-Month Return Potential |
52% |
|
LT Consensus Total Return Potential |
11.4% Vs. 10.2% S&P 500 |
|
Inflation-Adjusted Consensus LT Return Potential |
9.1% |
|
Consensus 10-Year Inflation-Adjusted Total Return Potential (Ignoring Valuation) |
2.38 |
|
LT Risk-Adjusted Expected Return |
7.58% |
|
LT Risk-And Inflation-Adjusted Return Potential |
5.25% |
|
Conservative Years To Double |
13.71 |
(Source: Dividend Kings Zen Research Terminal.)
Essex Property 2024 Consensus Total Return Potential
FAST Graphs, FactSet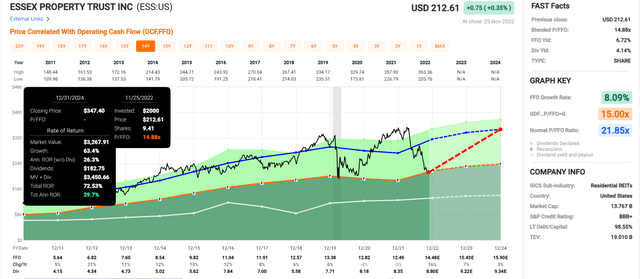
If ESS grows as expected through 2024 and returns to historical fair value, it could deliver 73% total returns or 30% annually.
-
Buffett-like return potential from a blue-chip bargain hiding in plain sight
-
3X the S&P consensus return potential.
Essex Property 2027 Consensus Total Return Potential
FAST Graphs, FactSet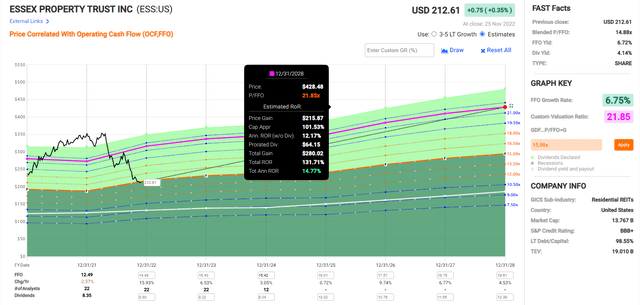
Over the next five years ESS could deliver 132% total returns, or 15% per year.
-
over 2X more than the S&P 500 consensus.
ESS Investment Decision Tool
Dividend Kings
Dividend Kings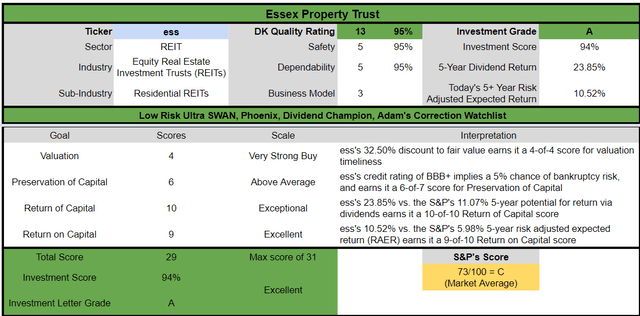
ESS is a potentially excellent and reasonable high-yield Ultra SWAN aristocrat opportunity for anyone comfortable with its risk profile. Look at how it compares to the S&P 500.
-
33% discount to fair value vs. 4% premium S&P = 37% better valuation
-
4.1% safe yield vs. 1.7% (2.5X higher and much safer)
-
approximately 10% long-term annual return potential
-
about 2X higher risk-adjusted expected returns
-
2X higher income potential over five years.
Reason Two: One Of The Fastest Growing Blue-Chip REITs In The World
Given ESS’s 40% bear market, you might think the fundamentals were falling off a cliff. The truth is very different.
|
Metric |
2021 Growth Consensus |
2022 Growth Consensus |
2023 Growth Consensus |
2024 Growth Consensus |
2025 Growth Consensus |
2026 Growth Consensus |
2027 Growth Consensus |
|
Sales |
-3% |
11% |
6% |
2% |
9% |
5% |
5% |
|
Dividend |
7% |
1% |
5% (Official) |
2% |
5% |
5% |
2% |
|
FFO |
-3% |
16% |
7% |
3% |
10% |
7% |
5% |
|
AFFO |
-6% |
15% |
8% |
3% |
13% |
4% |
4% |
|
EBITDA |
-22% |
14% |
10% |
2% |
NA |
NA |
NA |
|
EBIT (operating income) |
-39% |
25% |
17% |
5% |
NA |
NA |
NA |
(Source: FAST Graphs, FactSet.)
ESS is expected to keep generating steady growth even through the 2023 and 2024 housing downturn and 2023 recession.
That includes steady 4% dividend growth through 2027.
-
when its dividend growth streak hits 32 years.
ESS Long-Term Growth Outlook
The median long-term growth consensus for ESS from all 26 analysts on Wall Street is 7.3% CAGR, which is one of the fastest growth rates in the industry or the REIT sector.
How accurate are analyst forecasts for this REIT?
Smoothing for outliers, historical analyst margins-of-error is 5% to the downside and 15% to the upside.
-
5% to 9% margin-of-error and historical growth adjusted consensus range.
ESS’s historical growth rates for the last two decades have been very steady at 5% to 8%. Given the incredible secular demographic tailwinds ESS is facing over the next 20 years, a 7% growth rate is very reasonable.
|
Investment Strategy |
Yield |
LT Consensus Growth |
LT Consensus Total Return Potential |
Long-Term Risk-Adjusted Expected Return |
Long-Term Inflation And Risk-Adjusted Expected Returns |
Years To Double Your Inflation & Risk-Adjusted Wealth |
10-Year Inflation And Risk-Adjusted Expected Return |
|
Essex Property Trust |
4.1% |
7.3% |
11.4% |
8.0% |
5.7% |
12.7 |
1.73 |
|
REITs |
3.9% |
6.1% |
10.0% |
7.0% |
4.7% |
15.4 |
1.58 |
|
Schwab US Dividend Equity ETF |
3.6% |
8.5% |
12.1% |
8.4% |
6.1% |
11.8 |
1.81 |
|
Dividend Aristocrats |
2.6% |
8.5% |
11.1% |
7.8% |
5.4% |
13.2 |
1.70 |
|
S&P 500 |
1.7% |
8.5% |
10.2% |
7.2% |
4.9% |
14.8 |
1.61 |
(Sources: DK Research Terminal, FactSet, Morningstar, YCharts.)
That means a potential 11.4% long-term return, which is better than the 10% analysts expect from REITs and superior to the S&P 500 and dividend aristocrats.
Reason Three: Essex Is Already Pricing In The 2023 Recession
For 20 years, tens of millions of income investors have consistently paid 20.5X to 22 funds from operations (“FFO”) for ESS, outside of bubbles and bear markets.
-
91% statistical probability that ESS is worth between 20.5X and 22X FFO.
|
Metric |
Historical Fair Value Multiples (14-Years) |
2021 |
2022 |
2023 |
2024 |
2025 |
12-Month Forward Fair Value |
|
5-Year Average Yield |
2.96% |
$282.43 |
$297.30 |
$297.30 |
$317.23 |
$332.77 |
|
|
13-year median yield |
2.80% |
$298.57 |
$314.29 |
$314.29 |
$335.36 |
$351.79 |
|
|
P/FFO |
21.85 |
$272.91 |
$315.73 |
$336.93 |
$349.82 |
$383.90 |
|
|
Average |
$272.91 |
$308.87 |
$315.34 |
$333.60 |
$354.92 |
$314.97 |
|
|
Current Price |
$212.61 |
||||||
|
Discount To Fair Value |
22.09% |
31.17% |
32.58% |
36.27% |
40.10% |
32.50% |
|
|
Upside To Fair Value (including dividend) |
28.36% |
45.28% |
48.32% |
56.91% |
66.94% |
52.28% |
|
|
2022 FFO |
2023 FFO |
2022 Weighted EPS |
2023 Weighted EPS |
12-Month Forward EPS |
Historical Average Fair Value Forward P/FFO |
Current Forward P/FFO |
|
|
$14.45 |
$15.42 |
$0.83 |
$14.53 |
$15.36 |
20.5 |
13.8 |
I conservatively estimated ESS is worth 20.5X FFO and today it’s trading at a rock bottom 13.8X FFO.
ESS Has Only Traded Lower At Better Valuations During The Pandemic Crash, Great Recession, And Tech Crash Recession
FAST Graphs, FactSet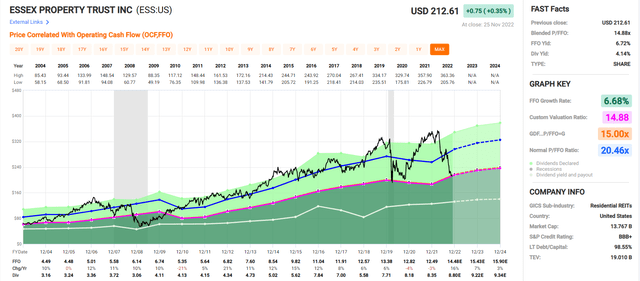
ESS is trading at recessionary bear market lows, and economists expect the mildest recession in U.S. history next year (more on this in the risk section).
|
Analyst Median 12-Month Price Target |
Morningstar Fair Value Estimate |
|
$266.55 (17.4X FFO) |
$322.00 (21 FFO) |
|
Discount To Price Target (Not A Fair Value Estimate) |
Discount To Fair Value |
|
20.24% |
33.97% |
|
Upside To Price Target (Not Including Dividend) |
Upside To Fair Value (Not Including Dividend) |
|
25.37% |
51.45% |
|
12-Month Median Total Return Price (Including Dividend) |
Fair Value + 12-Month Dividend |
|
$275.35 |
$330.80 |
|
Discount To Total Price Target (Not A Fair Value Estimate) |
Discount To Fair Value + 12-Month Dividend |
|
22.79% |
35.73% |
|
Upside To Price Target ( Including Dividend) |
Upside To Fair Value + Dividend |
|
29.51% |
55.59% |
Morningstar agrees with me that ESS is about 34% undervalued and offers over 50% upside to fair value. Analysts expect a 30% total return within 12 months and that forecast is 100% justified by fundamentals.
|
Rating |
Margin Of Safety For Low Risk 13/13 Ultra SWAN Quality Companies |
2022 Fair Value Price |
2023 Fair Value Price |
12-Month Forward Fair Value |
|
Potentially Reasonable Buy |
0% |
$308.87 |
$315.34 |
$314.97 |
|
Potentially Good Buy |
5% |
$293.43 |
$299.58 |
$299.22 |
|
Potentially Strong Buy |
15% |
$262.54 |
$268.04 |
$267.72 |
|
Potentially Very Strong Buy |
25% |
$220.07 |
$236.51 |
$236.23 |
|
Potentially Ultra-Value Buy |
35% |
$200.77 |
$204.97 |
$204.73 |
|
Currently |
$212.61 |
31.17% |
32.58% |
32.50% |
|
Upside To Fair Value (Including Dividends) |
49.42% |
52.46% |
52.28% |
For anyone comfortable with its risk profile, ESS is a potentially very strong buy and not far off its Ultra Value buy price.
Risk Profile: Why Essex Property Isn’t Right For Everyone
There are no risk-free companies, and no company is right for everyone. You have to be comfortable with the fundamental risk profile.
Essex Risk Profile Summary
“The multifamily real estate market on the West Coast has benefited over the past decade from demographic trends such as a falling homeownership rate, the rising relative cost of single-family housing, and urban gentrification.
These trends are driven by the tastes and desires of millennials, whose behavior may change as they age and acquire enough capital to own single-family homes. The reversal of these trends would negatively affect apartments, and this could happen quickly since most leases run for only 12 months.
Demand for apartments in any market is sensitive to changes in the economic health of that market. If job growth slows or industries experience significant layoffs, demand for apartments falls.
The technology industry has become increasingly important to the Northern California and Seattle markets, as tech companies have driven job and income growth in those markets, creating substantial demand for apartments. A downturn in this industry would significantly affect the economies of these markets and negatively affect the fundamentals of Essex’s assets in these markets.
Many of Essex’s markets should see a few years of rising supply. While we expect the current level of supply to be absorbed by existing demand growth and help moderate the market, increased new supply will pressure operations and asset values.
Essex has only $102 million in development project commitments scheduled for delivery over the next few years. The economics of these projects have marginal room for error and will depend heavily on market conditions at a delivery meeting today’s expectations.
The company may face environmental, social, and governance, or ESG, risks that would negatively affect the portfolio or cash flows. These include properly maintaining the safety of the buildings across the portfolio, paying a competitive wage to employees, and accounting for the future impact of climate change.” – Morningstar (emphasis supplied).
ESS’s Risk Profile Includes
-
geographic concentration risk (all West Coast tech hubs)
-
demographic shift risk (should work-from-home result in a permanent shift to lower cost areas)
-
redevelopment execution risk ($102 million in projects that have to come in on time and on a budget)
-
employee retention risk (still the tightest job market in 50 years).
What about recession risk?
NY Fed, CNBC, DK S&P 500 Valuation Tool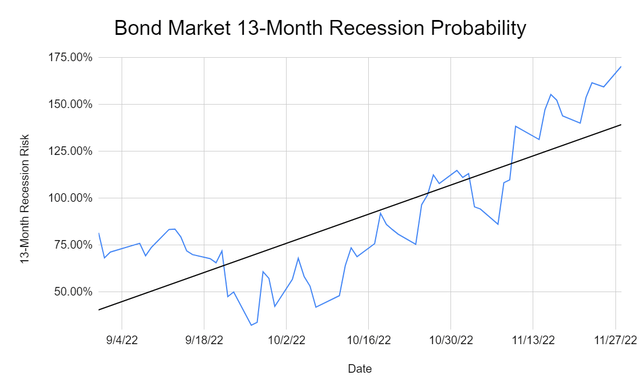
The Bond market estimates a 170% recession probability within 13 months. What does that mean? A 100% risk of a recession beginning much earlier.
Based on 18 economic indicators, a recession might begin in three to five months.
-
February to April 2023
-
consistent with estimates from Goldman and UBS.
That’s consistent with a recent survey of CEOs from the Conference Board.
-
85% expect a mild recession in 2023
-
44% plan to keep hiring during the recession
-
just 14% of companies plan to cut growth spending during the recession.
What does this mean for the economy and ESS?
That the blue-chip economist consensus expects a peak GDP decline of about -0.1%, the mildest recession in US history.
-
and thus ESS’s 40% bear market is not justified by fundamentals.
How do we quantify, monitor, and track such a complex risk profile? By doing what big institutions do.
Long-Term Risk Management Analysis: How Large Institutions Measure Total Risk Management
See the risk section of this video to get an in-depth view (and link to two reports) of how DK and big institutions measure long-term risk management by companies
DK uses S&P Global’s global long-term risk-management ratings for our risk rating.
-
S&P has spent over 20 years perfecting their risk model
-
which is based on over 30 major risk categories, over 130 subcategories, and 1,000 individual metrics
-
50% of metrics are industry specific
-
this risk rating has been included in every credit rating for decades.
The DK risk rating is based on the global percentile of how a company’s risk management compares to 8,000 S&P-rated companies covering 90% of the world’s market cap.
ESS Scores 66th Percentile On Global Long-Term Risk Management
S&P’s risk management scores factor in things like:
-
supply chain management
-
crisis management
-
cyber-security
-
privacy protection
-
efficiency
-
R&D efficiency
-
innovation management
-
labor relations
-
talent retention
-
worker training/skills improvement
-
customer relationship management
-
climate strategy adaptation
-
corporate governance
-
brand management.
Essex’s Long-Term Risk Management Is The 230th Best In The Master List (54th Percentile In The Master List)
|
Classification |
S&P LT Risk-Management Global Percentile |
Risk-Management Interpretation |
Risk-Management Rating |
|
BTI, ILMN, SIEGY, SPGI, WM, CI, CSCO, WMB, SAP, CL |
100 |
Exceptional (Top 80 companies in the world) |
Very Low Risk |
|
Strong ESG Stocks |
86 |
Very Good |
Very Low Risk |
|
Foreign Dividend Stocks |
77 |
Good, Bordering On Very Good |
Low Risk |
|
Ultra SWANs |
74 |
Good |
Low Risk |
|
Dividend Aristocrats |
67 |
Above-Average (Bordering On Good) |
Low Risk |
|
Essex Property Trust |
66 |
Above-Average |
Low Risk |
|
Low Volatility Stocks |
65 |
Above-Average |
Low Risk |
|
Master List average |
61 |
Above-Average |
Low Risk |
|
Dividend Kings |
60 |
Above-Average |
Low Risk |
|
Hyper-Growth stocks |
59 |
Average, Bordering On Above-Average |
Medium Risk |
|
Dividend Champions |
55 |
Average |
Medium Risk |
|
Monthly Dividend Stocks |
41 |
Average |
Medium Risk |
(Source: DK Research Terminal.)
ESS’s risk-management consensus is in the top 46% of the world’s highest quality companies and similar to that of such other blue-chips as
-
Coca-Cola (KO): Ultra SWAN dividend king
-
Hormel Foods (HRL): Ultra SWAN dividend king
-
Procter & Gamble (PG): Ultra SWAN dividend king
-
Realty Income (O): Ultra SWAN dividend aristocrat
-
Pepsi (PEP): Super SWAN dividend king
The bottom line is that all companies have risks, and Essex is above-average at managing theirs according to S&P.
How We Monitor ESS’s Risk Profile
-
26 analysts
-
two credit rating agencies
-
28 experts who collectively know this business better than anyone other than management
“When the facts change, I change my mind. What do you do, sir?” – John Maynard Keynes.
There are no sacred cows at iREIT or Dividend Kings. Wherever the fundamentals lead, we always follow. That’s the essence of disciplined financial science, the math behind retiring rich and staying rich in retirement.
Bottom Line: Essex Property Is A Sweet 4.1% Yielding Dividend Aristocrat REIT
Let me be clear: I’m NOT calling the bottom in ESS (I’m not a market-timer).
Ultra-SWAN quality does NOT mean “can’t fall hard and fast in a bear market.”
Fundamentals are all that determine safety and quality, and my recommendations.
-
over 30+ years, 97% of stock returns are a function of pure fundamentals, not luck
-
in the short term, luck is 25X as powerful as fundamentals
-
in the long term, fundamentals are 33X as powerful as luck.
While I can’t predict the market in the short term, here’s what I can tell you about ESS.
-
One of the highest quality and safest REITs in the world.
-
very safe 4.1% yield (2.5X the S&P yield and safer, growing 4% per year)
-
11.4% CAGR long-term total consensus, better than the S&P, and aristocrats, and REITs
-
33% historically undervalued, a potentially very strong buy
-
13.8X FFO = compared to historical 20.5X to 22X FFO
-
133% consensus return potential over the next six years, 15% CAGR, more than 2X better than the S&P 500
-
2X the risk-adjusted expected returns of the S&P 500 over the next five years
-
2X the income potential of the S&P over the next five years.
Do you want to feel smart in 5+ years? Then consider buying ESS today.
Do you want to feel like a stock market genius in 10+ years? Then ESS is a potentially very strong buy today.
Do you want to sleep well at night knowing your savings are in the hands of skilled and trustworthy management? Then ESS fits the bill.
Do you want to profit from a 20-year secular trend in housing? ESS is in the demographic sweet spot with the assets it owns.
Do you want a high-yield aristocrat that’s 33% historically undervalued…for no good reason? Then ESS truly represents a sweet high-yield REIT bargain you don’t want to miss.
Be the first to comment