

Sundry Photography/iStock via Getty Images
Thanks to the nationwide housing shortage, I expected Apartment REITs to outperform in 2022. It hasn’t worked out that way so far.
With the year nearly half over, it has been a bad year for REITs, and Apartment REITs are slightly behind the REIT average, as this chart from Hoya Capital Income Builder shows:
Hoya Capital Income Builder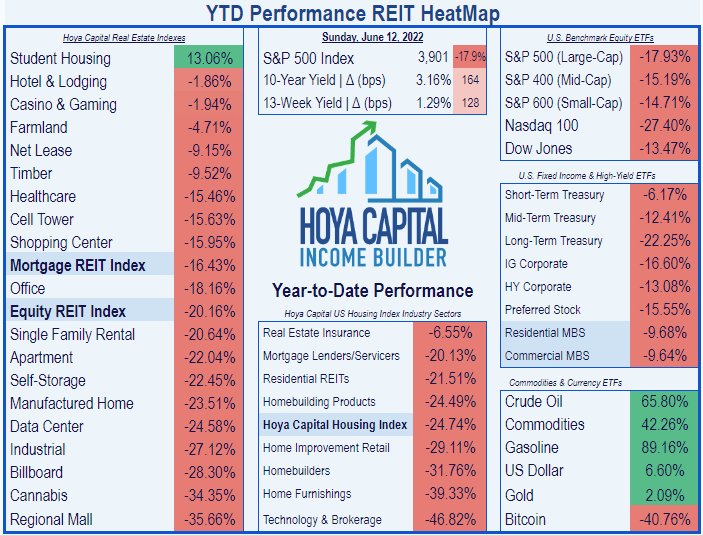
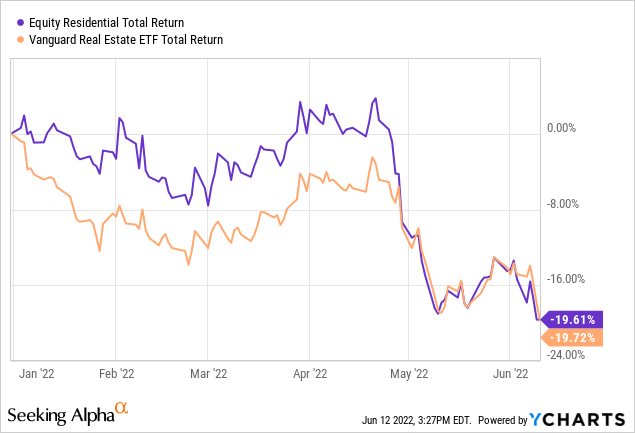
Not so with Equity Residential (NYSE:EQR), which has slightly outperformed the overall REIT average.
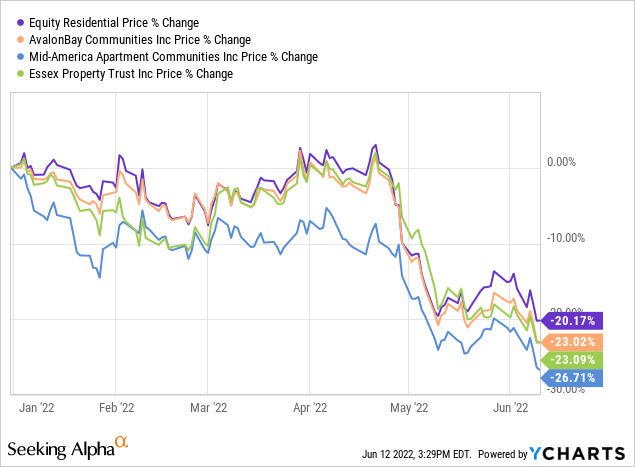
And it is outperforming its three closest large-cap Apartment REIT peers, as well as the Apartment REIT average of (-22.04)%.
What is going on with this company, and what does the future hold?
Meet the company
Equity Residential is a well-established large-cap Apartment REIT headquartered in Chicago, in operation since 1969. The company owns 311 properties totaling 80,581 class A and class B apartments in 12 U.S. markets, with an occupancy rate of 96.9% as of May.
As you can see from the map, about 90% of EQR’s assets are in huge cities on the two coasts, and 95% of their NOI (net operating income) derives from those locations. Meanwhile, the company is expanding into four Sunbelt markets:
- Atlanta
- Dallas-Fort Worth
- Denver
- Austin
Company investor presentation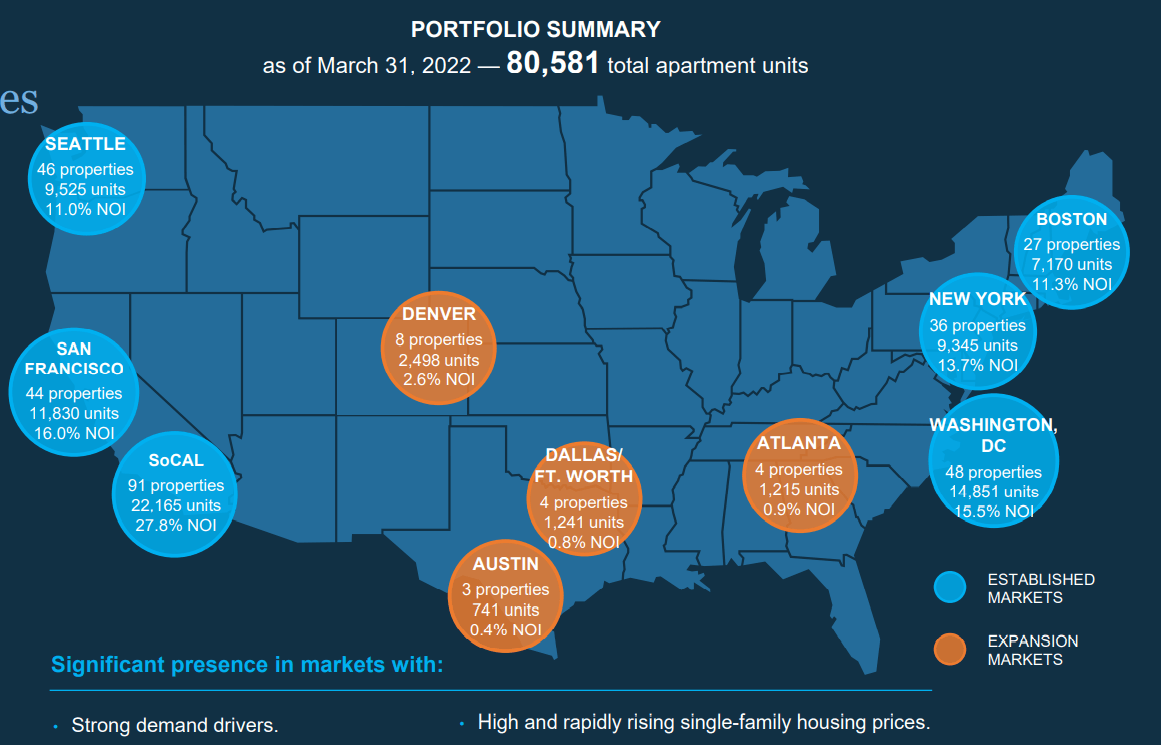
Like many Apartment REITs, EQR is experiencing excellent leasing spreads, with new lease rates up 19.9%, and a blended rate of 14.0%. In Q1 2022, the portfolio experienced same-store operating margin of 66%. The current loss-to-lease is about 13.5%, likely creating a runway of revenue increases for another year at least.
Over the trailing 12 months, EQR has seen a substantial uptick in the percentage of residents who renew their leases, and in the occupancy rate. This is important to their strategy.
Company investor presentation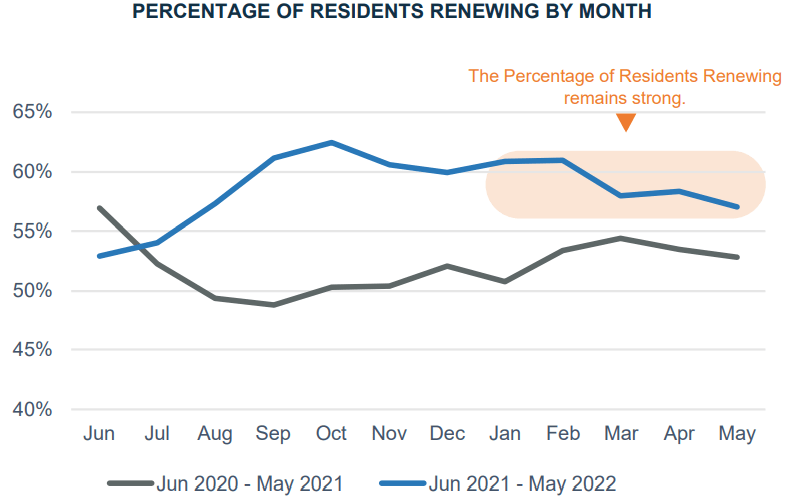
Company investor presentation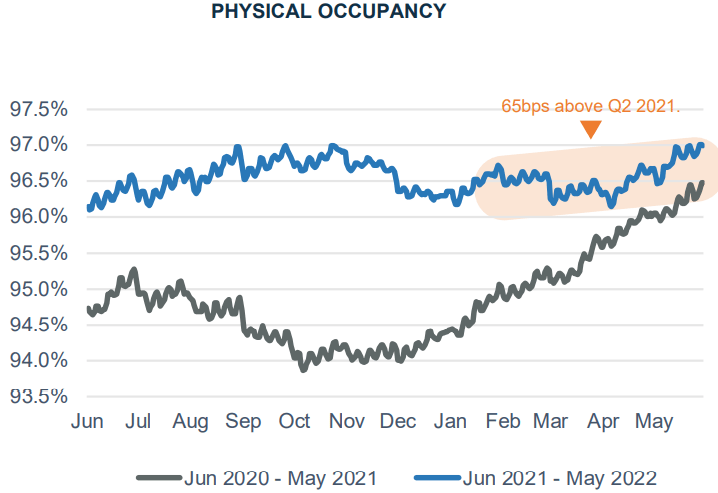
Their strategy is to attract affluent, long-term renters. These are people who rent by choice. Thus, EQR seeks markets with superior high-wage job growth, and housing prices that are high and rapidly rising.
The average monthly rent on new EQR leases is $3170 as of May, which annualizes to $38,000 per year, so if that becomes the average lease portfolio-wide, tenants will need an income of about $190,000 (substantially above the national average) to have 5x rent coverage on an EQR apartment. Affluent, yes.
Long-term? Maybe. Lease turnover in Q1 2022 was just 8.7%, down 100 basis points YoY (year over year), the lowest quarterly turnover in the company’s history. A bit more than half of EQR residents have renewed their leases over the past two years, and that trend continued in Q1 2022, as we will see below.
The company says the 2022 average rent amounts to only 19.5% of tenants’ average household income of $166,000. Thus, EQR tenants bring in 80% more than the average U.S. household.
Company investor presentation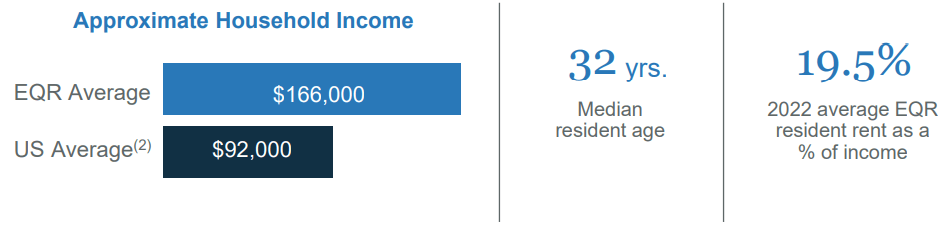
About 84% of EQR tenants are one- or two-person households.
Company investor presentation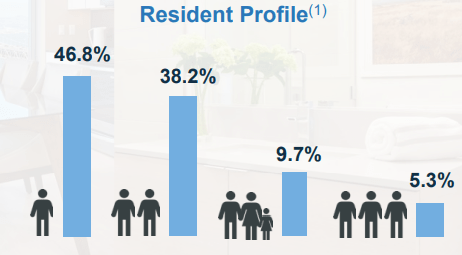
The company grows revenues via acquisitions, ground up new developments, densifying developments, and accretive renovations.
Predictably, EQR is constantly seeking newer properties and disposing of older ones. Since 2018, the company says it has raised $4.6 billion by selling properties, at an average disposition yield of 4.2%, and an average unlevered IRR of 9.5%. The average age of disposed properties was 28 years. Meanwhile, they have made $4.0 billion worth of acquisitions, at an average cap rate of 4.4%, and the buildings are only 3 years old on average. In addition, EQR has completed $1.1 billion in new development during that time, at an averaged stabilized yield of 5.3%.
EQR has done an impressive job of staying on the cutting edge of property technology to reduce expenses, maximize revenue, and enhance customer satisfaction, as the timeline below shows.
Company investor presentation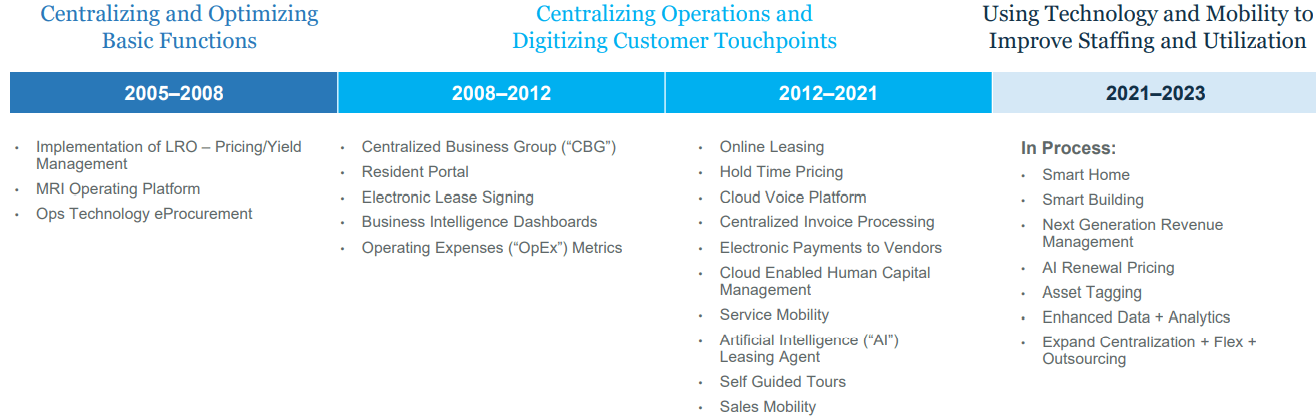
EQR was among the first adopters of a wide array of electronic and computer-driven innovations in real estate. They are now using AI leasing agents and AI renewal pricing, as well as robots to reduce labor costs. Management identifies these 5 long-term enablers as key, going forward:
- Artificial Intelligence
- Data and analytics
- Customer relationship management
- Smart Home
- Mobility/workflow efficiency
Quarterly results
First quarter same-store revenue results were negatively impacted by an increase in delinquency in Southern California. According to CEO Mark Parrell, speaking on the Q1 earnings call:
It appears to us that a relatively small number of Southern California residents, who had previously been good payers, declined to pay rent in order to apply for state rental relief funds. While we remain open to working with residents with true COVID-related hardships, this sort of behavior is not acceptable, and we will continue to work with these residents to obtain our full rental payment.
In spite of this, quarterly results were very healthy. Here are the final numbers, from the earnings call and the company’s 10-Q:
- Occupancy of 96.4%, up 140 basis points YoY
- Renewal leasing spreads averaging 11.9%
- New lease spreads over 15%
- About 60% of expiring leases renewed
- Total revenue of $653 million, up 9.3% YoY
- Operating expense of $225.6 million, up just 2.3% YoY
- NOI (Net operating income) of $427.8 million, up 13.4% YoY
- Earnings per share $0.19, up 26.7% YoY
- Net cash from operations $368 million, up 6.4% YoY
- Same-store NOI $391.6 million, up 10.8% YoY
- FFO available to common shares $301 million, up 16.9% YoY
In the first quarter, EQR acquired just one property with 172 apartments, for a price of $113 million, with an acquisition cap rate of 3.5%.
More recent developments
EQR sold a 19-year-old apartment building in New York City for $26.7 million, or $944 per square foot, realizing a disposition cap rate of 3.3%.
Growth metrics
Here are the 3-year growth figures for FFO (funds from operations), TCFO (total cash from operations), and market cap.
| Metric | 2018 | 2019 | 2020 | 2021 | 3-year CAGR |
| FFO (millions) | $1205 | $1311 | $1238 | $1151 | — |
| FFO Growth % | — | 8.8 | (-5.6) | (-7.0) | (-1.52) |
| FFO per share | $3.25 | $3.49 | $3.26 | $2.99 | — |
| FFO per share growth % | — | 7.4 | (-6.6) | (-8.3) | (-2.74) |
| TCFO (millions) | $1356 | $1457 | $1265 | $1260 | — |
| TCFO Growth % | — | 7.4 | (-13.2) | (-0.4) | (-2.42) |
| Market Cap (billions) | $24.4 | $30.1 | $22.1 | $33.9 | — |
| Market Cap Growth % | — | 23.4 | (-26.6) | 53.4 | 11.58 |
Source: Hoya Capital Income Builder, TD Ameritrade, CompaniesMarketCap.com, and author calculations
As you can see, the company was growing FFO and cash flow in high single digits in 2019. The pandemic dealt those figures a blow in 2020, from which they have not quite recovered. As a result, 3-year FFO and TCFO growth rates are slightly below zero.
Thanks to the sell-off YTD, market cap has declined to $25.9 billion, essentially flat from the end of 2018.
EQR is guiding for $3.41 FFO per share at the midpoint this year, and a 12% increase in NOI.
Meanwhile, here is how the stock price has done over the past 3 twelve-month periods.
| Metric | 2019 | 2020 | 2021 | 2022 | 3-yr CAGR |
| EQR share price June 13 | $77.93 | $63.57 | $80.75 | $69.33 | — |
| EQR share price Gain % | — | (-18.4) | 27.0 | (-14.1) | (-3.82) |
| VNQ share price June 13 | $89.65 | $80.63 | $105.08 | $87.99 | — |
| VNQ share price Gain % | — | (-10.0) | 30.3 | (-14.3) | (-0.62) |
Source: MarketWatch.com and author calculations
EQR shares have underperformed the Vanguard Real Estate ETF (VNQ) by 320 basis points per annum over the past 3 years.
Balance sheet metrics
Here are the key balance sheet metrics.
| Company | Liquidity Ratio | Debt Ratio | Debt/EBITDA | Bond Rating |
| EQR | 2.24 | 20% | 5.6 | A- |
Source: Hoya Capital Income Builder, TD Ameritrade, and author calculations
This is a sterling balance sheet, with a liquidity ratio and a debt ratio better than both the Apartment REIT and overall REIT averages, and a stellar bond rating of A-.
The weighted average interest rate on the company’s $250 million of secured debt is 3.33%. Weighted average interest on unsecured debt is 3.61%. Total mortgage debt is approximately $2.2 billion, and unsecured debt just under $6.0 billion, for a total indebtedness of $8.16 billion.
EQR has a $2.5 million unsecured revolving credit facility, with $2.37 million of that still available.
Dividend metrics
Equity Residential is a solid dividend payer, a little better than the average Apartment REIT, and very close to the REIT average overall, and did not cut or delay its dividends in pandemic-stricken 2020.
| Company | Div. Yield | Div. Growth | Div. Score | Payout Ratio | Div. Safety |
| EQR | 3.61% | 3.3% | 3.98 | 70% | C- |
Source: Hoya Capital Income Builder, TD Ameritrade, Seeking Alpha Premium
Dividend Score projects the Yield three years from now, on shares bought today, assuming the Dividend Growth rate remains unchanged.
Valuation metrics
Like most Apartment REITs, EQR is trading at a slight premium to FFO, but a substantial discount to NAV.
| Company | Div. Score | Price/FFO | Premium to NAV |
| EQR | 3.98 | 23.0 | (-19.1)% |
Source: Hoya Capital Income Builder, TD Ameritrade, and author calculations
What could go wrong?
New apartment supply in the Sunbelt markets where EQR is establishing a foothold could dampen rent growth in those properties.
Further increases in interest rates could make profitable acquisitions more difficult to find.
Continued increases in labor costs, and supply chain disruptions, could drive up the cost of new development, renovations, and capital expenditures.
Investor’s bottom line
The Seeking Alpha Quant ratings show EQR as a Hold.
Seeking Alpha premium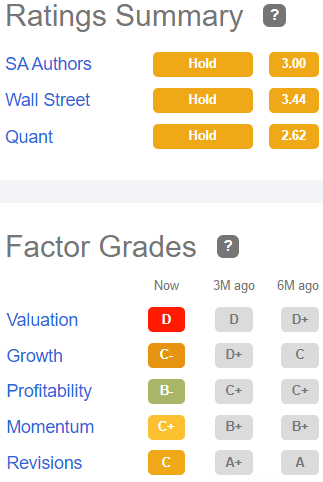
Of the 25 Wall Street analysts that cover this company, 19 grade it a Hold also, with the average price target listed at $89.33, implying 29.9% upside. TipRanks, Ford Equity Research, and The Street are all Neutral on this company, as is Zack’s.
I tend to agree. From a value standpoint, the Yield is average, and not enough to keep pace with inflation, and the price a little elevated. EQR is more of a growth proposition, and growth has gone out of style for the time being. Meanwhile, the company’s revenues are improving, the balance sheet are solid, and EQR is nearly out of the COVID woods, so it is as solid a Hold as any other REIT.
Be the first to comment