

clubfoto/iStock via Getty Images
Thesis: Fair Price For A Wonderful Compounder
Equity LifeStyle Properties (NYSE:ELS) boasts that it owns “the highest quality portfolio of manufactured home (“MH”) communities, recreational vehicle (“RV”) resorts, campgrounds and marinas in North America.”
With nearly 450 properties comprising ~170,000 individual sites as well as an enterprise value of ~$16.5 billion, ELS is also one of the largest REITs focused on manufactured housing (or mobile homes), aside from Sun Communities (SUI) at about $25.5 billion in enterprise value.
Since 2005, ELS and SUI have put up almost identical total returns, which have dramatically outpaced the total returns offered by the S&P 500 (SPY) and Vanguard Real Estate ETF (VNQ).
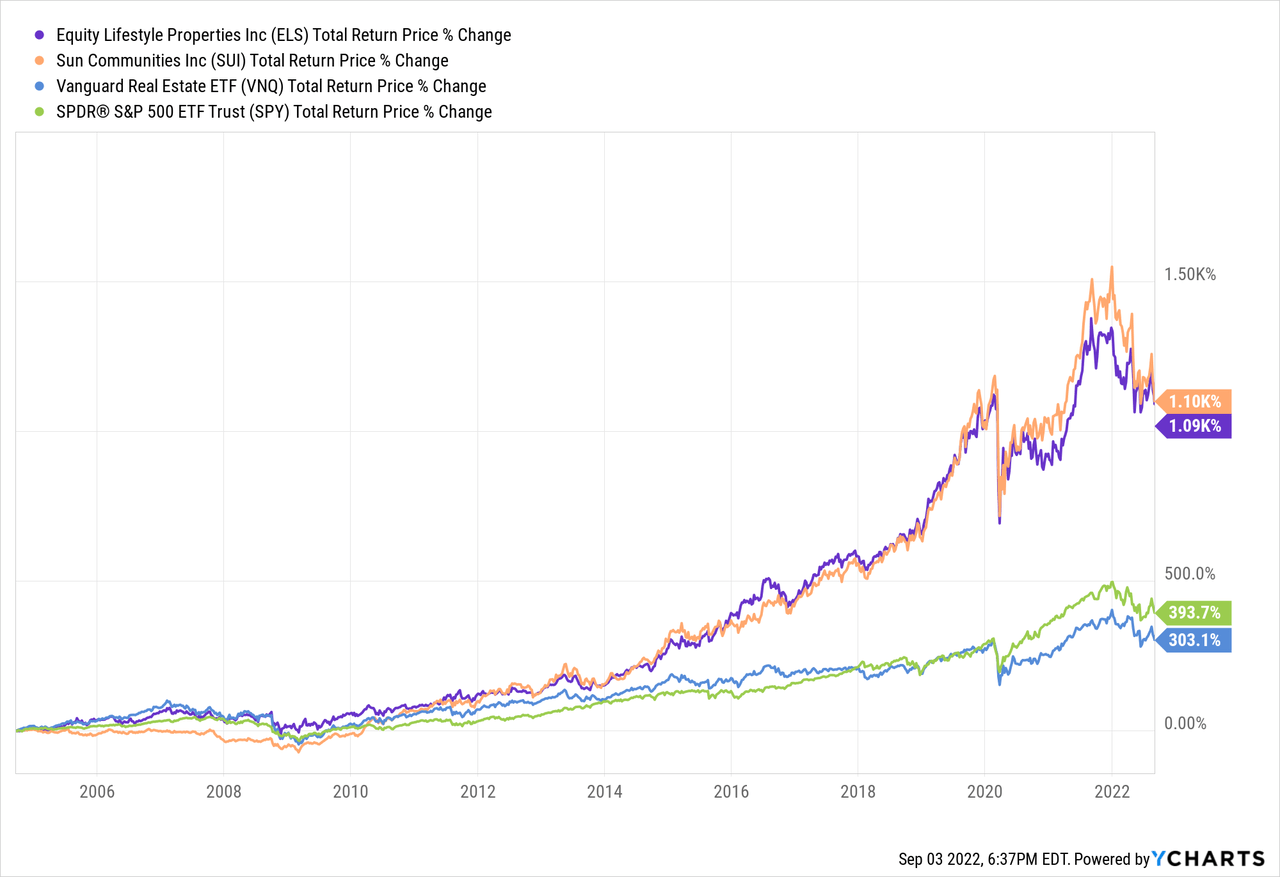
Year to date, however, ELS has shed some 20% of its value, which causes one to wonder if now is the time to buy.
At an estimated normalized FFO per share of $2.73 for 2022, ELS is now trading at a price to FFO of 25.6x. That may sound high, but it is actually low compared to the 30x or higher FFO multiple the blue-chip REIT has traded at in recent years. It is also relatively low considering ELS’s excellent track record of sustaining little to no damage during recessions.
ELS’s dividend yield may be only 2.3%, but the REIT has a 17-year record of growing the dividend annually, and in the last five years that growth rate has averaged 11% per year. From 2006 through 2021, the dividend has grown at an average rate of 22% annually!
Even after such a long streak of high dividend growth, ELS’s payout ratio is still only 60%, leaving plenty of room for further dividend hikes in the years to come. That gives me a high degree of confidence that ELS will become a Dividend Aristocrat in 8 years’ time.
At around $70 per share, ELS makes a great buy-the-dip opportunity for long-term dividend growth investors.
Portfolio & Performance
Despite being known as a manufactured housing REIT, mobile home communities actually make up a little less than half of ELS’s total portfolio.
Here’s how the portfolio breaks down:
- RV Parks: 49%
- MH Communities: 46%
- Marinas: 5%
Most of ELS’s residential communities are age-restricted (55+) or otherwise geared toward older adults in retirement. In theory, that positions the portfolio well to benefit from aging demographics in the US.
ELS Presentation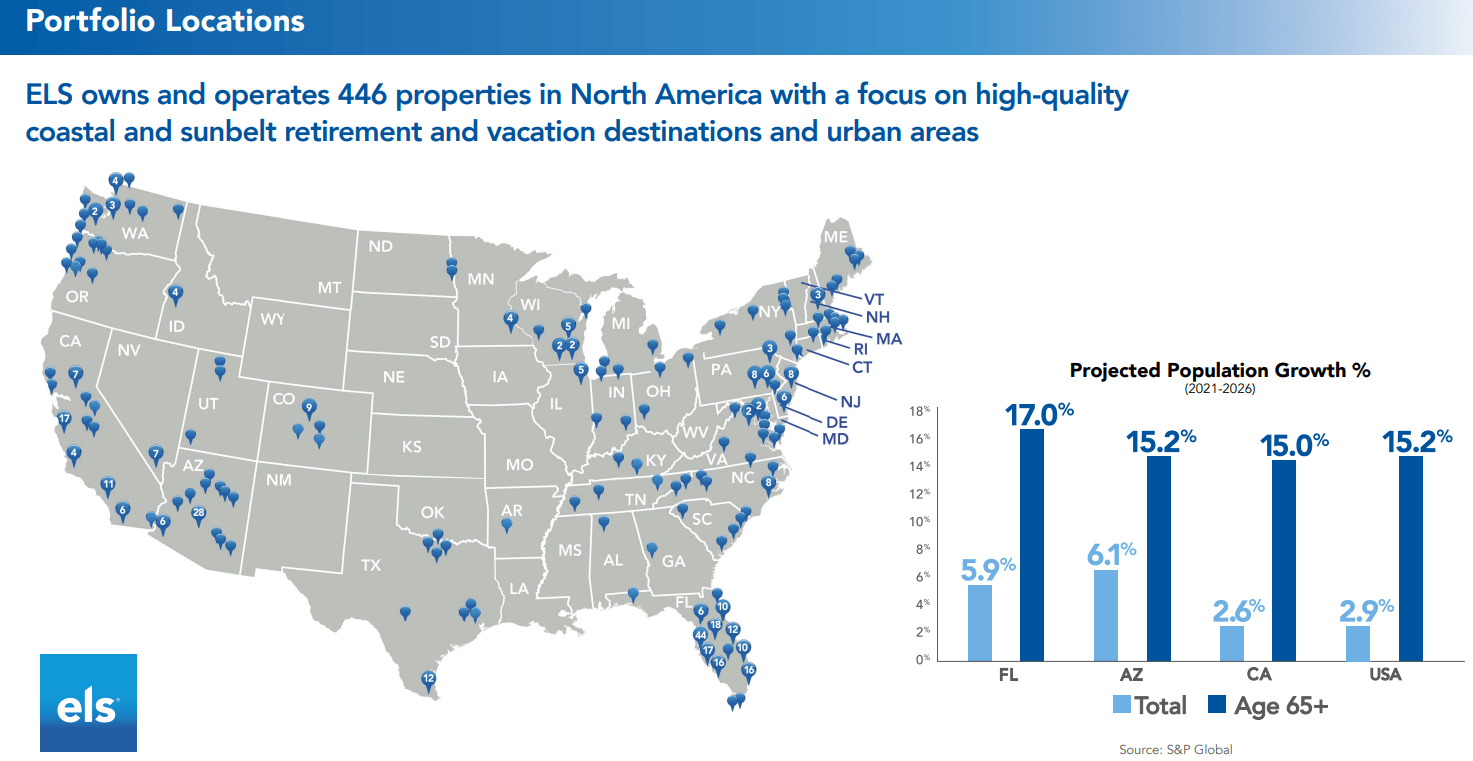
Moreover, perhaps somewhat surprisingly for the RV parks segment, the vast majority of revenue comes from annual sources such as a lot with a one-year lease at a mobile home community or an RV park. While some of its RV parks are largely geared toward travelers and vacationers, the majority are instead geared toward long-term living arrangements.
ELS Presentation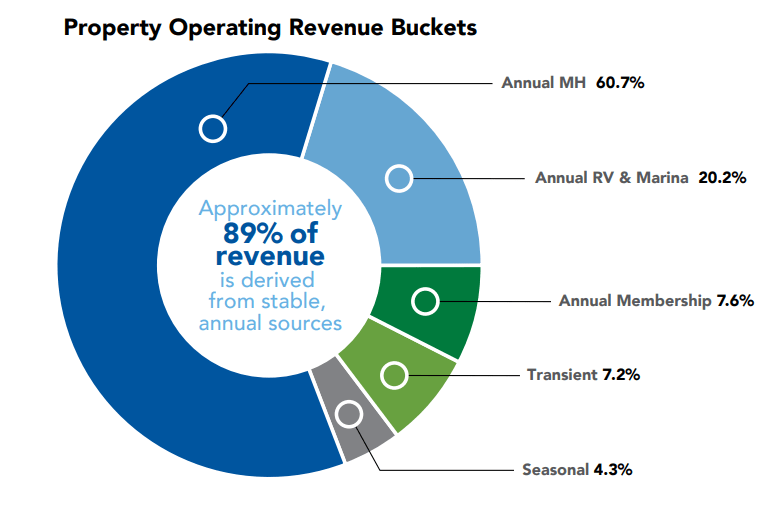
Even the marinas tend to have year-long leases.
As such, though 11% of the portfolio is exposed to the more volatile travel sector, most of ELS’s portfolio is residential in character. That is, even at the RV parks, most of ELS’s rental revenue comes from long-term residents rather than short-term vacationers.
And since housing is fungible – that is, one form of housing is easily replaceable by another from the resident’s perspective – ELS is a beneficiary of the broader housing shortage.
ELS Presentation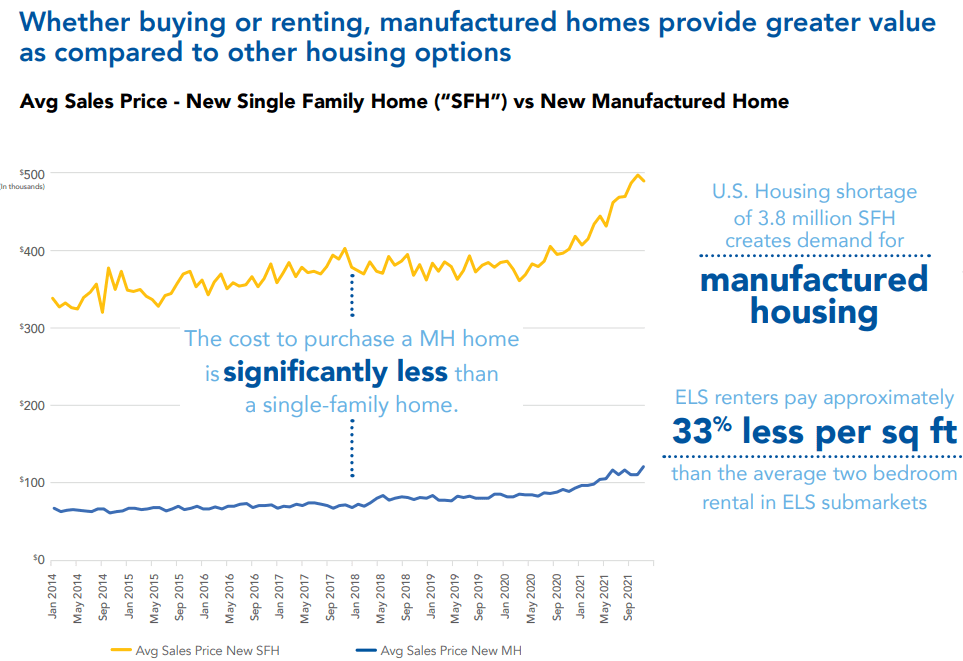
This is true both because the overall cost of living in a manufactured home is so much lower than for a single-family dwelling, but also because mobile home communities are also part of the housing shortage. In other words, developers have underbuilt MH communities just as they have underbuilt single-family homes.
ELS Presentation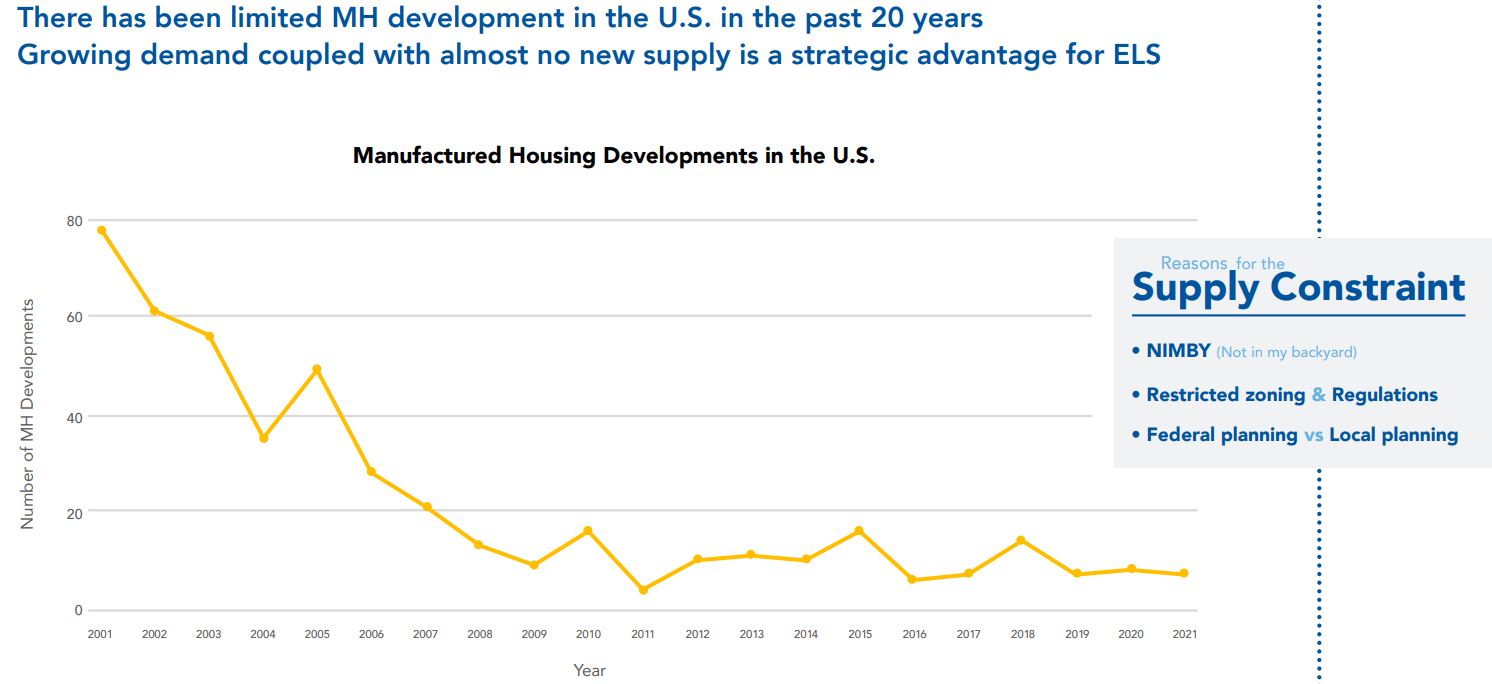
Zoning is a huge reason for this. Local authorities are typically incentivized to zone their areas in a way that maximizes tax revenue via property taxes, but mobile home communities tend to suppress surrounding property values. A Class A industrial or multifamily property would do a much better job of maximizing tax revenue for a local government.
It isn’t the local authorities’ fault. That’s just how the incentive structure works.
This inherently limited growth in supply gives me confidence that ELS will be able to continue its long track record of steady NOI growth, even though recessions.
ELS Presentation
Notice in the above image that ELS continued to see operating income growth through the recessions of 2001, 2008, and 2020. ELS never dipped into the negative during those recessionary quarters.
Part of my confidence in ELS’s continued ability to execute and generate strong shareholder returns is that the same top management that has been with the company for nearly three decades (namely, the CEO, CFO, and COO) remains in charge today.
ELS Presentation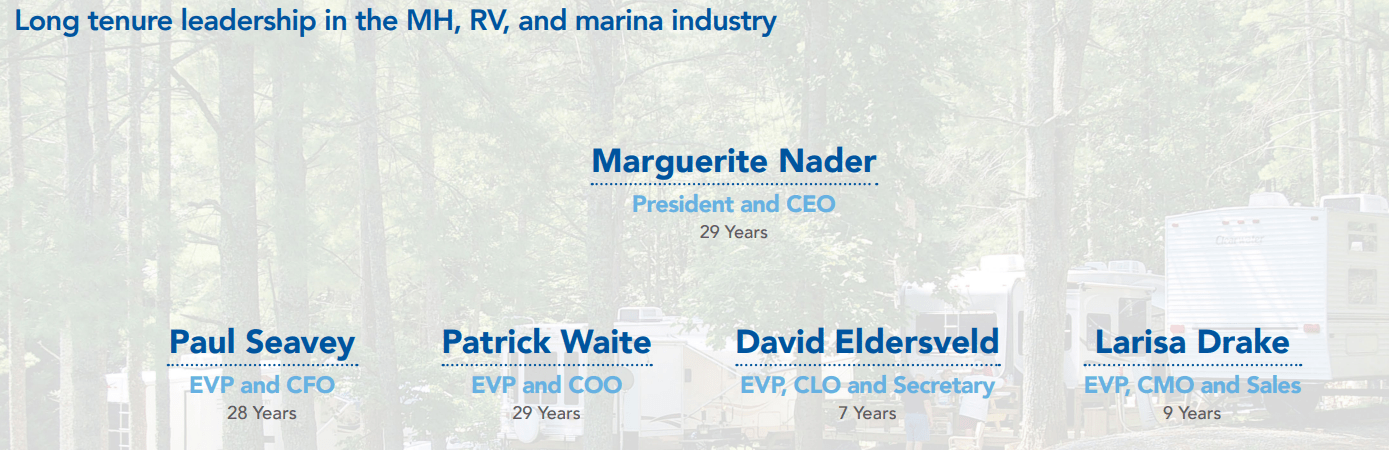
Company culture trickles down from the top, and it helps me sleep well at night as a shareholder knowing that the same culture that has facilitated strong returns in the last few decades still presides today.
Strong Track Record of Performance
Speaking of strong returns, we should probably put some numbers to that.
From 2006 through 2021, normalized FFO per share grew at a compound annual rate of 9%. And, perhaps more impressively, ELS accomplished this strong and steady NFFO per share growth with significantly below-average equity issuance.
Compare the growth of ELS’s shares outstanding to that of SUI and fellow manufactured housing REIT UMH Properties (UMH) from 2006 to 2021:
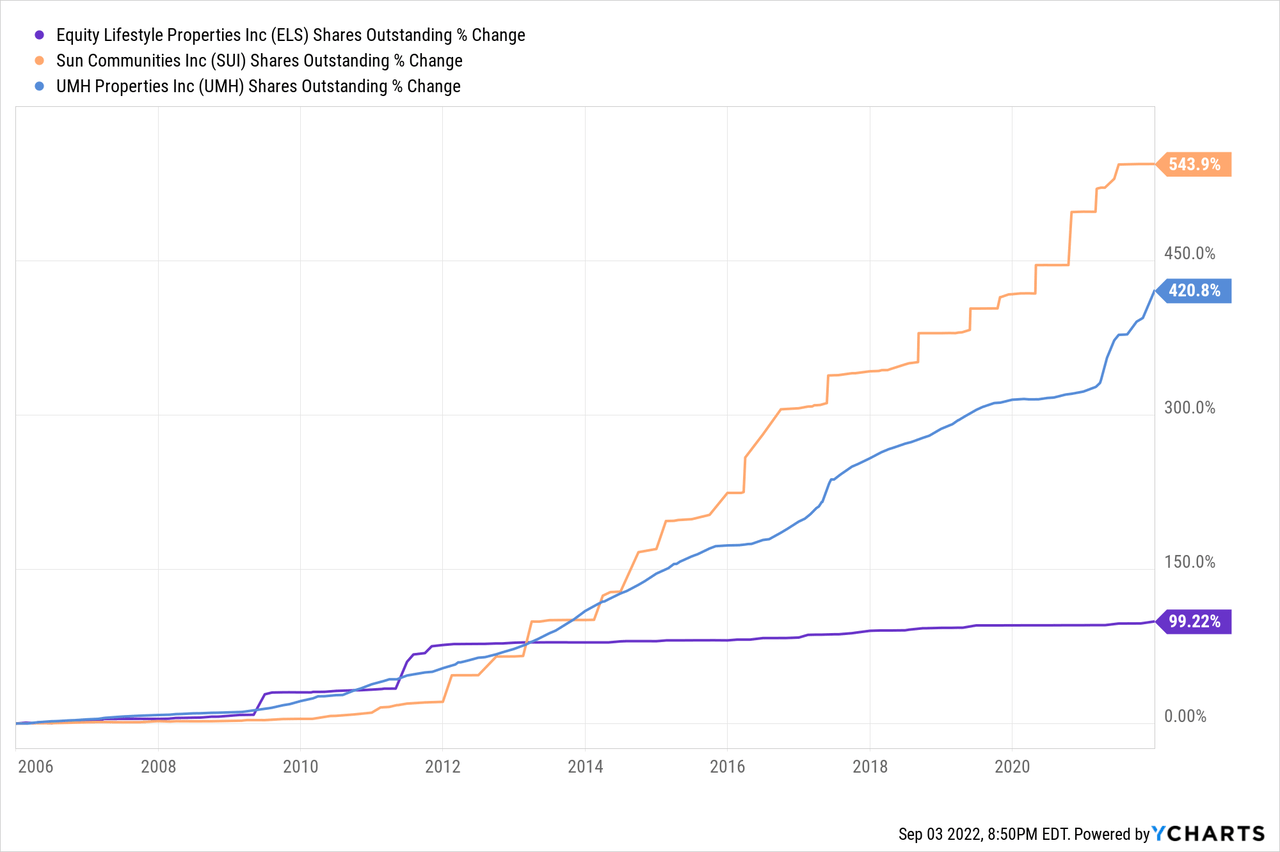
Since 2012, especially, ELS has barely increased its total share count at all, even while continuing to grow its asset base.
So far this year, ELS continued to enjoy strong revenue growth, but NFFO per share growth slowed somewhat in the second quarter.
| Q2 2022 NFFO/sh Growth | 4.9% |
| 1H 2022 NFFO/sh Growth | 9.6% |
The only reason NFFO per share didn’t rise further in Q2 was because of rising operating expenses, namely utility, payroll, and repair & maintenance expenses. For the full year of 2022, management has guided for operating expense growth of 5.2% to 6.2%, which is only a touch below the operating revenue growth guidance range of 5.4% to 6.4%.
I suspect that a large number of ELS’s tenants, many of them living on fixed incomes, would not be able to immediately handle a spike in rent commensurate with the CPI. But as cost-of-living adjustments take effect for pensioners and Social Security recipients, ELS should be able to capture its share of that increase.
In the long run, I have great faith in ELS’s ability to raise rents at a pace commensurate to or faster than inflation. That is exactly what the REIT’s track record has been:
ELS Presentation
Though the period from 2001 to 2021 was not characterized by high inflation as it is today, it’s useful to note that ELS’s same-store NOI growth far outpaced inflation during those two decades.
Equity LifeStyle Balance Sheet
ELS’s quality extends also to its balance sheet, wherein total debt to enterprise value is slightly under 18% and total debt to EBITDA sits at 5.2x (slightly under that for net debt to EBITDA).
Moreover, with an average debt maturity of 11 years, the REIT’s debt appears to be very well-laddered and signaling little danger from rising interest rates.
ELS Presentation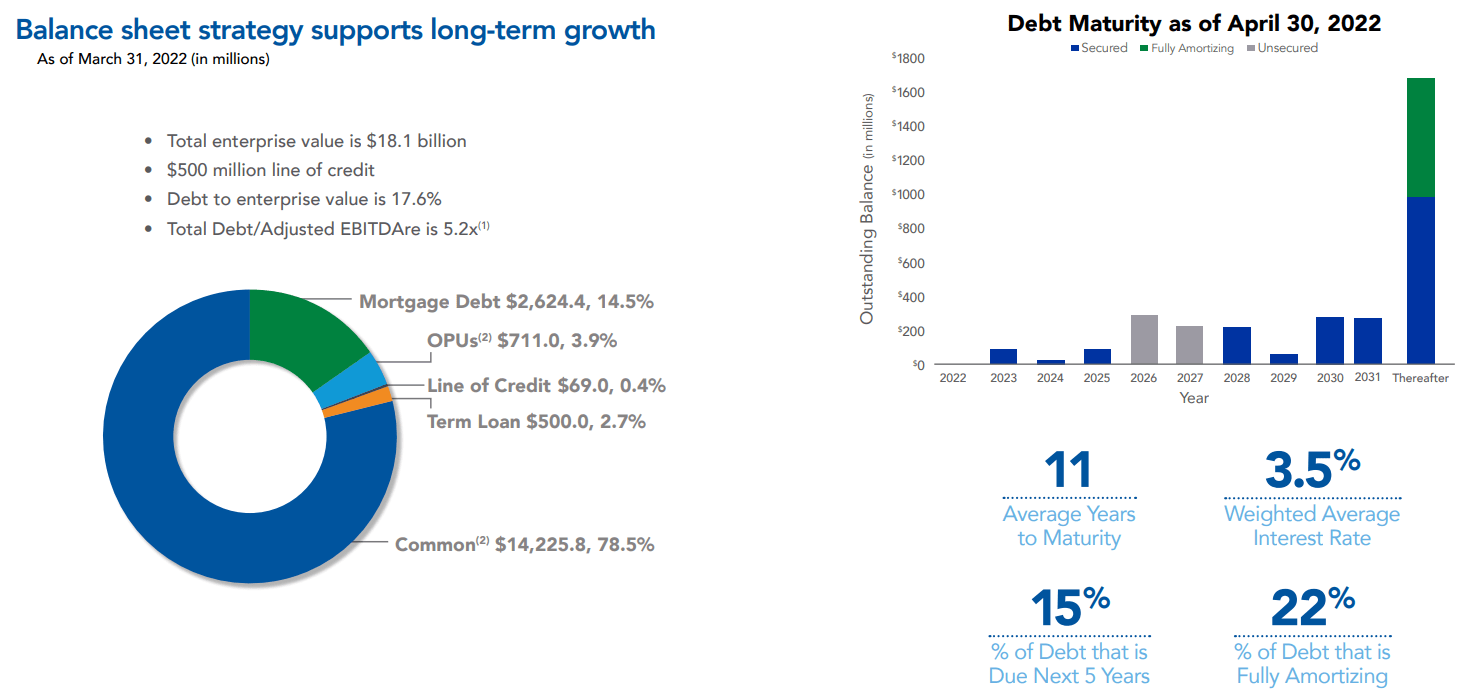
Fixed charge coverage sits at a very comfortable 5.6x, which signifies that the REIT has plenty of financial buffer to withstand rising interest expenses.
Bottom Line
The biggest gripe I think one could levy against ELS is that its pace of acquisitions has slowed from 2021’s $600 million+ level. But last year was an outlier. In normal pre-pandemic years, ELS was acquiring around $200 million to $250 million worth of properties. In the first half of 2022, ELS had acquired $113 million of properties. So, its external growth pace is roughly in line with its pre-COVID average rate of growth.
The other gripe one might raise is faster-than-expected growth in operating expenses. In a time when many residential landlords have managed to tamp down expense growth even while revenue growth soars, ELS is not really enjoying the same surge in net operating income. That said, ELS’s growth has long displayed a slow-and-steady pattern rather than the cyclical rise and fall of other types of residential housing.
Management should be able to raise revenue in excess of expense growth in the long run, even if there is one year of slower NOI growth.
In short, demand for ELS’s affordable living communities should remain stable and rising for many years to come. That makes it highly likely, in my estimation, that ELS will become a Dividend Aristocrat in 8 years when its consecutive annual dividend growth streak goes from today’s 17 years to 25 years.
ELS is the quintessential steady compounder to help you sleep well at night.
Be the first to comment