

Pgiam/iStock via Getty Images
Investment Thesis
Although Equifax (NYSE:EFX) only categorizes 32% of its revenue as mortgage-revenue, a review of the business segments indicates that 70%-80% of EFX’s revenue is closely tied to mortgage & consumer loan originations. As an economic recession in the US seems increasingly inevitable, EFX’s overall revenue will face significant headwinds. In addition, EFX spends about 10% of revenue on CapEx, a figure that has been steadily increasing since 2016. EFX also spends 2-10% of revenue on acquisitions, which we believe should be treated as a real required expenditure to stay competitive in the business. This adjustment lowers free cash flow to firm and therefore implies a lower valuation. Our discounted cash flow model arrives at $129.92, which is 30% below EFX’s current stock price. We assign a moderate sell rating to EFX.
|
Implied Share Price |
$129.92 |
|
Yr 1 Target Share Price |
$136.23 |
Loan Exposure Analysis by Business Segments
We provide a brief overview of EFX and analyze the fundamental driver for each segment. As the company does not specify the revenue mix for international markets, we only analyze its US operations, on the assumption that we can extrapolate the conclusion to other regions.
Image created by author using data from company filing (Company Filing, ZH Advisors)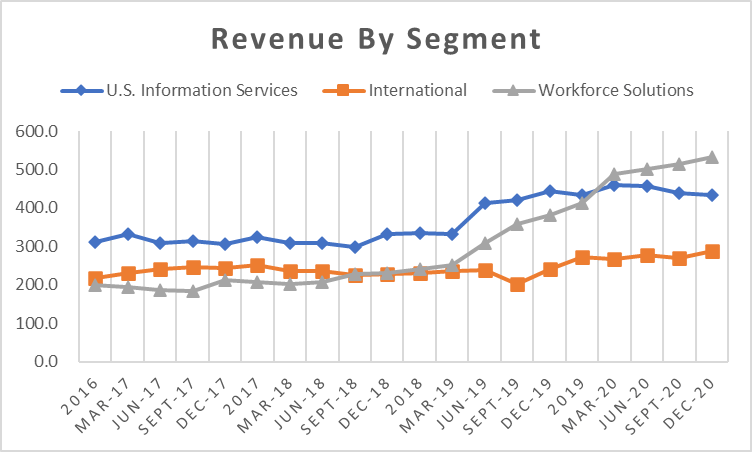
Image created by author using data from company filing (Company Filings, ZH Advisors)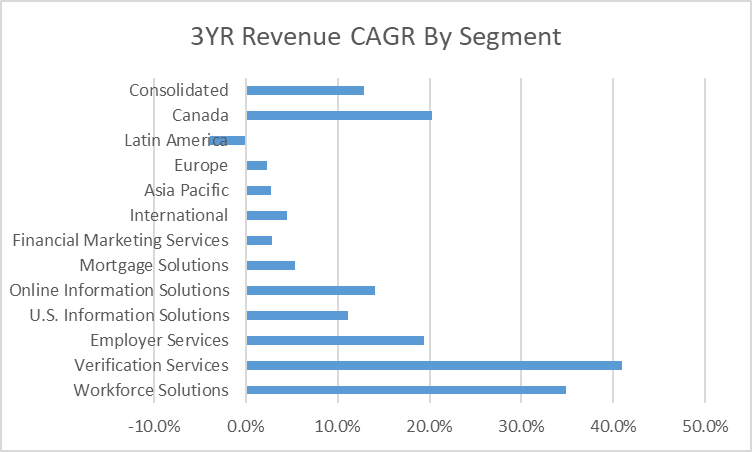
Equifax Workforce Solutions (EWS): 41% of total FY21 revenue
a. Verification Services: 32.7% of total FY21 revenue
Verification service mainly provides employment or income verification. Note that this is a separate segment from credit reporting. For example, a mortgage lender often requires both income/employment verification and a credit report. Typical clients are lenders (mortgage, credit card, auto-loan), government agencies & employers.
Revenue from this segment will be tied to macroeconomic variables such as loan growth and employment rate, with loan growth being the primary driver. This segment has shown rapid growth over the past 5 years (CAGR 24%). Most notably, revenue increased 54% in 2020 and another 40% in 2021. However, total mortgage origination also grew at 17% from 2016-2021. As mortgage origination is projected to slow by 30-40% YoY in 2022, revenue growth will slow significantly.
b. Employer Services: 8.1% of total FY21 revenue
Employer Services is EFX’s outsourced HR solution. The main product is Work Number. The system includes management of various documentation such as tax, payroll, immigration, and others. We expect this segment to be a stable source of revenue. It is difficult for companies to switch once onboarded because employers typically transmit data electronically.
US Information Solutions (USIS): 36% of FY21 revenue
a. Online Information Solutions: 27.4% of FY21 revenue
USIS is the credit reporting segment of EFX. Online Information Service provides basic credit reporting to lenders and other data analytic providers (primarily personal finance end-user market). This segment will be driven by loan origination volume and macroeconomic variables. Although not growing as rapidly as EWS’s verification services, Online Information Solutions also showed a spike during the 2020 mortgage boom. Similarly, as macroeconomic variables cause loan application to decrease, demand for credit reporting will drop commensurately.
b. Mortgage Solutions: 3.9% of FY21 revenue
Mortgage solution is a combined credit reporting and portfolio management tool specialized for mortgage lenders. This product also exhibited similar revenue trends as other mortgage-related segments: a 45% spike in 2020 and a -5% decrease in 2021. In addition to facing a mortgage slowdown, this product also competes with a wide range of different analytics providers. We believe it is difficult to sustain any organic growth in this segment.
c. Financial Marketing Services: 5% of FY21 Revenue
The main business of Financial Marketing Services (FMS) is selling consumer data to advertisers. This segment is not directly related to loan originations. We expect FMS will be the fastest growing segment of the company, although there is apparent risks involved regarding security and fairness. In terms of the overall revenue mix, FMS is also the smallest reporting segment, making it a less significant contributor to overall revenue.
|
Segment |
Product |
Macroeconomic Drivers |
Outlook |
|
Equifax Workforce Solutions |
Verification Services |
Loan Origination, Employment Rate |
Bearish |
|
Employer Services |
Not Applicable |
Stable |
|
|
U.S. Information Solutions |
Online Information Solutions |
Loan Origination |
Bearish |
|
Mortgage Solutions |
Loan Origination |
Bearish |
|
|
Financial Marketing Services |
Discretionary Spending / Ad revenue |
Stable |
Business Segment: Highly Dependent on Loan Origination
EWS (Verification Services), USIS (Online Info Solution), and USIS ( Mortgage Solutions) are all sensitive to changes in loan origination volume. Together, these make up for 83.2% of EFX’s US revenue. A small portion of this revenue are from non-lending sources such as employment verification. After adjusting for those, we conclude that >70% of EFX’s revenue is closely tied to consumer & mortgage loan origination. As we enter a rising rate and lower growth environment, loan originations will decrease, which will in turn present significant challenges to EFX. We will analyze the macroeconomic catalysts in detail in the next section.
Downside Catalyst & Macroeconomic Analysis
The Mortgage Banker Association (MBA) forecasts mortgage origination volume will be down 37% in 2022, and another 6% down in 2023. We hold a slightly more bearish view than MBA due to two economic drivers: low housing affordability and lack of refinancing incentive.
Rising mortgage rates, home prices, and inflation lower housing affordability and new mortgage origination activity. As of July 2022, the 30YR fixed mortgage rate is 5.7%, and the median home sale price is 431K. Compared to 3% and $383K from a year ago, the current rate and home price imply that the home buyer will pay 60% more per month on mortgages for a comparable house. On the other hand, YoY CPI is at a multi-decade high of 8.6%, and the interest rate market is implying a 2.8% compounded annual inflation rate until 2027. Elevated inflation will decrease household disposable income, further lowering demand for new mortgage loans. Combining these factors, new mortgage origination volume should decrease substantially in 2022. If inflation, mortgage rates, and home prices continue to rise, originations might experience more decline than the current economic consensus expects.
Rising mortgage rates also mean almost no existing mortgages are in-the-money for refinancing. According to Freddie Mac, less than $100 billion of 30yr conforming mortgages have rates at or above 5.5%, suggesting that less than 0.5% of mortgage borrowers are incentivized to refinance at the current level. In 2020 and 2021, refinancing accounted for 50-60% of all mortgage originations, a source of revenue for EFX that we believe will soon dry up.
Combining these factors, we are more bearish on future mortgage origination activity than the current consensus economic forecast. Overall, our analysis indicates that both new originations and refinancing will slow considerably; we expect total mortgage origination volume to decline 30-40% in 2022 and 10-20% in 2023. For EFX, since ~70% of its business is closely tied to loan originations, a slowdown will create downward pressure for revenue, at least in the short term. Currently, according to management’s guidance, EFX’s 2022 revenue will increase by 7% YoY, driven by EWS’s 15% growth. Considering headwinds from macroeconomic factors, we think such revenue growth is much too optimistic.
Financial Statement Analysis
Our second sell case comes from EFX’s financial performance. On the surface, the company has historically generated healthy profit margins. EBITDA margin stayed around 35-40% since 2017, and net margin hovered around 10-15% except for 2019 when the company incurred a fine related to a cybersecurity incident. Without any adjustments, the company converts on average 50-60% of EBITDA into free cash flow, an impressive conversion rate. However, we make two important observations.
Image created by author using data from company filing (Company Filing, ZH Advisors)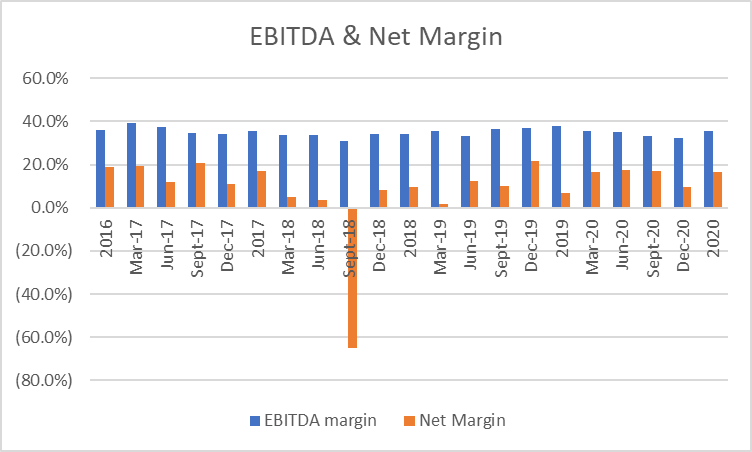
Image created by author using data from company filing (Company Filing, ZH Advisors)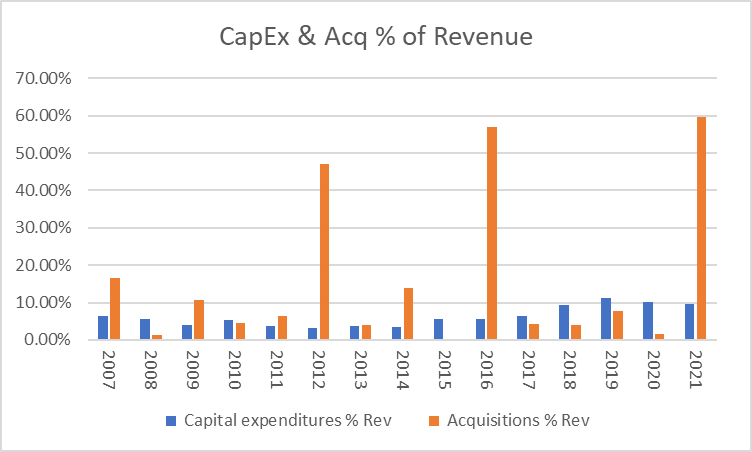
1. CapEx as % revenue has been increasing since 2007.
From 2007 to the early 2010s, CapEx was only 5% – 6% of EFX’s revenue. EFX’s capex generally covers system maintenance, regulatory compliance, and enhancing security and reliability. We see that CapEx as a percentage of revenue notably increased around 2018-2019 following EFX’s data breach, reflecting the increased spending on cybersecurity. In 2022, the company is expected to spend around 11% on CapEx. Although EFX’s capex is not unreasonable compared to the average 15-18% for a software company, EFX is neither a mid-stage high-growth company nor does it have stable earnings (as it’s highly dependent on macro). EFX cannot simply “scale-back” CapEx, because much of the CapEx is required to maintain and enhance the massive but also fragmented software system. As its growth slows, CapEx is expected to become a larger portion of EFX’s revenue, making its true cash flow conversion ratio much lower.
2. Acquisition as % revenue has been around 2% – 10% per year since 2007.
Cash used for acquisitions is typically not included in free cash flow calculations – i.e., the decision to acquire new businesses does not affect the fundamental value of a company. In the case of EFX, however, we believe such acquisition represents a necessary expenditure to keep growing the business, just like CapEx. From 2007 to 2021, the company has spent around 2% to 10% of revenue of acquiring new businesses, with big outflows in 2012 (US, CSC Credit Services), 2016 (Australia, Veda Group Limited), and 2021 (US, Appriss Insight & others). We notice that EFX itself develops very few new products internally, and almost all product offerings are acquired from other companies. EFX then transforms and integrates these acquired services into its larger ecosystem. Therefore, the prudent investor should consider these acquisitions not a use of free cash flow, but a necessary expenditure to achieve growth (let’s call it Business Development Expenditure, DevEx). Put it another way, if EFX stops acquiring any new businesses, it will stop generating any meaningful growth. We assume that around 2-10% of revenue is required to be reinvested for EFX to stay competitive; in reality, however, the average spending since 2007 is closer to 20% factoring in large acquisitions in 2012, 2016, and 2021.
Financial Performance Analysis: Expenditure-Intensive Business
According to our analysis, we find that EFX is a surprisingly expenditure-intensive business. Its CapEx has been growing as a % of revenue, and we believe such trend will continue since spending on security and system integration are key to EFX’s operations. EFX’s business strategy also makes it necessary to spend ~2-10% of revenue on acquisitions of new services (DevEx). Combined, CapEx and “DevEx” are expected to require around 12-15% of EFX’s revenue. Necessary expenditures are important inputs to fundamental valuation, as these don’t show up in a company’s income statement but nevertheless represent real use of cash flow.
Valuation
We make the following assumptions and arrive at a $129.32 per share intrinsic value.
We assume the overall revenue will grow at 5% per year for two years, then linearly ramps up to 10% growth. This is slightly below the company guidance of 7% revenue growth, largely due to our lower growth assumption for all loan-related business segments. As a result, EBITDA is forecasted to grow at 8% CAGR to $2.4B 2027 exit EBITDA. At exit, we expect the company to trade at the current EV multiple of 17X.
We also assume that the company will spend 11-12% of revenue on CapEx from 2022 to 2027, due to increased expenditure on system integration and security. We also assume the company spends 1-4% of revenue on “DevEx” – i.e., necessary expenditure on acquiring other software. Combined, the company converts 20-35% of NOPAT to free cash flow to firm.
Adjusted for non-controlling interest and preferred stock, currently the enterprise value of EFX is $28B. The company trades at a 17.25X EBITDA; 2022 TTM EBITDA is $1.6B. The weighted average cost of debt is 3.90%. The weighted cost of capital is 12.58%.
WACC calculation by author using data from company filing and seeking alpha (Company Filing, Seeking Alpha, ZH Advisors)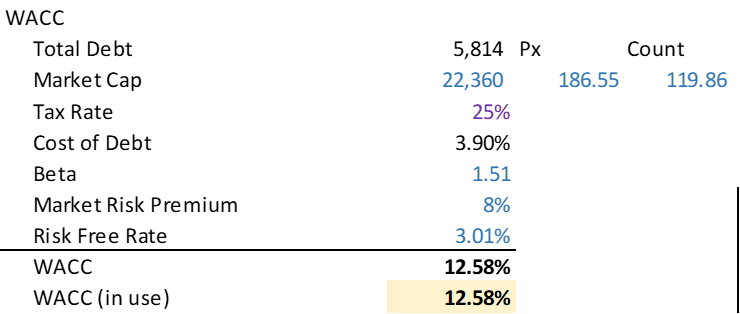
The resulting valuation range is summarized below. The highlighted box suggests that the intrinsic value per share falls between $120-140, which is 30% below the current stock price.
Valuation matrix created by author using data from company filing and seeking alpha (Company Filing, Seeking Alpha, ZH Advisors)
Conclusion: An Expenditure-Intensive Business Dependent On Loan Originations
At first glance, EFX is a growing and profitable business service company with a reasonable valuation. The P/E of 24 appears even undervalued compared to its 25% EPS growth. However, a closer examination indicates that the company’s earnings growth has been primarily driven by macroeconomic tailwinds, which are unlikely to continue in the future. In addition, we believe EFX’s earnings have low quality, as the company must reinvest a large portion of income on capital and business development expenditures. Combining all these factors, our fundamental valuation model arrives at a $129.92 intrinsic value. Since the intrinsic value of the company is 30% below its stock price, we assign a moderate sell rating at the current level.
Be the first to comment