

William_Potter/iStock via Getty Images
Investment Thesis
Since the last boom time in the energy sector, the negative return metrics have put off a lot of investors. We see EQT (NYSE:EQT) are making strong improvements in recent quarters both on top line and bottom line, and it has committed to debt reduction plan in 2023.
Company Overview
EQT, formerly Equitable Resources, Inc., was founded in 1888 and headquartered in Pittsburgh, Pennsylvania. It is a natural gas production company with operations focused in the Marcellus and Utica Shales of the Appalachian Basin, and the largest Nat Gas producers in the U.S. by volume.
Strength
First of all, let’s establish the backdrop that EQT operates in the largest Natural Gas production basin in the U.S., the Appalachian Basin, which accounted for over 40% of the total Nat Gas production in the country.
U.S. Nat Gas Production by Basin (Statista)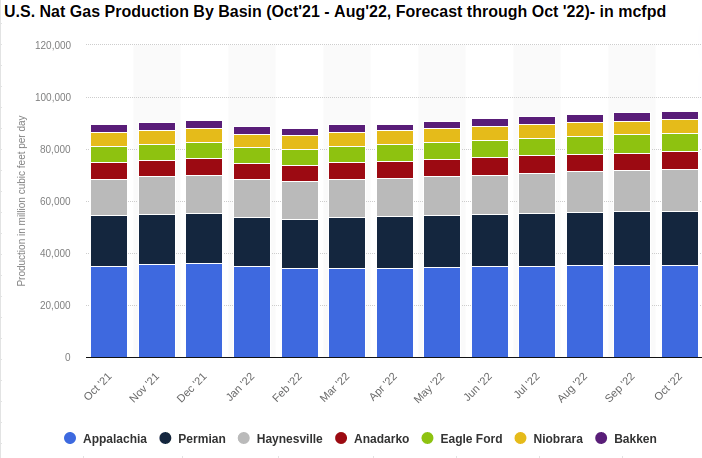
All of the company’s assets and operations are substantially located in this basin. It is a pure-play Appalachian producer.
EQT as Pure-play Appalachian Producer (Company Q3 Presentation)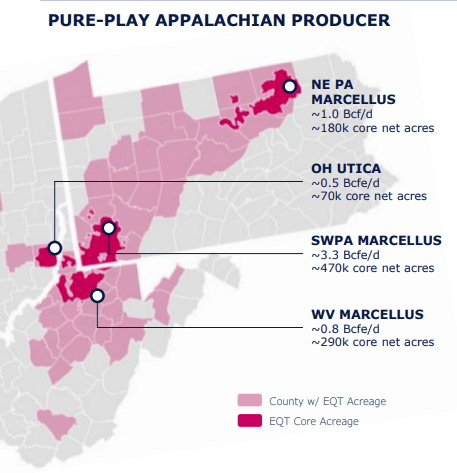
The potential indicated by locating in this resource-rich basin can be seen in its reserves. By the end of 2021, the company’s proved undeveloped reserve was roughly half of its proved developed reserve. Its 2021 total proved reserve increased by 26% YoY due to the acquisition of 4,187 Bcfe from Alta Acquisition and Reliance Asset Acquisition. The pipeline is looking strong ahead.
EQT Proved Developed and Undeveloped Reserves (Charted by Waterside Insight with data from company)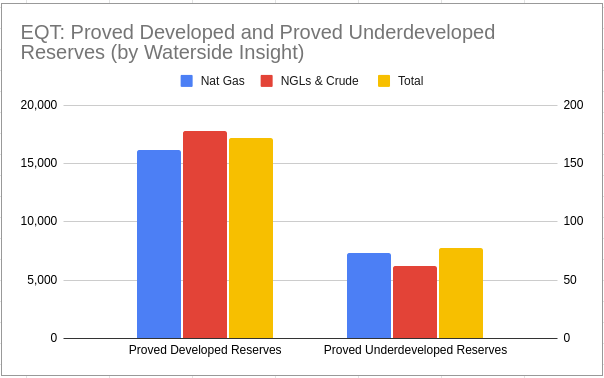
Using NYMEX five-year strip price for gas and oil as of December 31, 2021, EQT has $24,913 Bcfe (billion cubic feet equivalent) total proved reserves with about 2 million gross acres, which translated into $16,059 billion after taxes discounted net cash flow. This is substantially higher than, supposedly, its past five years’ net cash flow. The sum of the past 25 quarters of net cash flow is an outflow of $2.17 billion(see chart below for historical TTM net cash flow ). One can argue about the assumption, but the current cash price of crude oil and nat gas price is largely back at a similar level to the assumed period. And as of the end of 2021, the company does not have any wells with proved undeveloped reserves that had remained undeveloped for more than five years from their time of booking.
EQT TTM Net Cash Flow (Calculated and Charted by Waterside Insight with data from the company)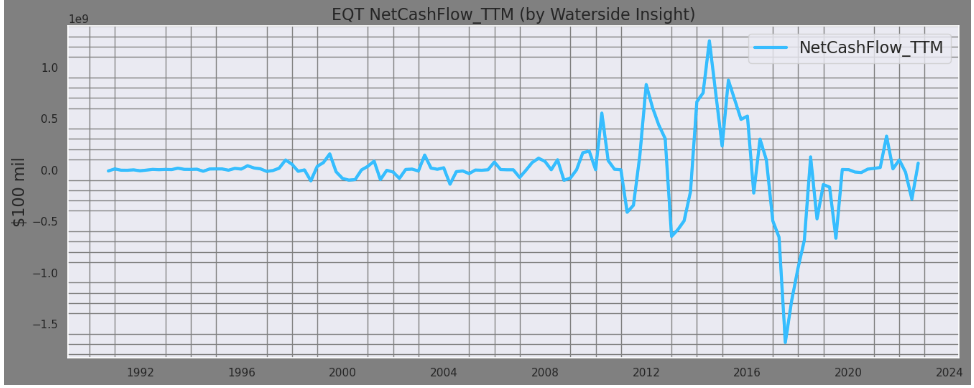
EQT prides itself in its combo-development strategy for being efficient and environmentally friendly. Combo-development basically refers to developing several multi-well pads in tandem, so it generates value across all levels of the process by maximizing efficiency in operation and capital. The base to deliver such a strategy, according to the company, is a digitally-connected operating model and an acreage position that coordinates and enables many aspects of the large-scale operation seamlessly with significant advanced planning.
EQT Combo-Development Example (Company Q3 Presentation)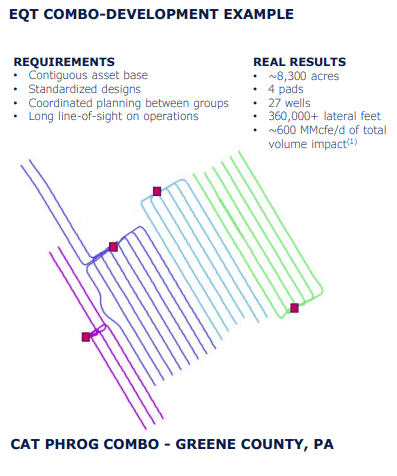
Such advantage of this development strategy can perhaps be best illustrated through its top-line growth and its cost control. EQT has posted strong revenue growth in the past two years. Since the end of 2020, its revenue has almost quadrupled.
EQT Quarterly Revenue (Calculated and Charted by Waterside Insight with data from the company)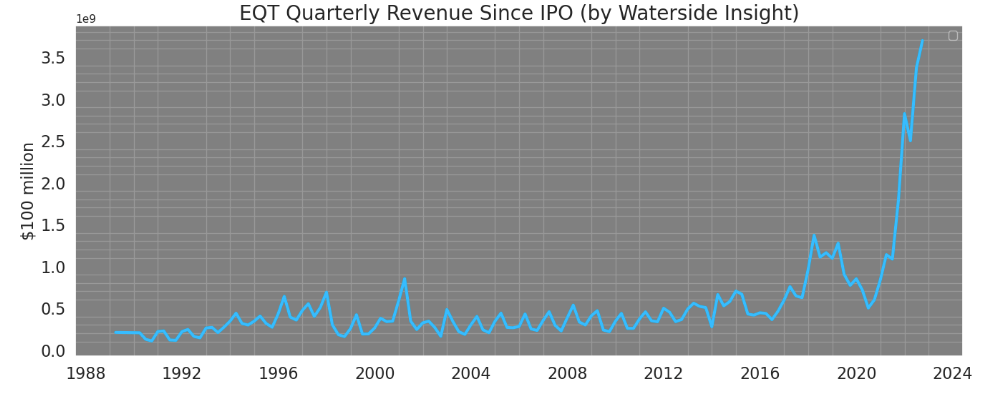
This jump in revenue was due to a rise in both volume and price from the low in 2020, excluding the effects of cash-settled derivatives. And that trend extended into 2022. The company announced a plan centered on producing more liquified natural gas by dramatically increasing natural gas drilling in Appalachia and around the country’s shale basins.
EQT NGLs & Oils Sales Volume vs Average Sales Price (Charted by Waterside Insight with data from company)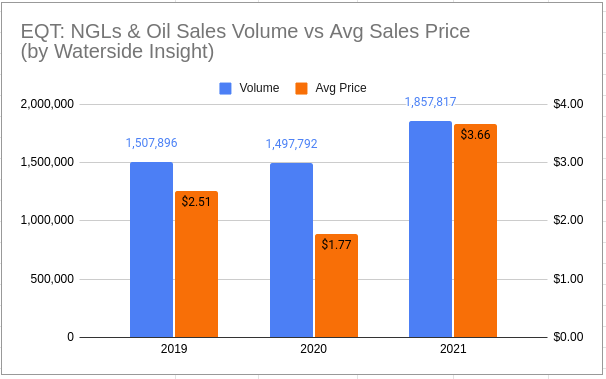
Both the company’s cost or revenue and operating expenses as a percentage of revenue have come down and kept trending downward on a TTM basis.
EQT TTM Operating Expenses over Revenue (Calculated and Charted by Waterside Insight with data from the company)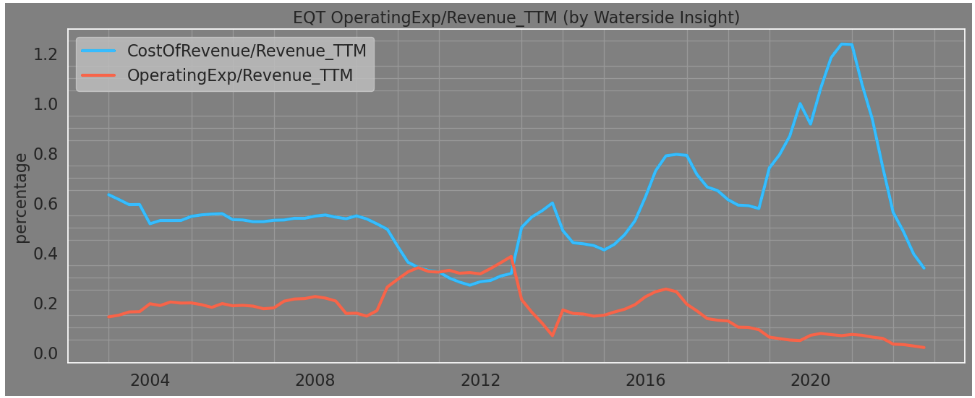
After the steep decline in 2020, both its gross profit margin and EBITDA margin have been improving towards their historical highs.
EQT Margin Analysis (Calculated and Charted by Waterside Insight with data from the company)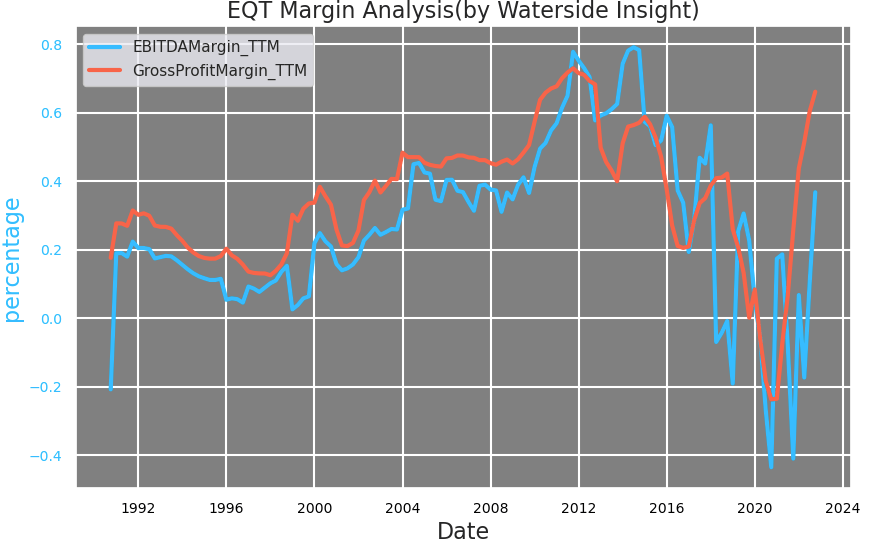
On the spending side, the current capex of EQT has come a long way from the boom days in 2014-2018, and it has shown restraint and control.
EQT TTM Capital Expenditure vs Net Income (Calculated and Charted by Waterside Insight with data from the company)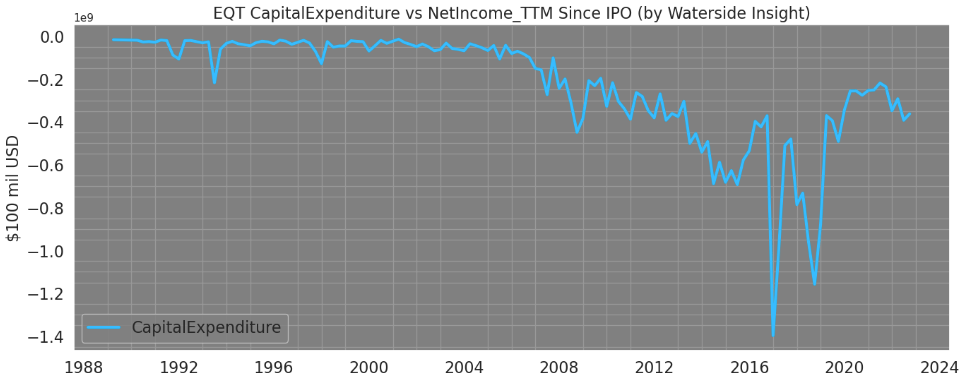
The positive results on the cash flow are apparent. Subtracting capex, its operating cash flow has been on an upward improvement since that pivot in 2016.
EQT Operating Cash Flow Minus Capex (Calculated and Charted by Waterside Insight with data from the company)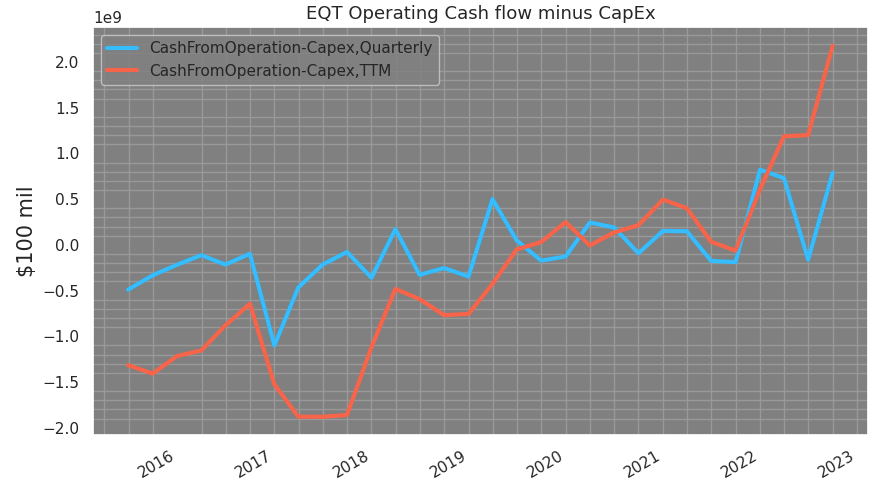
In the meantime, EQT’s free cash flow on TTM basis is through the roof. 2022 marked the best year of its cash flow in the company’s history.
EQT Cash Flow Analysis (Calculated and Charted by Waterside Insight with data from the company)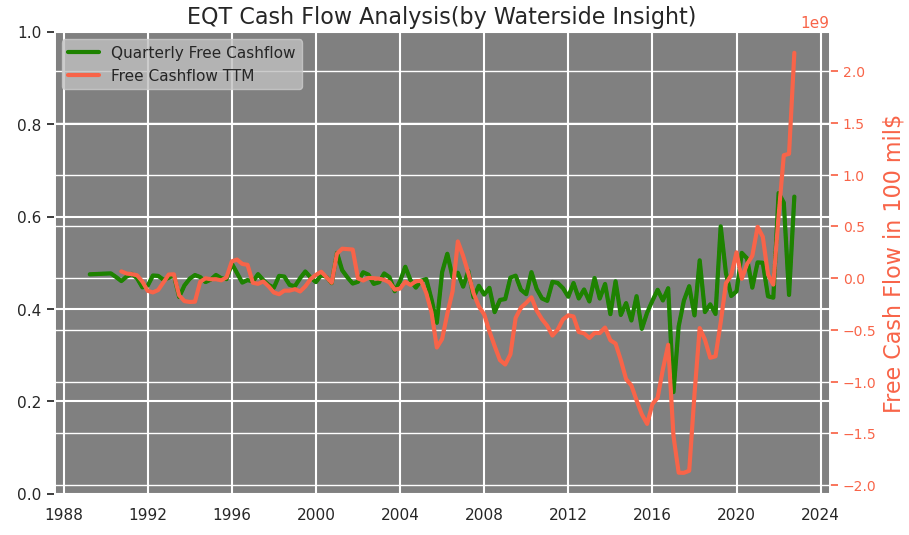
Look ahead, the company plan on making two acquisitions, THQ Appalachia I, LLC (“Tug Hill”) and THQ-XcL Holdings I, LLC (“XcL Midstream”) whereby to which EQT has agreed to acquire Tug Hill’s upstream assets and XcL Midstream’s gathering and processing assets, for total consideration of $5.2 billion. Tug Hill and XcL Midstream are backed by equity commitments from funds managed by Quantum Energy Partners. This is expected to bring 5-10% accretion of FCF per share over the next five years from both Nat Gas assets and Midstream assets, while to bring long-term annual FCF to average $5 billion at the recent strip as of Sep of 2022, according to the company’s own estimates.
EQT Upcoming Acquisitions (Company Q3 Presentation)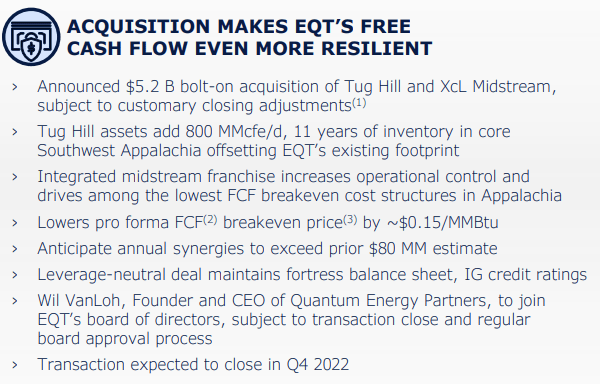
But the deal has been extended for another year to complete on Jan 4. The company’s projection of a 25% free cash flow yield in 2023 would probably be lowered in the following earnings report due to this.
EQT’s shareholder return has been going strong. The company raised dividends sharply in the past three years to its current yield of 1.97%.
EQT Dividend History (Charted by Waterside Insight with data from the company)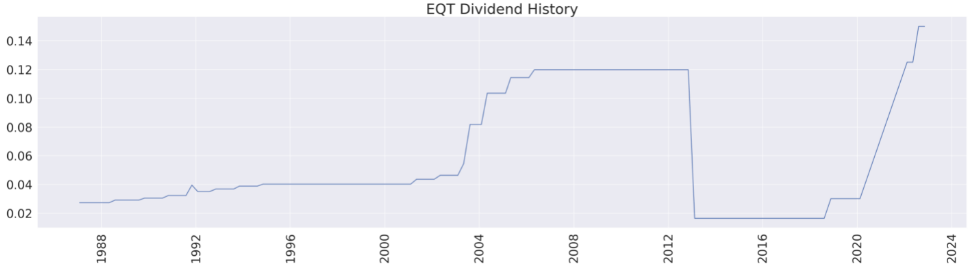
By Q3 of 2022, its YTD total shareholder return reached $1.4 billion. It also raised its share buyback plan to $2 billion from $1 billion initially last year, with $380 million of it executed.
EQT Shareholders Return 2022 (Company Q3 Presentation)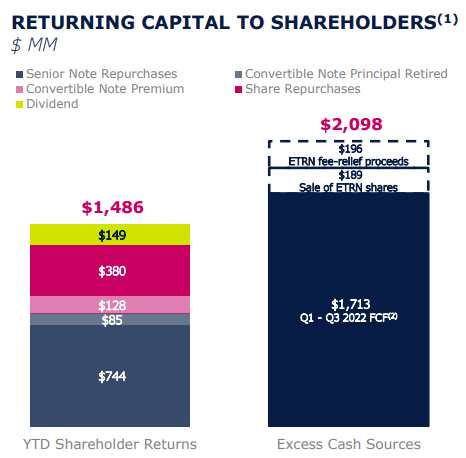
Weakness/Risks
On the risks side, we see EQT’s current asset has dropped below current liabilities by a large portion.
EQT Difference of Current Asset vs Current Liabilities (Calculated and Charted by Waterside Insight with data from the company)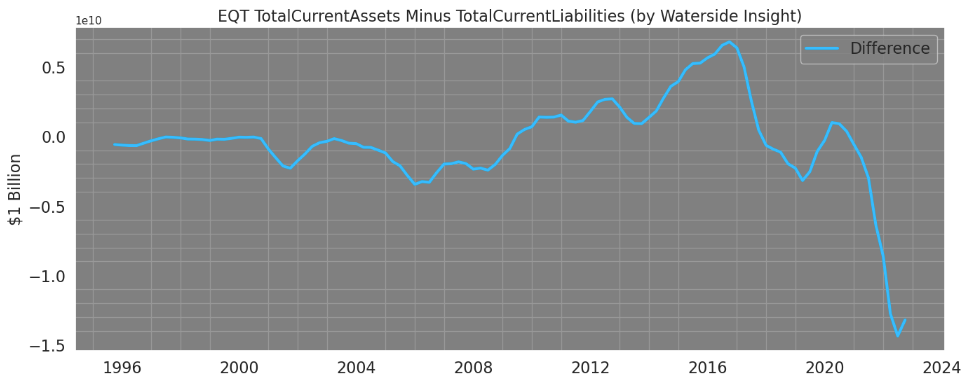
EQT’s cash at hand as a percentage of operating cash flow was just about 7% by the end of Q3. On par to be one of the lowest levels for the company. Its current ratio is only about 0.59X. This is relevant to its dividend payout and share buyback, but also vital that it needs to use the free cash flow generated to plug in its current debt.
EQT Cash at end of Period over Operating Cash Flow (Calculated and Charted by Waterside Insight with data from the company)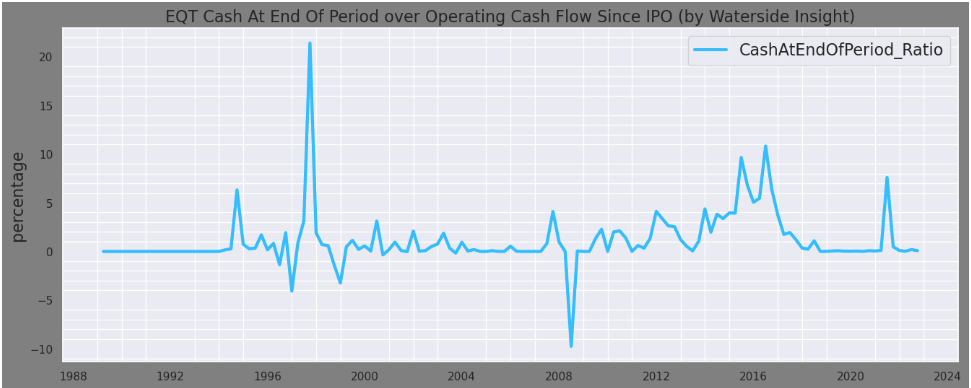
And the company also recognized this as a pressing issue. It has started making large payments toward reducing its debt.
EQT Debt Servicing vs Total Debt (Calculated and Charted by Waterside Insight with data from the company)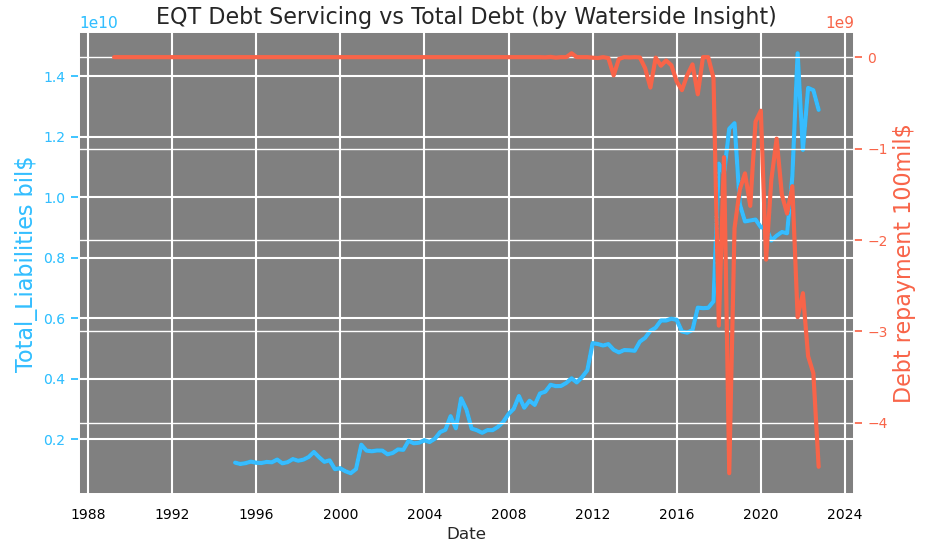
In fact, the company has announced that it will increase its year-end 2023 debt reduction goal to $4B from $2.5B. It would help ease its long-term debt burden but will pressure the earnings as well.
EQT Debt Reduction Target 2022-’23 (Company Q3 Presentation)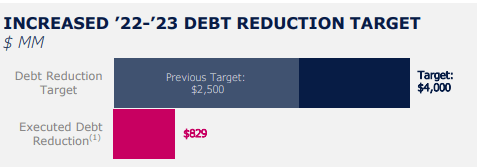
From the macro perspective, in the past 4-5 years, natural gas consumption in the U.S. has been stable without any steep climb. If Nat Gas consumption continues to stay at a similar level, the company is more likely to produce lower EBITDA than otherwise. In the worst case, its EBITDA could be lower by half.
EQT EBITDA vs U.S. NatGas Consumption (Calculated and Charted by Waterside Insight with data from the company, FRED and EIA)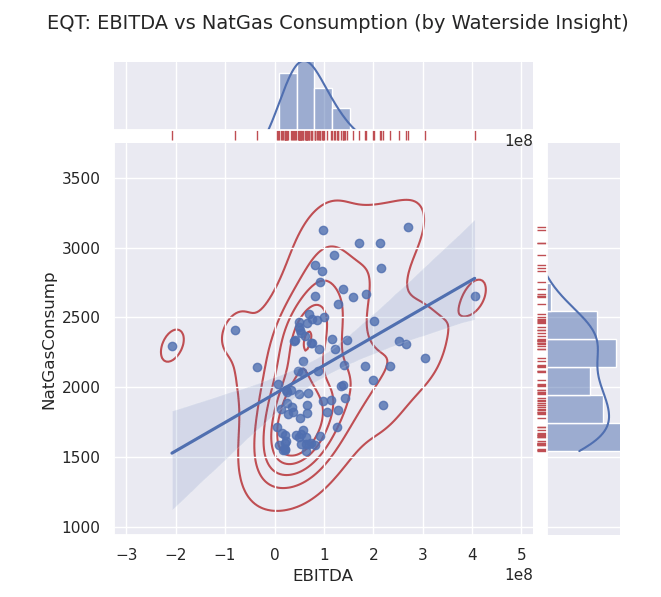
Financial Overview
EQT Financial Overview (Calculated and Charted by Waterside Insight with data from the company)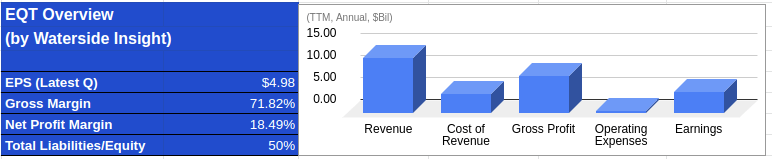
Valuation
EQT stock’s five-year cumulative return has been in line with its peer group, which was underperforming the broader market by about 70%.
EQT 5 Year Cumulative Total Return Comparison (Company 2022 10K)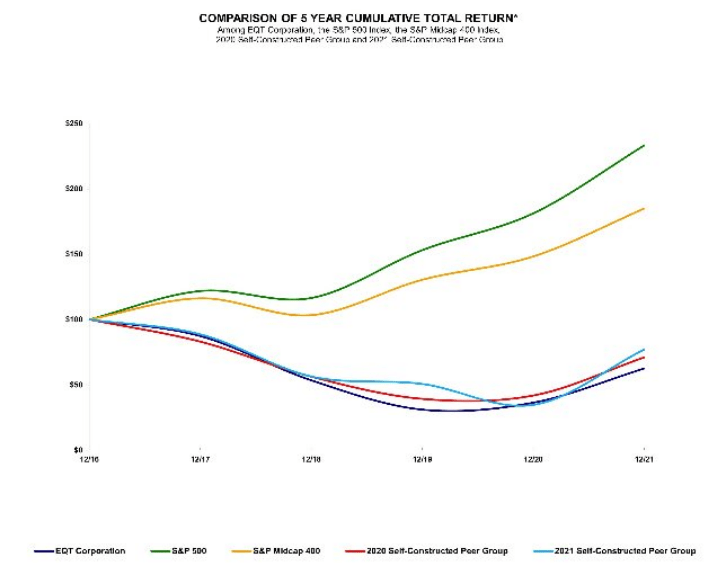
The company’s current return metrics have somehow improved, with its return on tangible capital employed back to positive 16.3% while other return metrics staying leveled.
EQT Return Metrics (Calculated and Charted by Waterside Insight with data from the company)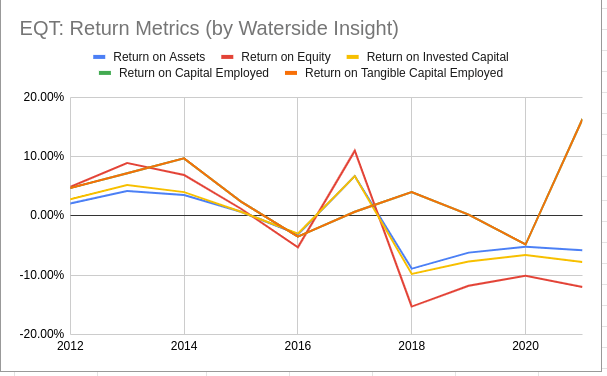
Its valuation metrics are still a far cry from their historical highs, and only price to sales returned to positive.
EQT Valuation Metrics (Calculated and Charted by Waterside Insight with data from the company)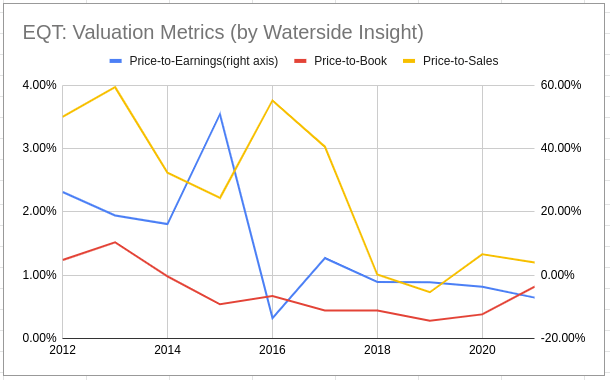
If the broader market comes under pressure, can EQT sustain its current price level or drop further? It depends on its fair value, we think.
We take into account all the analysis above and use our proprietary models to assess the fair value of EQT with a ten-year projection forward. In our bullish case, after accounting for the company’s debt reduction plan, shareholder return commitment and ESG spending and equipment upgrades, we conservatively project several growth bumps along the way, yet the company was able to maintain positive cash flow consistently; it was valued at $51.27. In our bearish case, we more heavily discounted its cash flow due to societal energy transition and government policy restrictions in the long term; it was valued at $38.66. In our base case, the company has a more near-term tailwind from the uncertainty of the current trans-Atlantic energy tight supply situation, while domestic U.S. demand remains stable; it is valued at $46. 59. The current price is trading below our lower-end estimate.
EQT Fair Valuation (Calculated and Charted by Waterside Insight with data from Intuit FactSheet of 2022)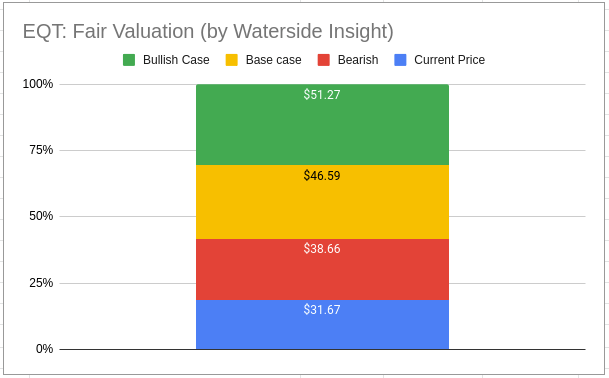
Conclusion
The natural gas giant EQT has come a long way from the years of slumping cash flow, being highly indebted with aggressive expansion, to developing a strong development strategy that is able to achieve economic scale-up and capital discipline. The results are showing almost everywhere in its balance sheets and financials in the latest quarters. Assessing the company’s long-term valuation is no easy task as it has multiple variables with great uncertainty to account for, such as geopolitical risks, energy transition and E&P development cycles, etc. We took a conservative approach and reached a valuation range that was above the market price. Bar any significant missteps from the company, we deem EQT a buy at the current price.
Be the first to comment