

Torsten Asmus
Introduction
Upon entering 2022, inflation had become one of the key worries for investors but as my previous article highlighted back in January, investors could buy the units of Enterprise Products Partners (NYSE:EPD) and collect their high 8% distribution yield for protection. The following months have subsequently seen inflation far exceeding anything reasonably envisioned when the calendar rolled around nine months ago, partly driven by the Russia-Ukraine war. Despite the pain for consumers, fortunately for those on their unitholder register, management has your back in tough times with higher distributions very likely coming to help ease the inflationary burden, as discussed within this follow-up analysis.
Executive Summary & Ratings
Since many readers are likely short on time, the table below provides a very brief executive summary and ratings for the primary criteria that were assessed. This Google Document provides a list of all my equivalent ratings as well as more information regarding my rating system. The following section provides a detailed analysis for those readers who are wishing to dig deeper into their situation.
Author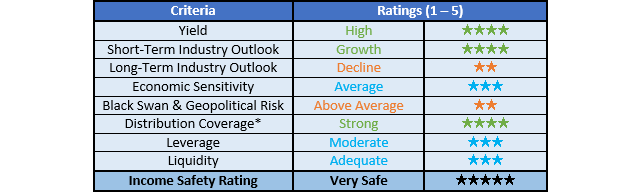
*Instead of simply assessing distribution coverage through distributable cash flow, I prefer to utilize free cash flow since it provides the toughest criteria and also best captures the true impact upon their financial position.
Detailed Analysis
Author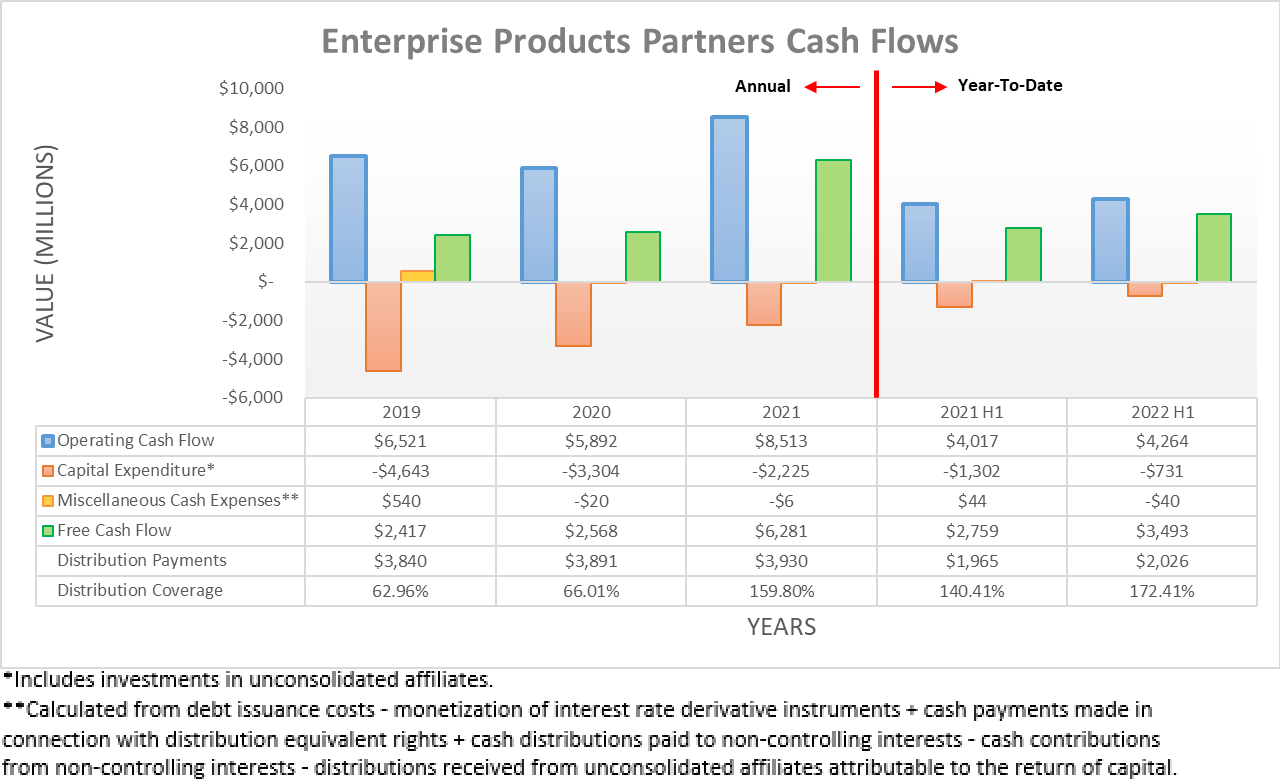
After enduring a bumpy ride during the severe downturn of 2020, thankfully 2021 ended with a very strong recovery. In fact, their operating cash flow of $8.513b easily eclipsed their previous result of $6.521b during 2019 before the Covid-19 pandemic. Very positively, they have built upon this once again during 2022 with their result for the first half landing at $4.264b and thus 6.15% higher year-on-year versus their previous result of $4.017b during the first half of 2021. If removing the impacts of their temporary working capital movements, their underlying operating cash flow during the first half of 2022 was even higher year-on-year at 11.83%, as there was a relatively smaller working capital draw of $218m than one year prior, which was $399m. It is not necessarily practical to ascertain the benefit attributable to inflation versus other causes, although if nothing else, they are seemingly benefitting more than suffering.
Thanks to their accompanying lower capital expenditure during the first half of 2022, more of their operating cash flow was translated into free cash flow than ever before, scaled accordingly for the length of time. This saw free cash flow of $3.493b, which annualizes to $6.986b and thereby easily beats their results during 2019-2021 that varied between $2.417b and $6.281b. When compared to their distribution payments of $2.026b during the first half of 2022, this left their coverage at a strong 172.41% and even if removing their relatively small working capital draw of $218m, it still leaves their distribution coverage at a strong 161.65%.
Thanks to this very solid cash flow performance, they have ample capacity to support their unitholders in tough times by providing a reliable and preferably, growing source of income. When conducting the previous analysis, my investment thesis centered around the idea of their distributions scaling higher along with inflation, thereby providing investors protection from its destructive effects, as per the commentary from management included below.
“On inflation, I want to say over 90% of our revenues have some sort of escalation mechanism in there, which are benchmarked to various indices. So we feel like we have a pretty good protection from inflation.”
“As far as how we think about the distribution, we said — really what we’re trying to achieve is trying to keep to, what is it, purchase power parity.”
-Enterprise Products Partners Q3 2021 Conference Call.
At the time, this was largely untested given inflation was stagnated and often almost non-existent for years but thankfully, management did not back down. After their routine yearly distribution increase back in January 2022, they did not wait another year such as during 2020 or 2021 and instead provided another increase as soon as July, thereby taking its quarterly rate to $0.475 per unit and thus 5.56% higher year-on-year than its quarterly rate of $0.45 per unit one year prior. Whilst inflation is now running even higher at 8%+ in the United States, thankfully they are not ruling out further distribution increases, as per the commentary from management included below.
“…and do a mid-year increase in the distribution and in light of what was going on from an inflation standpoint, we thought it made sense to do a midyear boost. I don’t know if this is necessarily going to change what we do going forward, but we take a look at it every quarter, but we thought it was appropriate this quarter to go ahead and do a midyear bump.”
-Enterprise Products Partners Q2 2022 Conference Call.
Whilst not an exact confirmation, they certainly seem open to making more frequent quarter-to-quarter tweaks to their distributions as they ride the inflationary wave hitting the economy and given their supportive recent actions, it seems very likely that more increases will be forthcoming. Even without benefitting any further from inflation, their strong 160%+ distribution coverage still provides ample scope for further increases, which makes the case even stronger. To provide an example, this means they could actually increase their distributions a massive 50% higher whilst still funding them internally without accessing debt markets. Obviously, a singular move of this magnitude will almost certainly never eventuate but nevertheless, it still highlights the immense potential laying on the horizon that can be tapped to help support their unitholders with higher distributions.
Author
Despite generating plenty of excess free cash flow after distribution payments during the first half of 2022, their net debt still increased modestly to $28.55b versus where it ended 2021 at $26.716b. This merely stemmed from their Navitas Midstream acquisition, which ultimately cost $3.204b and thus without this one-off impact, their net debt would have otherwise trended lower, as should be the case when looking ahead into the second half of 2022 and beyond, barring any further yet-to-be-known acquisitions. Meanwhile, their cash balance saw a far larger change after plunging to only $231m versus $2.819b across these same two points in time. Whilst a relatively massive change, this more so simply realigns their capital structure with its state before the severe downturn of 2020, when they did not carry a significant cash balance, such as its level of $355m at the end of 2019.
Author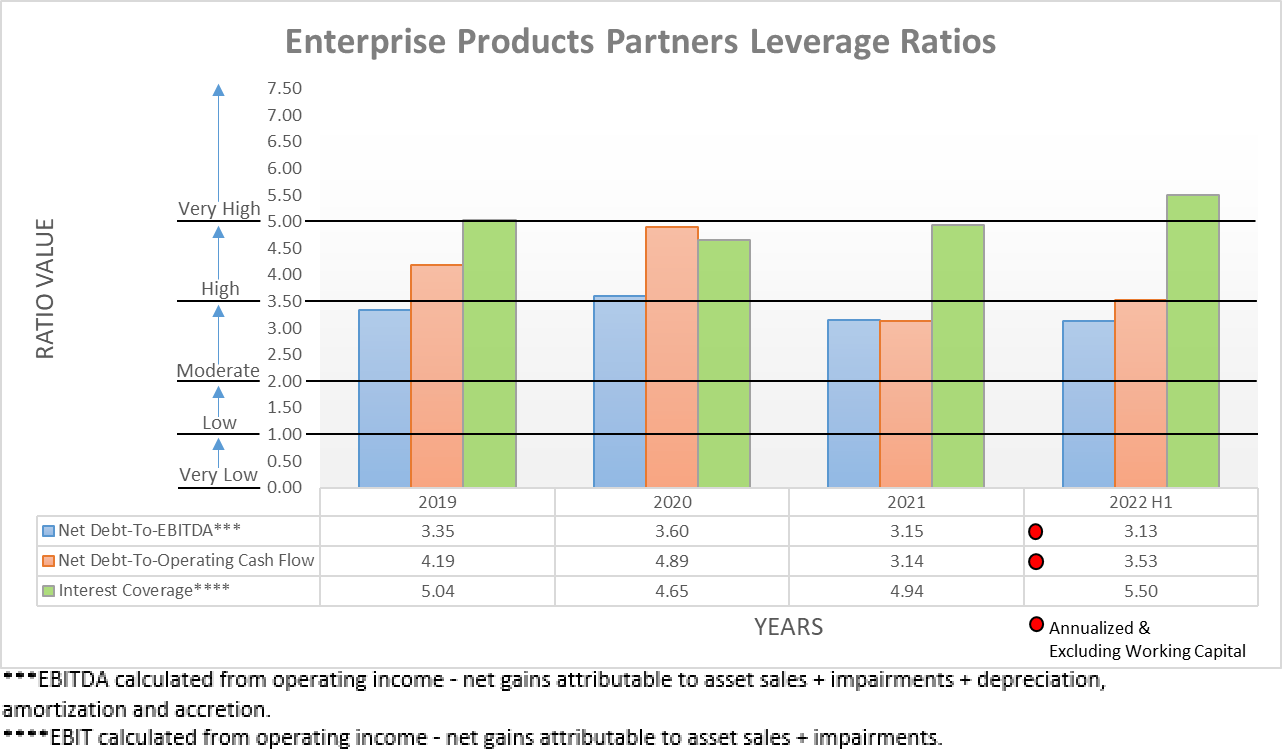
Despite their net debt increasing modestly during the first half of 2022, their leverage barely changed despite the benefits of their Navitas Midstream acquisition not fully reflected within their financial performance. This is primarily evidenced by their net debt-to-EBITDA of 3.13 that is practically equal to where it ended 2021 at 3.15, thereby remaining within the moderate territory of between 2.01 and 3.50. Whilst their net debt-to-operating cash flow increased to 3.53 versus 3.14 across these same two points in time, it should revert lower during the second half of 2022 given their prospects for lower net debt and thus re-enter the moderate territory.
Despite the future remaining uncertain by nature, this healthy financial position provides ample scope to back unitholders during tough times. Apart from obviously providing stability in the event of another severe downturn, it also provides the scope to continue growing via acquisitions without issuing equity and most importantly in these costly times, they can easily afford to continue increasing their distributions to help unitholders handle inflation.
Author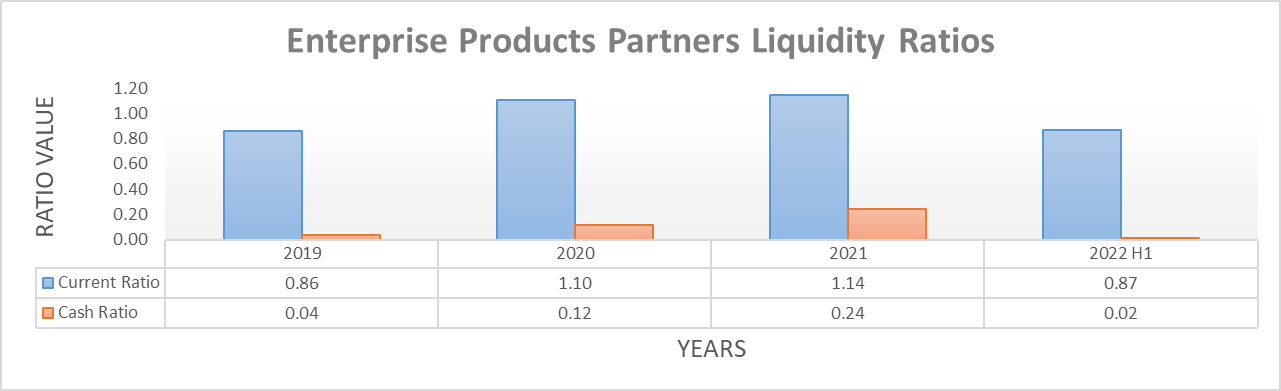
After seeing their cash balance plunge during the first half of 2022, it was already foregone that their liquidity would see a sizeable change with their respective current and cash ratios decreasing to 0.87 and 0.02 versus where they ended 2021 with respective results of 1.14 and 0.24. As one of the largest midstream partnerships, they do not benefit significantly from having a large cash balance because they can easily access capital if required, as evidenced by their $3.9b of credit facility availability that ensures their liquidity is adequate, even if central banks further tighten monetary policy.
Conclusion
The recent volatility can be difficult for investors to navigate, especially those newer to the game but thankfully for those seeking income, it provides a very desirable opportunity to scoop up their units at a lower price than merely weeks ago. The very likely outlook for further distribution increases as they ride the inflationary wave sets the stage for a medium to long-term upwards trend, supported by their ample free cash flow and solid financial position, which means that I believe maintaining my strong buy rating is appropriate.
Notes: Unless specified otherwise, all figures in this article were taken from Enterprise Product Partners’ SEC filings, all calculated figures were performed by the author.
Be the first to comment