

Thurtell
A Quick Take On Enlight Renewable Energy Ltd.
Enlight Renewable Energy Ltd. (ENLT) has filed proposed terms to raise $293 million in an IPO of its ordinary shares, according to an amended F-1/A registration statement.
The firm acquires, develops, and operates renewable energy projects worldwide.
ENLT has produced sharply growing revenue and operating profit but needs a lot of capital for its ambitions.
Given a higher cost of capital environment, that increased capital cost may crimp its financial results.
At the reference price of $21 per share, I’m on Hold for the Enlight IPO.
Enlight Overview
Rosh Ha’ayin, Israel-based Enlight Renewable Energy Ltd. was founded to develop, acquire, and operate wind and solar energy production projects and energy storage capabilities worldwide.
Management is headed by co-founder and CEO Gilad Yavetz, who has been with the firm since its inception in 2008 and was previously VP, Marketing and Sales of BVR Systems, a simulation and training system company.
The company’s primary regional coverage includes:
-
Israel
-
Europe
-
United States
The firm operates approximately 17.0 gigawatts of power generation projects and 15.3 GWh of energy storage capacity.
As of September 30, 2022, Enlight has booked fair market value investment of $765 million in equity from investors, including Migdal Insurance and Financial Holdings, Harel Insurance Investments & Financial Services, Clal Insurance Enterprises Holdings, The Phoenix Holdings, Menora Mivtachim Holdings, and Meitav Dash Investments.
The company acts as a project developer and power producer, controlling the entire project life cycle.
Enlight operates in nine countries in Europe, 17 U.S. states, and in Israel.
Selling, Marketing & Project Promotion expenses as a percentage of total revenue have trended lower as revenues have increased, as the figures below indicate:
|
Selling, Marketing & Project Promotion |
Expenses vs. Revenue |
|
Period |
Percentage |
|
Nine Mos. Ended September 30, 2022 |
1.9% |
|
2021 |
3.5% |
|
2020 |
3.2% |
(Source – SEC)
The Selling, Marketing & Project Promotion efficiency multiple, defined as how many dollars of additional new revenue are generated by each dollar of Selling, Marketing & Projection Promotion spend, rose sharply to 26.0x in the most recent reporting period, as shown in the table below:
|
Selling, Marketing & Project Promotion |
Efficiency Rate |
|
Period |
Multiple |
|
Nine Mos. Ended September 30, 2022 |
26.0 |
|
2021 |
8.9 |
(Source – SEC)
Enlight’s Market & Competition
According to a 2022 market research report by Grand View Research, the global market for renewable energy was an estimated $769 billion in 2021 and is forecast to reach $3.1 trillion by 2030.
This represents a forecast CAGR of 16.6% from 2022 to 2030.
The main drivers for this expected growth are an ongoing transition toward low-carbon sources of energy amid growing environmental regulations to reduce greenhouse gases.
Also, the chart below shows the U.S. renewable energy market’s historical and projected future growth trajectory by product:
U.S. Renewable Energy Market (Grand View Research)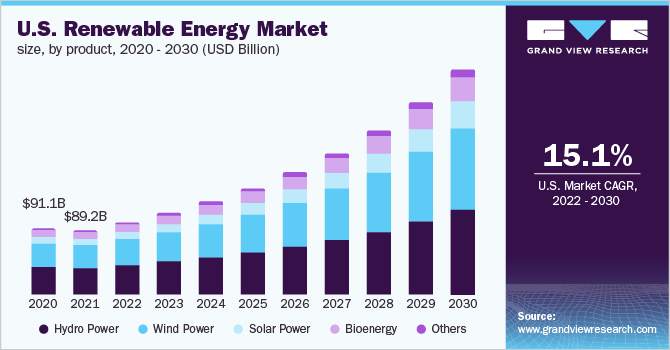
Major competitive or other industry participants include:
-
NextEra Energy (NEE)
-
Avangrid (AGR)
-
Cypress Creek Renewables
-
Leeward Renewable Energy
-
sPower
-
RWE Renewables Americas
-
Renewable Energy Systems Americas
-
Florida Power and Light
-
Suzlon
-
EDP Renewables
-
Others
Enlight Renewable Energy Ltd. Financial Performance
The company’s recent financial results can be summarized as follows:
-
Growing top line revenue
-
Increasing gross profit but uneven gross margin
-
Higher operating profits
-
Increasing cash flow from operations
Below are relevant financial results derived from the firm’s registration statement:
|
Total Revenue |
||
|
Period |
Total Revenue |
% Variance vs. Prior |
|
Nine Mos. Ended September 30, 2022 |
$ 131,303,000 |
94.7% |
|
2021 |
$ 102,461,000 |
45.7% |
|
2020 |
$ 70,324,000 |
|
|
Gross Profit (Loss) |
||
|
Period |
Gross Profit (Loss) |
% Variance vs. Prior |
|
Nine Mos. Ended September 30, 2022 |
$ 75,605,000 |
91.3% |
|
2021 |
$ 61,238,000 |
51.7% |
|
2020 |
$ 40,368,000 |
|
|
Gross Margin |
||
|
Period |
Gross Margin |
|
|
Nine Mos. Ended September 30, 2022 |
57.58% |
|
|
2021 |
59.77% |
|
|
2020 |
57.40% |
|
|
Operating Profit (Loss) |
||
|
Period |
Operating Profit (Loss) |
Operating Margin |
|
Nine Mos. Ended September 30, 2022 |
$ 67,838,000 |
51.7% |
|
2021 |
$ 34,400,000 |
33.6% |
|
2020 |
$ 28,374,000 |
40.3% |
|
Comprehensive Income (Loss) |
||
|
Period |
Comprehensive Income (Loss) |
Net Margin |
|
Nine Mos. Ended September 30, 2022 |
$ (27,136,000) |
-20.7% |
|
2021 |
$ (25,288,000) |
-19.3% |
|
2020 |
$ (12,570,000) |
-9.6% |
|
Cash Flow From Operations |
||
|
Period |
Cash Flow From Operations |
|
|
Nine Mos. Ended September 30, 2022 |
$ 53,404,000 |
|
|
2021 |
$ 52,023,000 |
|
|
2020 |
$ 38,810,000 |
|
(Source – SEC)
As of September 30, 2022, Enlight had $242.8 million in cash and $2.3 billion in total liabilities.
Free cash flow during the twelve months ended September 30, 2022, was negative ($529.5 million).
Enlight’s IPO Details
ENLT intends to sell 14 million shares of common stock at a reference price of $20.96 per share for gross proceeds of approximately $294.4 million, not including the sale of customary underwriter options.
The company’s stock is currently listed on the Tel Aviv Stock Exchange under the symbol “ENLT”.
Potentially new shareholder BNP Paribas has indicated a non-binding interest in purchasing shares of up to $25 million at the offering price.
Assuming a successful IPO at the midpoint of the proposed price range, the company’s enterprise value at IPO (excluding underwriter options) would approximate $3.9 billion.
The float to outstanding shares ratio (excluding underwriter options) will be approximately 12.1%. A figure under 10% is generally considered a ‘low float’ stock, which can be subject to significant price volatility.
Per the firm’s most recent regulatory filing, it plans to use the net proceeds as follows:
We intend to use approximately $225 million of the net proceeds from this offering to fund our equity requirements for our Advanced Development Projects and approximately $45.8 million of the net proceeds from this offering for working capital purposes and general corporate purposes, and we may also use a portion of the proceeds to acquire or invest in businesses; however, we do not have agreements or commitments for any material acquisitions or investments at this time for which we intend to use any of the proceeds from this offering.
(Source – SEC)
Management’s presentation of the company roadshow is available here until the IPO is completed.
Regarding outstanding legal proceedings, management says the firm is not a party to any legal proceedings that would have a material adverse impact on its financial condition or operations.
The listed bookrunners of the IPO are J.P. Morgan, BofA Securities, Barclays, and other investment banks.
Valuation Metrics For Enlight Renewable Energy
Below is a table of the firm’s relevant capitalization and valuation metrics at IPO, excluding the effects of underwriter options:
|
Measure [TTM] |
Amount |
|
Market Capitalization at IPO |
$2,422,608,068 |
|
Enterprise Value |
$3,936,059,068 |
|
Price / Sales |
14.56 |
|
EV / Revenue |
23.66 |
|
EV / EBITDA |
48.77 |
|
Earnings Per Share |
-$0.42 |
|
Operating Margin |
48.52% |
|
Net Margin |
-30.06% |
|
Float To Outstanding Shares Ratio |
12.11% |
|
Proposed IPO Midpoint Price per Share |
$20.96 |
|
Net Free Cash Flow |
-$529,469,000 |
|
Free Cash Flow Yield Per Share |
-21.86% |
|
Debt / EBITDA Multiple |
22.45 |
|
CapEx Ratio |
0.13 |
|
Revenue Growth Rate |
94.74% |
(Source – SEC)
Commentary About Enlight Renewable
ENLT is seeking U.S. public capital market funding to invest in new projects and for general corporate purposes.
The company’s financials have generated increasing top line revenue, growing gross profit but uneven gross margin, higher operating profits, and growing cash flow from operations.
Free cash flow for the twelve months ended September 30, 2022, was negative ($529.5 million).
Selling, Marketing & Project Promotion expenses as a percentage of total revenue have trended lower as revenue has increased; its Selling, Marketing & Project Promotion efficiency multiple rose substantially to 26.0x in the most recent reporting period.
The firm currently plans to pay no dividends and to retain substantially all earnings in the foreseeable future to reinvest back into the company’s growth plans and working capital needs.
ENLT has been investing heavily in capital project development, so its CapEx has been extremely high compared to its operating cash flow.
The market opportunity is large for renewable energy projects as regions seek to reduce their carbon footprint and transition to cleaner sources of energy, so the company has strong industry growth dynamics in its favor.
J.P. Morgan is the lead underwriter, and IPOs led by the firm over the last 12-month period have generated an average return of 11.0% since their IPO. This is a mid-tier performance for all significant underwriters during the period.
Risks to the company’s outlook as a public company include potential supply chain disruptions and increasing cost of capital assumptions by investors, making project total cost of ownership higher.
As for valuation, management is asking investors to pay an Enterprise Value / Revenue multiple of 23.7x.
The challenge for Enlight, though, is its heavy free cash use as it grows its footprint combined with a generally higher cost of capital environment on the debt side.
While some believe interest rates will start to fall as economies enter a slowdown, there is still debate on this topic as observers believe there is still a large amount of available cash in consumers’ pockets, providing ongoing strength to the economy and upward pressure on interest rates.
For investors interested in investing in a ‘green’ energy provider, Enlight may be worth considering, but at a lower price point than $21 per share.
I’m on Hold for ENLT’s IPO due to excessive valuation.
Expected IPO Pricing Date: February 9, 2023.
Be the first to comment