

imaginima
After the boom and bust in the midstream sector discipline has returned. Capex is low and this leads to rising free cash flows which will support higher dividends and buybacks.
It is often said that the energy infrastructure sector is not impacted by commodity prices, but this is indeed the case. This is currently rather an advantage than a disadvantage: the outlook for energy commodities is good.
A great way to get exposure to this promising sector is the Alerian Energy Infrastructure ETF (NYSEARCA:ENFR).
Midstream
The energy value chain can be classified under three broad categories:
- Upstream
- Midstream
- Downstream
Upstream concerns exploration and production (E&P): developing and extracting oil and gas.
Downstream involves refining oil and gas into consumable products and delivering them to end users.
Midstream energy companies connect the upstream with the downstream. These energy infrastructure companies own and operate the pipelines, storage facilities and processing plants.
Midstream can be divided into three sub-sectors:
- Gathering and processing
- Transportation
- Storage and terminals
Figure 1 gives more details about those three sub-sectors and confirms the traditional view of the midstream sector: the yields are high and the commodity linkage is low. Midstream companies get paid by the amount of oil they are transporting through their pipelines no matter what the price of oil is at that moment or how volatile the oil price is.
Figure 1: Midstream sub-sectors (Meteka)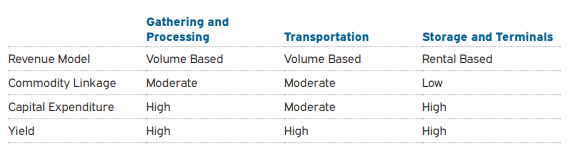
In these inflationary times it’s worth noting that midstream companies work with long-term contracts that often have built-in inflation adjustments.
Midstream Boom and Bust
In 2014 President Obama declared that “”for the first time in nearly two decades, we produce more oil here in the United States than we buy from the rest of the world.” This boom in energy production had its consequences on the midstream sector.
Total pipeline capacity expanded 42% from 2006 to 2017. But as always, more competition drove prices down. The massive expansion of capacity, driven by massive investment in new pipelines, caused the price of transporting oil to stagnate between 2015 and 2020.
Figure 2: Producer Price Index by Industry: Pipeline Transportation of Crude Oil (FRED)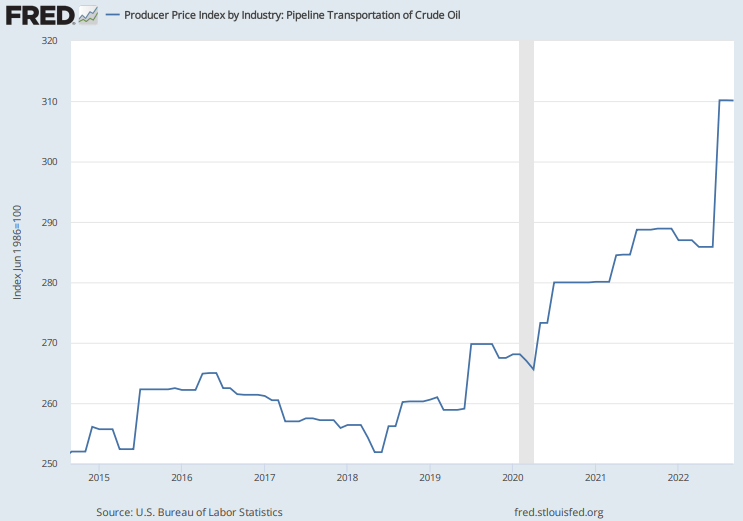
In the same period the (total) returns of energy infrastructure companies were very meagre.
Figure 3: Total return chart (Yahoo! Finance, Author)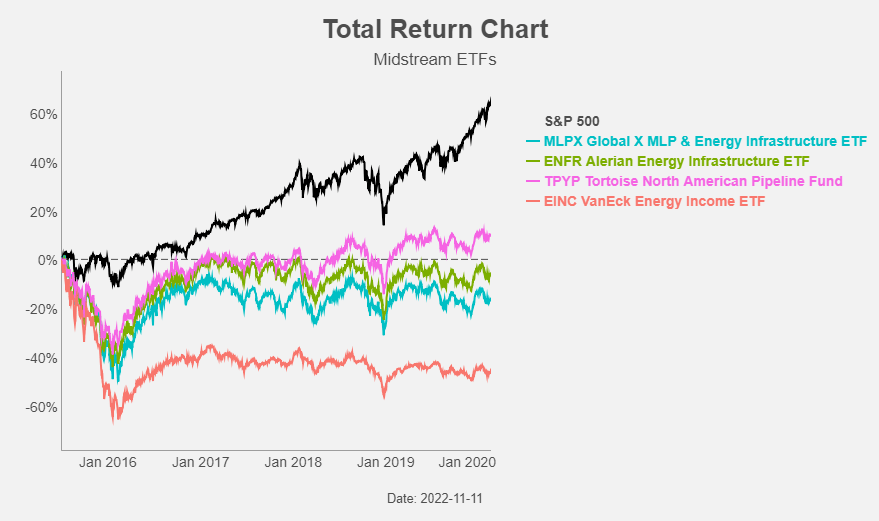
The period of over-investment was of course followed by a period of low capex. US Midstream capex halved in 2020 and is expected to remain on those lower levels for the foreseeable future.
Figure 4: US Midstream capex (Wells Fargo)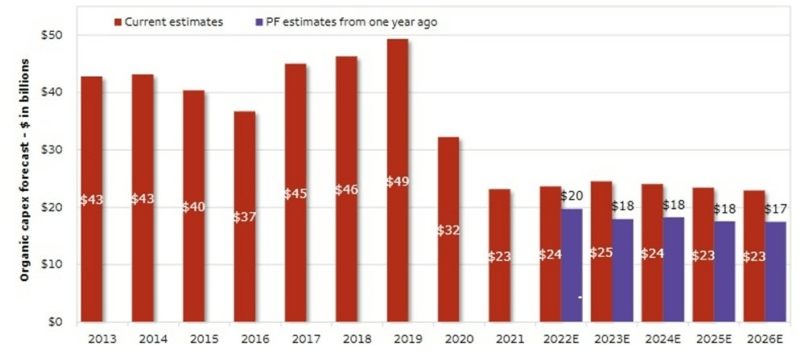
This lower capex has improved returns for investors. Since the start of the Covid-crisis midstream energy infrastructure companies have outperformed the S&P 500.
Figure 5: Total return chart (Yahoo! Finance, Author)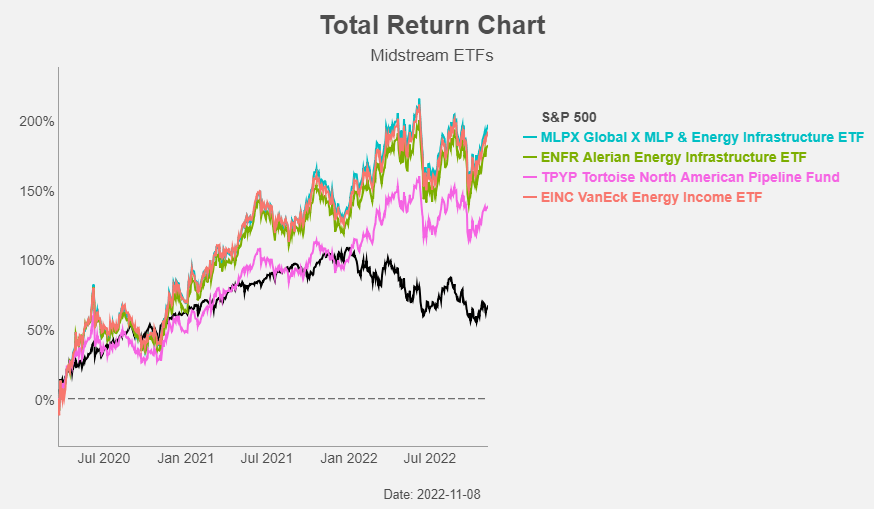
They certainly did so this year. Rising short and long interest rates had a negative impact on stocks in general and high yielding equities like real estate.
Figure 6: Total return chart (Yahoo! Finance, Author)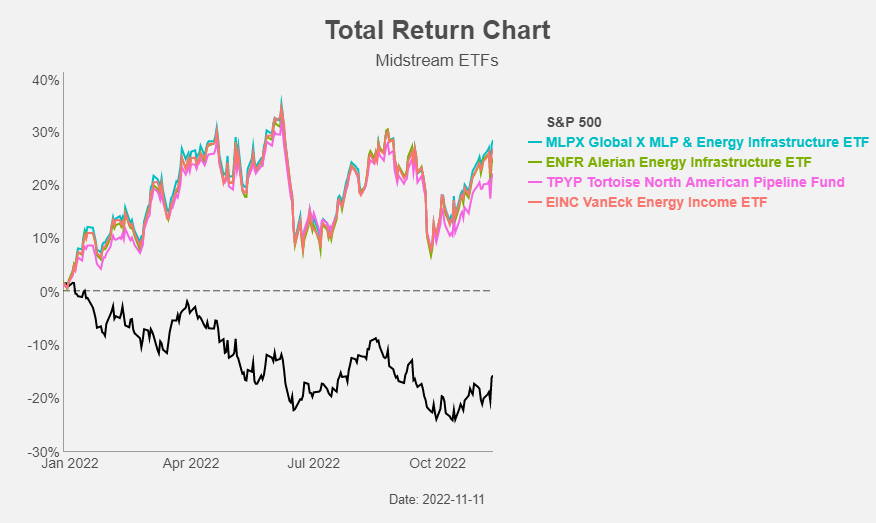
The lower capital expenditures also have a positive impact on the free cash flow generation of midstream companies This creates room for on the one hand the reduction of leverage and on the other hand for dividends and/or buybacks.
Figure 7: US Midstream free cash flow (Wells Fargo)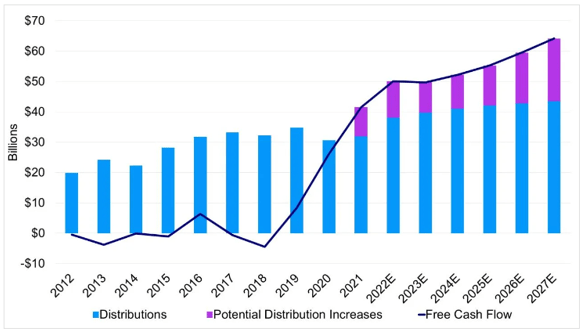
Figure 8: US Midstream share buybacks (Wells Fargo)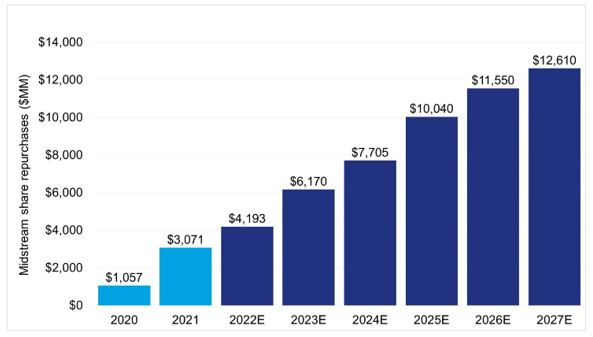
Valuation
The strong free cash flow generation and the expected juicy dividends and buybacks are major trump cards for midstream companies, but what about the valuation?
Despite a strong recovery the past two years midstream valuations remain well below their historical averages.
Figure 9: US Midstream valuation (Wells Fargo)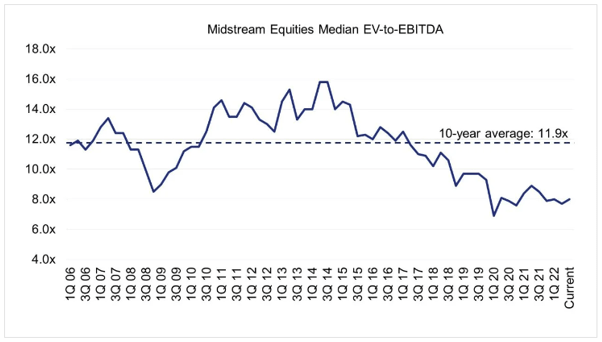
And when we compare energy infrastructure companies to other income oriented sectors, like bonds, REITs and utilities, they come out on top. Current midstream yields are also above their ten-year averages.
Figure 10: US Midstream valuation (SS&C ALPS Advisors)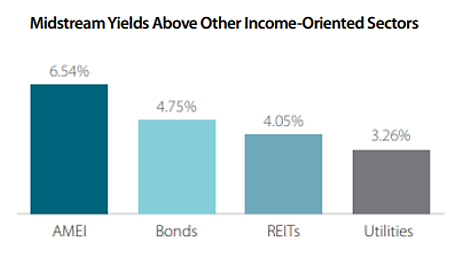
AMEI is the Alerian Midstream Energy Select Index, the benchmark for ENFR.
Commodity price linkage
Energy infrastructure companies are considered to have a low commodity linkage. They get paid by the volumes they are transporting through their pipelines no matter what the price of oil is at that moment or how volatile the oil price is.
But, is this really the case? Pipeline volumes might in the short term be unaffected by swings in energy prices, but in the longer term the transported volumes depend on how much oil is drilled. And the amount of oil that is drilled depends of course on the price of oil.
This higher than assumed link with energy commodity prices is not necessarily a bad thing in our eyes. We are positive on the energy commodity sector.
Energy is the only commodity sector in an uptrend.
Table 1: Trend (Yahoo! Finance, Author)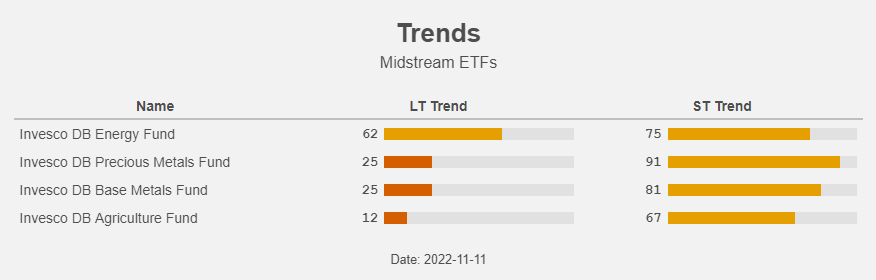
Also in the upstream sector capex is low and this is supportive of higher energy prices.
Mike Wirth, the CEO of Chevron (CVX), made it recently in an interview with the Financial Times very clear: “Annual capital spending on oil and gas projects is now about half the rate seen in years before the pandemic, even though demand for the energy has continued to rise”.
ENFR
Our favourite energy infrastructure ETF is the Alerian Energy Infrastructure ETF. It’s the only ETF that’s in a clear uptrend.
Table 2: Trend (Yahoo! Finance, Author)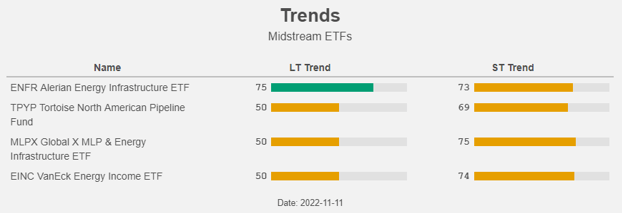
On top of that, it has (together with MLPX) the highest dividend yield (almost 6%) and the lowest expense ratio (0.35%).
Figure 11: Total return chart (Yahoo! Finance, Author)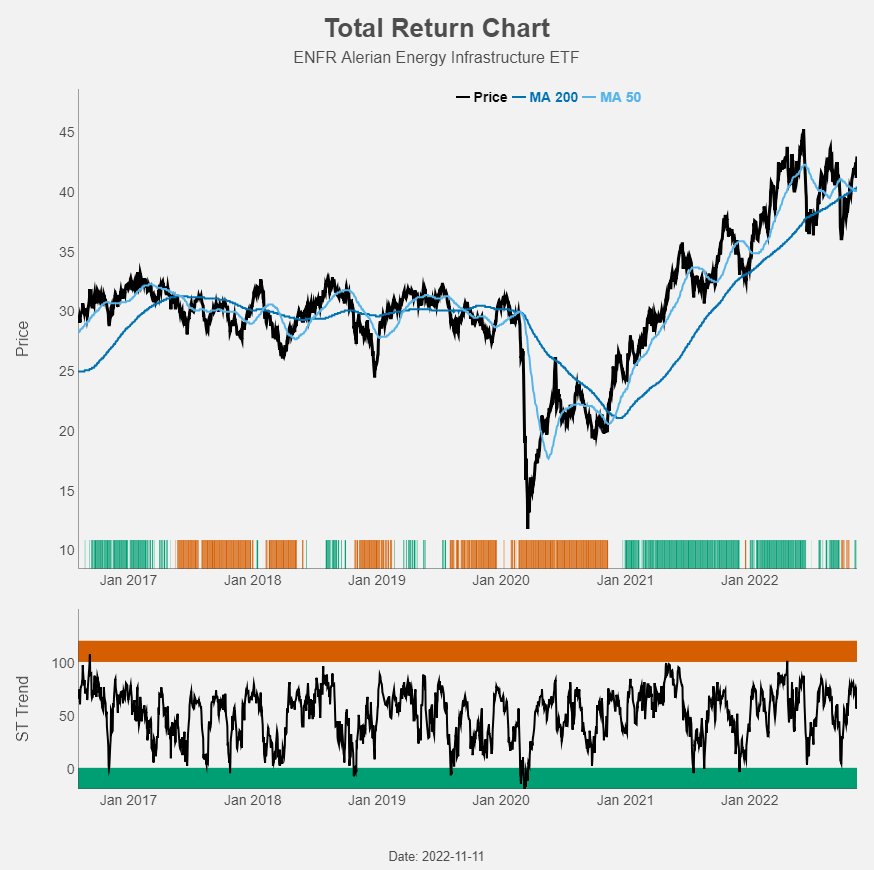
Below you can find the top 10 holdings and the sector weights to get an idea what’s inside the ETF.
Figure 12: Top 10 holdings (SS&C ALPS Advisors)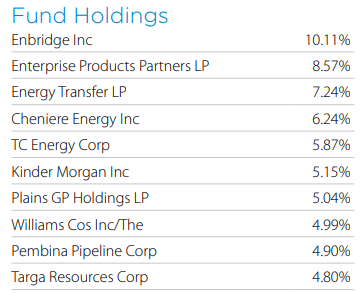
Figure 13: Top 10 holdings (SS&C ALPS Advisors)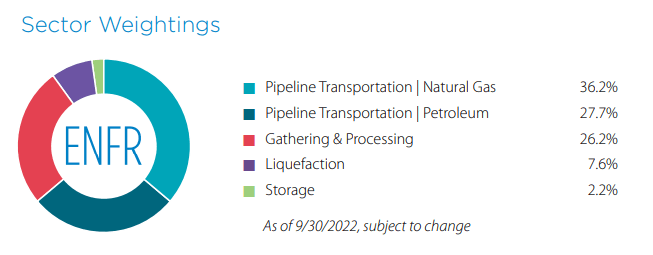
Recession?
What could go wrong? In our view there is a clear linkage between midstream companies and energy commodity prices. A recession would lead to lower demand for oil and gas and could result in lower prices. Lower demand could of course lead to additional production cuts by OPEC. Now that the midterm elections are behind us we expect the strategic oil reserves to be refilled again.
Also further economic weakness in China and/or additional dollar strength could have a negative impact. In China we expect rather positive than negative surprise linked to less stringent Covid-measures and we do not expect further dollar strength from the current levels.
Midstream companies are both a toll road and a commodity bet. In case of a recession their strong toll road fundamentals will support the energy infrastructure companies.
Conclusion
Low capex in the midstream sector are again leading to higher transportation costs. This results in strong free cash flow generation and higher dividends and buybacks in the coming years.
The low capex in the upstream sector are supportive of energy commodity prices. This is important because the linkage between energy infrastructure companies and commodity prices is higher than generally assumed.
Our preferred ETF in this promising sector is the Alerian Energy Infrastructure ETF: buy!
Be the first to comment