

RgStudio/E+ via Getty Images
Imagine being able to retire not just in comfort but safety and splendor.
That’s what the world’s best dividend blue-chips can help you achieve.
And when it comes to the bluest of blue-chips, they don’t get much better than dividend aristocrats, companies that have raised their payouts for 25+ consecutive years.
But the aristocrats are only yielding 2.2%, just slightly better than the S&P 500.
While their income dependability might be without peer, that’s hardly the kind of yield that retirees get excited about.
But what if I told you that you could get a very safe 6% yield from dividend aristocrat, one that offered long-term return potential of 12%?
That’s exactly what Enbridge (NYSE:ENB), the quality and safety king of midstream offers.
| Investment Strategy | Yield | LT Consensus Growth | LT Consensus Total Return Potential | Long-Term Risk-Adjusted Expected Return | Long-Term Inflation And Risk-Adjusted Expected Returns | Years To Double Your Inflation & Risk-Adjusted Wealth |
10 Year Inflation And Risk-Adjusted Return |
| Enbridge | 6.0% | 6.0% | 12.0% | 8.4% | 5.9% | 12.2 | 1.78 |
| Safe Midstream | 5.1% | 6.0% | 11.1% | 7.8% | 5.3% | 13.6 | 1.67 |
| Dividend Aristocrats | 2.2% | 8.9% | 11.1% | 7.8% | 5.3% | 13.6 | 1.67 |
| S&P 500 | 1.4% | 8.5% | 9.9% | 7.0% | 4.5% | 16.1 | 1.55 |
| REITs | 2.9% | 6.5% | 9.4% | 6.6% | 4.1% | 17.6 | 1.49 |
(Source: Morningstar, FactSet, YCharts)
What could 6% yield today and potentially 12% long-term returns mean for you?
Inflation-Adjusted Consensus Total Return Potential: $1,000 Initial Investment
| Time Frame (Years) | 7.7% CAGR Inflation-Adjusted S&P Consensus | 9.0% Inflation-Adjusted Aristocrat Consensus | 9.7% CAGR Inflation-Adjusted ENB Guidance | Difference Between Inflation Adjusted ENB Guidance And S&P 500 |
| 5 | $1,449.03 | $1,540.04 | $1,590.12 | $141.08 |
| 10 | $2,099.70 | $2,371.71 | $2,528.47 | $428.77 |
| 15 | $3,042.53 | $3,652.52 | $4,020.56 | $978.03 |
| 20 | $4,408.74 | $5,625.01 | $6,393.17 | $1,984.43 |
| 25 | $6,388.41 | $8,662.72 | $10,165.88 | $3,777.47 |
| 30 | $9,257.02 | $13,340.91 | $16,164.94 | $6,907.92 |
(Source: DK Research Terminal, FactSet)
ENB might be growing slower than in the past but management thinks it can still potentially deliver 16X inflation-adjusted returns over the next 30 years.
| Time Frame (Years) | Ratio Aristocrats/S&P | Ratio Inflation-Adjusted ENB Guidance Vs S&P 500 |
| 5 | 1.06 | 1.10 |
| 10 | 1.13 | 1.20 |
| 15 | 1.20 | 1.32 |
| 20 | 1.28 | 1.45 |
| 25 | 1.36 | 1.59 |
| 30 | 1.44 | 1.75 |
(Source: DK Research Terminal, FactSet)
Which is close to 2X the market’s consensus real return potential.
ENB has a rich history of making retirees rich, and management says it plans to keep doing that for decades to come.
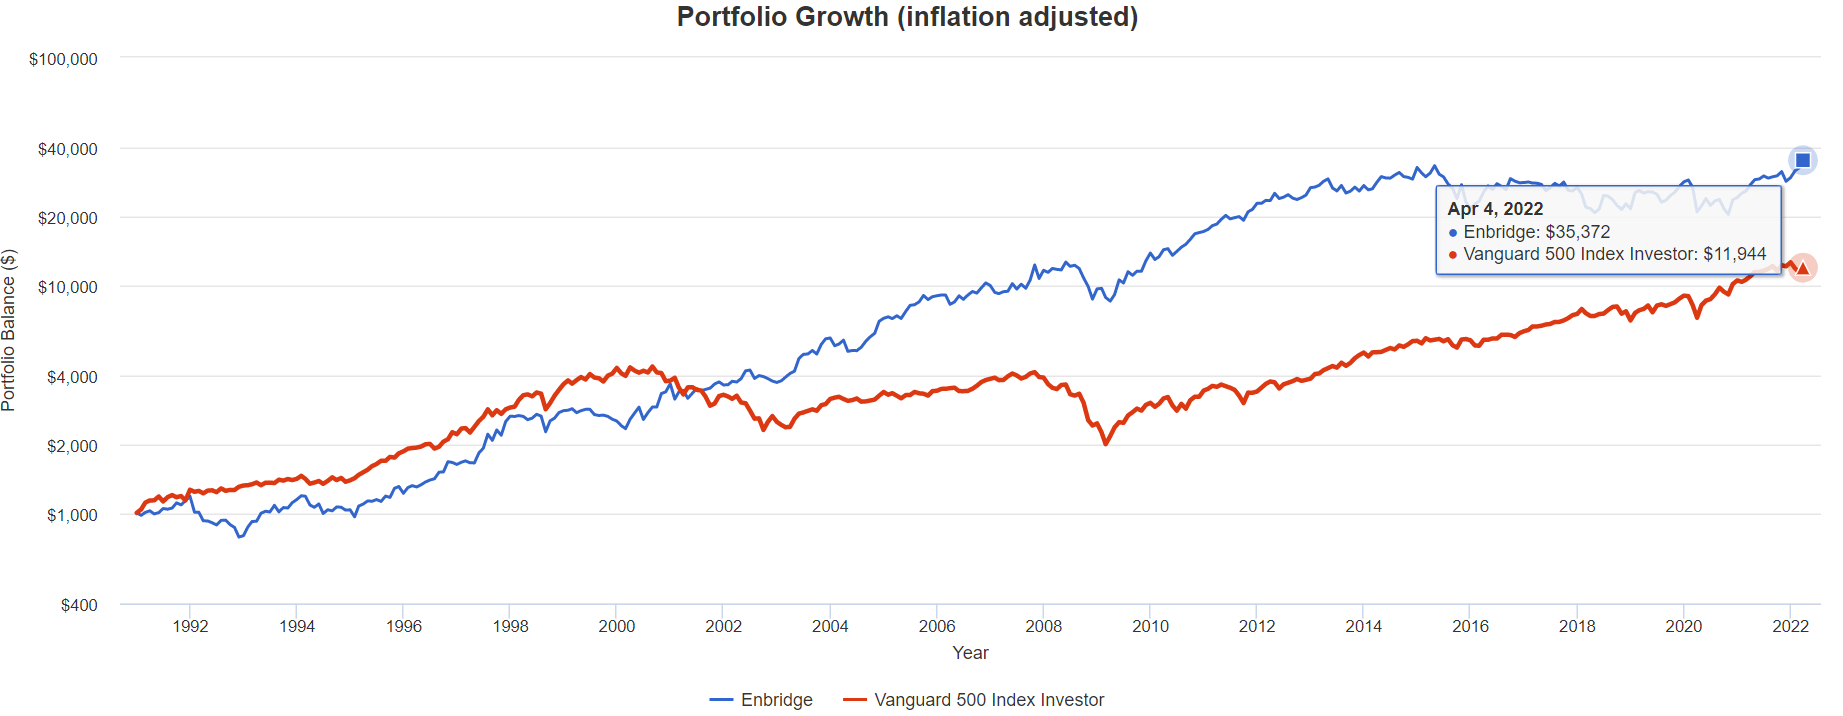
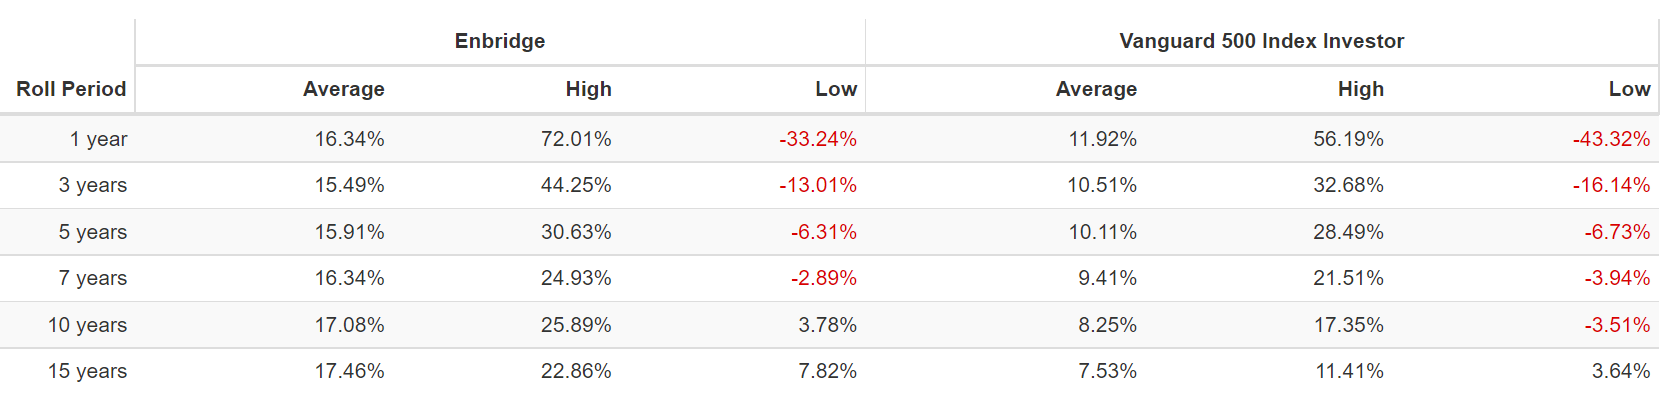
ENB Total Returns Since 1991
(Source: Portfolio Visualizer) (Source: Portfolio Visualizer) (Source: Portfolio Visualizer)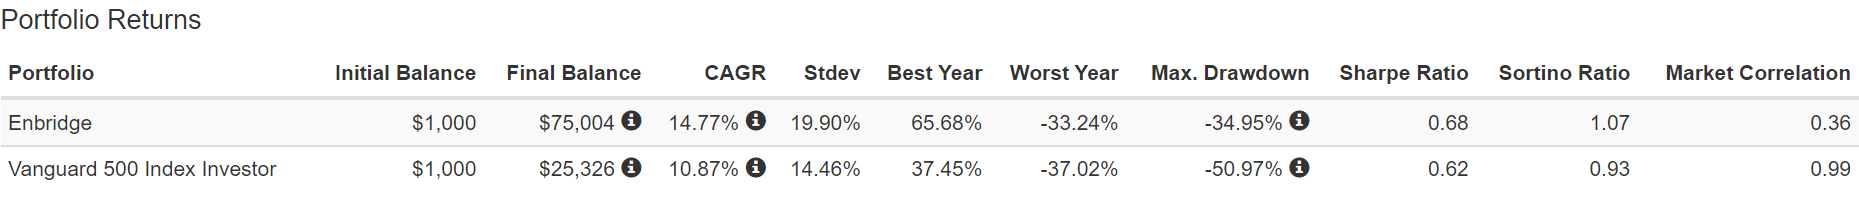
So let me show you the three reasons why I don’t just recommend Enbridge, I have personally invested almost $150,000 of my hard-earned retirement savings into the quality and safety king of midstream.
Or to put it another way, let me show you why 6% yielding Enbridge is the perfect dividend aristocrat retirement dream stock, to help you potentially retire in safety and splendor.
Reason One: World-Class Quality You Can Trust In Any Economy
The Dividend King’s overall quality scores are based on a 241 point model that includes:
-
dividend safety
-
balance sheet strength
-
credit ratings
-
credit default swap medium-term bankruptcy risk data
-
short and long-term bankruptcy risk
-
accounting and corporate fraud risk
-
profitability and business model
-
growth consensus estimates
-
management growth guidance
-
historical earnings growth rates
-
historical cash flow growth rates
-
historical dividend growth rates
-
historical sales growth rates
-
cost of capital
-
long-term risk-management scores from MSCI, Morningstar, FactSet, S&P, Reuters’/Refinitiv, and Just Capital
-
management quality
-
dividend friendly corporate culture/income dependability
-
long-term total returns (a Ben Graham sign of quality)
-
analyst consensus long-term return potential
In fact, it includes over 1,000 fundamental metrics including the 12 rating agencies we use to assess fundamental risk.
How do we know that our safety and quality model works well?
During the two worst recessions in 75 years, our safety model 87% of blue-chip dividend cuts, the ultimate baptism by fire for any dividend safety model.
And then there’s the confirmation that our quality ratings are very accurate.
DK Zen Phoenix: Superior Fundamentals Lead To Superior Long-Term Results
| Metric | US Stocks | 189 Real Money DK Phoenix Recs |
| Great Recession Dividend Growth | -25% | 0% |
| Pandemic Dividend Growth | -1% | 6% |
| Positive Total Returns Over The Last 10 Years | 42% | 99.5% (Greatest Investors In History 60% to 80% Over Time) |
| Lost Money/Went Bankrupt Over The Last 10 Years | 47% | 0.5% |
| Outperformed Market Over The Last Decade (299%) | 36% | 51% |
| Bankruptcies Over The Last 10 Years | 11% | 0% |
| Permanent 70+% Catastrophic Decline Since 1980 | 44% | 0.5% |
| 100+% Total Return Over The Past 10 Years | NA | 88% |
| Sources: Morningstar, JPMorgan, Seeking Alpha |
Basically, historical market data confirms that the DK safety and quality model is one of the most comprehensive and accurate in the world.
This is why I entrust 100% of my life savings to this model and the DK Phoenix blue-chip strategy.
ENB Dividend Safety
| Rating | Dividend Kings Safety Score (153 Point Safety Model) | Approximate Dividend Cut Risk (Average Recession) |
Approximate Dividend Cut Risk In Pandemic Level Recession |
| 1 – unsafe | 0% to 20% | over 4% | 16+% |
| 2- below average | 21% to 40% | over 2% | 8% to 16% |
| 3 – average | 41% to 60% | 2% | 4% to 8% |
| 4 – safe | 61% to 80% | 1% | 2% to 4% |
| 5- very safe | 81% to 100% | 0.5% | 1% to 2% |
| ENB | 88% | 0.5% | 1.6% |
| Risk Rating | Low Risk (73rd industry percentile risk-management consensus) | BBB+ stable outlook credit rating 5% 30-year bankruptcy risk | 20% OR LESS Max Risk Cap Recommendation |
Long-Term Dependability
| Company | DK Long-Term Dependability Score | Interpretation | Points |
| Non-Dependable Companies | 21% or below | Poor Dependability | 1 |
| Low Dependability Companies | 22% to 60% | Below-Average Dependability | 2 |
| S&P 500/Industry Average | 61% (58% to 70% range) | Average Dependability | 3 |
| Above-Average | 71% to 80% | Very Dependable | 4 |
| Very Good | 81% or higher | Exceptional Dependability | 5 |
| ENB | 91% | Exceptional Dependability | 5 |
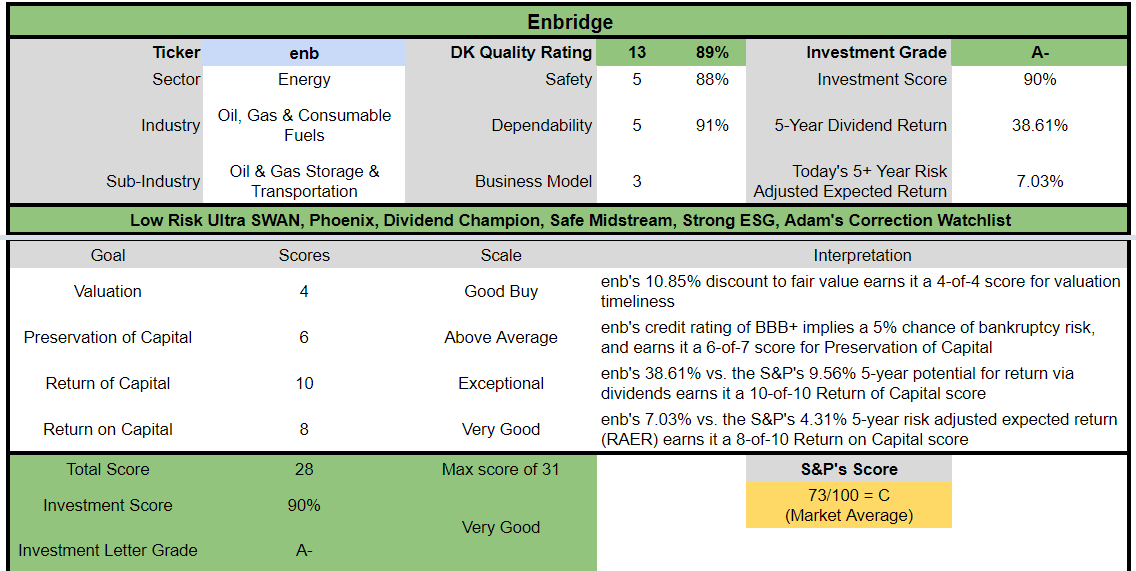
Overall Quality
| ENB | Final Score | Rating |
| Safety | 88% | 5/5 very safe |
| Business Model | 80% | 3/3 wide moat |
| Dependability | 91% | 5/5 exceptional |
| Total | 89% | 13/13 Ultra SWAN global aristocrat |
| Risk Rating | 3/3 Low Risk | |
| 20% OR LESS Max Risk Cap Rec |
5% Margin of Safety For A Potentially Good Buy |
ENB: The 70th Highest Quality Master List Company (Out of 507) = 86th Percentile
The DK 500 Master List includes the world’s highest quality companies including:
-
All dividend champions
-
All dividend aristocrats
-
All dividend kings
-
All global aristocrats (such as BTI, ENB, and NVS)
-
All 13/13 Ultra Swans (as close to perfect quality as exists on Wall Street)
- 49 of the world’s best growth stocks
ENB’s 89% quality score means its similar in quality to such blue-chips as
- Lockheed Martin (LMT)
- QUALCOMM (QCOM)
- Home Depot (HD)
- Altria (MO) – dividend king
- Illinois Tool Works (ITW) – dividend king
- Brown-Forman (BF.B) – dividend aristocrat
ENB Is The Quality King Of Midstream
| Company/MLP | Ticker | Quality Score | Safety Score | Long-Term Risk Management Consensus Industry Percentile | Longest Maturing Bond |
Longest Maturing Bond Yield To Maturity |
| Enbridge | ENB | 89% | 88% | 73% | 2112 | 5.7% |
| Enterprise Products Partners (uses K-1 tax form) | EPD | 86% | 90% | 68% | 2078 | 5.4% |
| Magellan Midstream Partners (uses K-1) | MMP | 85% | 86% | 69% | 2050 | 4.3% |
| Pembina Pipeline Corp | PBA | 82% | 89% | 70% | 2081 | 5.9% |
| National Fuel Gas | NFG | 78% | 83% | 40% | 2031 | 2.7% |
| Brookfield Infrastructure Corp | BIPC | 75% | 78% | 44% | 2032 | 3.0% |
| TC Energy | TRP | 74% | 79% | 69% | 2081 | 5.0% |
| ONEOK | OKE | 73% | 75% | 76% | 2051 | 4.3% |
| Kinder Morgan | KMI | 71% | 74% | 60% | 2098 | 4.9% |
| NextEra Energy Partners | NEP | 70% | 66% | 80% | 2026 | 2.8% |
| MPLX (uses K-1) | MPLX | 69% | 74% | NA | 2058 | 3.9% |
| Williams Companies | WMB | 65% | 67% | 65% | 2050 | 3.3% |
| Average | 76.4% – SWAN | 79.1% Safe | 64.9% Above-Average | 2,062 | 4.2% |
(Source: DK Research Terminal)
ENB is the highest quality midstream you can buy, and higher quality than even 86% of the world’s best companies.
Why I Trust Enbridge With My Retirement Savings And So Can You
But here are the key takeaways.
On average it takes over 16 years to get a new lithium mine producing thanks to the very regulations and lawsuits that environmentalists keep advocating for.
We need 135X as much lithium production as we have now.
10 to 20 years to go 100% green? Simply not possible. Not opinion, objective fact.
We need 6X of the current mineral production to make the green energy transition by 2050.
Building up this capacity is complex, expensive, and time-consuming.
- various groups often sue to stop new projects from being started/completed
Calpers (the California Pension fund) thinks at least 20 years is required for the energy transition.
- most economists and financial institutions think 30 to 50 years
- the bond market agrees
And this is where ENB, which was founded in 1949 in Calgary, comes in.
(Source: Investor Day 2021 presentation, Dec 7th)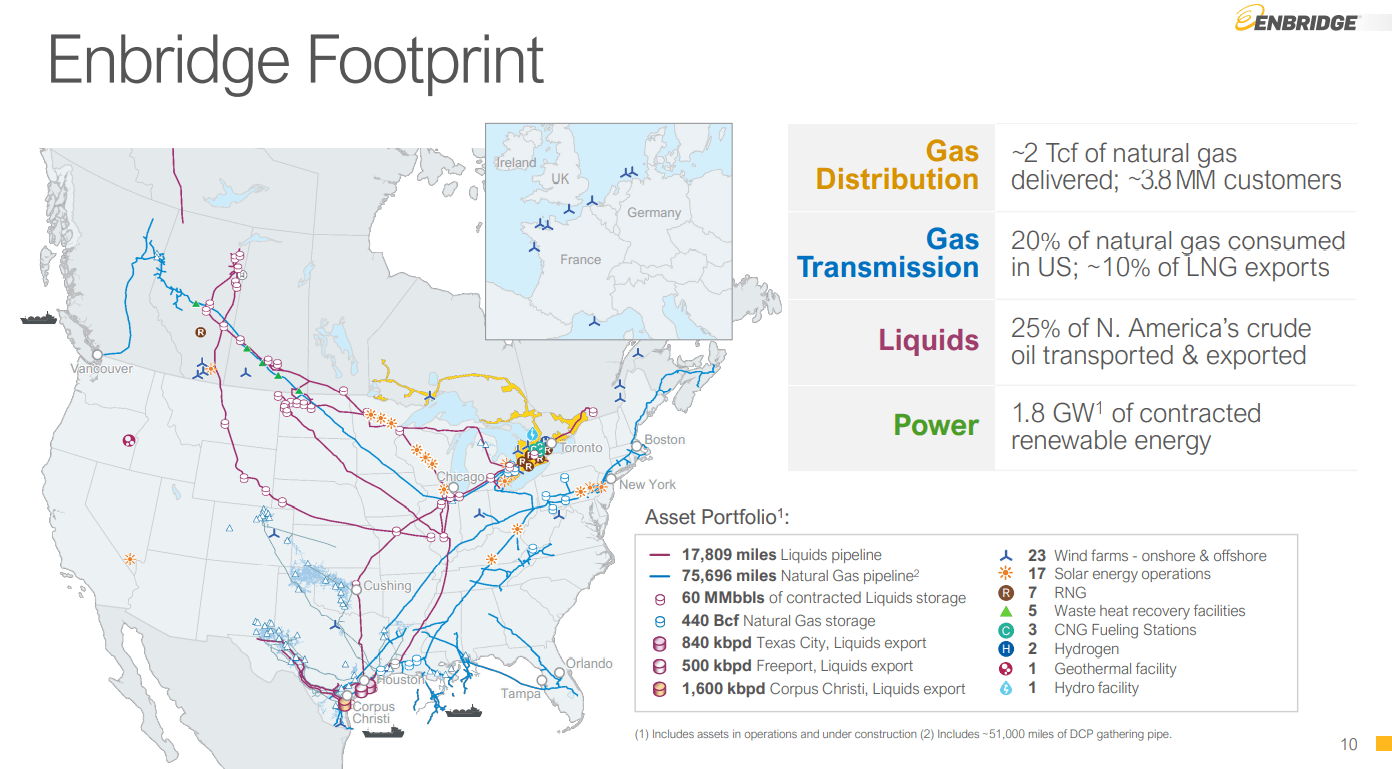
ENB transports 20% of America’s gas, and 25% of North America’s oil. The biggest midstream network on the continent.
(Source: Investor Day 2021 presentation, Dec 7th)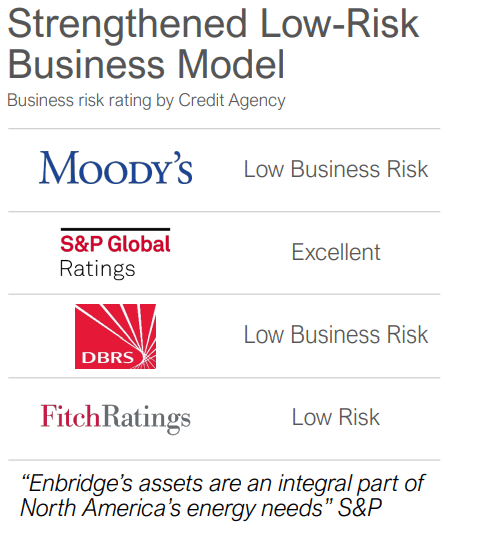
ENB’s cash flow has less than 2% direct exposure to commodity prices, the most utility-like in the industry.
ENB has proven adaptable, long-term focused, and has been a great income investment throughout
- 12 US recessions
- 2 global economic crises
- 2 oil shocks
- four major oil crashes (including oil trading at -$38 in 2020)
- inflation as high as 15%
- interest rates as high as 20%
- seven bear markets
- dozens of corrections and pullbacks
ENB is almost certainly going to outlive us all.
- the ultimate midstream “buy and hold forever and leave to your children” blue-chip
Investment Thesis Summary
Enbridge stands out among North American midstream operators with a focus on oil pipelines and a utility-like earnings profile. The firm’s most important asset, its Mainline system, controls over 70% of Canada’s takeaway capacity and is linked to highly complex U.S. refineries that value heavy oil, meaning demand remains secure in the near to medium term despite the increase in U.S. light oil production.” – Morningstar
ENB’s midstream assets are the largest in North America, and create a wide and stable moat, courtesy of being irreplaceable and critical to the continent’s economy.
2021 was a great year for ENB, which has proven itself an industry leader in stable growth regardless of commodity prices.
- $11.2 billion in growth projects placed into service
- $1.6 billion in new projects started
- 27th consecutive annual dividend increase
- $1.2 billion buyback authorization
- 30% total return for shareholders
Of the $6 billion in investable capacity, we’ll prioritize the $3 billion to $4 billion annually to ratable utility-like projects and low capital intensity growth.” – CEO, Q4 conference call
Global oil & gas demand is expected to grow slowly but steadily for decades, meaning ENB has a long period of time to transition to a green energy future.
In the medium term, ENB has up to $4.9 billion in annual growth opportunities it can pursue including:
- $1.6 billion per year in gas transmission
- $1.2 billion per year in gas distribution (it’s Ontario’s largest gas utility)
- $800 million per year in oil pipelines
- $800 million per year in renewable projects primarily focused on wind energy in Europe
This represents the 2nd biggest growth backlog in the industry.
The international energy agency estimates that green energy is a $5.1 trillion global investment opportunity by 2030.
- and well over $100 trillion by 2050
ENB is involved in almost every part of the green energy transition within its industry.
- solar
- wind
- improving efficiencies through project upgrades
- renewable natural gas (methane from landfills)
- Hydrogen (a $3.2 trillion market by 2030 according to Cummins)
- and carbon capture and sequestration
ENB has $3.2 billion in renewable projects under development that it plans to complete by 2025.
ENB is now building wind projects in Europe and North America, with solar-self power projects designed to run its pipeline pumps also underway.
ENB is working with Canada’s governments and first nation groups to become an industry leader in carbon capture and storage.
The Alberta Energy Ministry said it chose projects proposed by Enbridge (NYSE:ENB), Shell (NYSE:SHEL), Wolf Carbons Solutions, Bison Low Carbon Ventures, Enhance Energy and a joint venture from TC Energy (TRP) and Pembina Pipeline (PBA).” – Seeking Alpha
ENB has 7 renewable natural gas projects already operating in North America, with another 50+ in development, and 8 more joint venture projects potentially set to start soon.
- renewable natural gas is primarily methane generated by landfills
According to Bloomberg the offshore wind opportunity in Europe alone is almost 100 GW, more than all existing wind capacity on the continent.
- approximately $100 billion in addressable investment market through 2035 alone, and just in Europe, and just in offshore wind
Another $10 billion in floating offshore wind opportunity.
ENB’s long-term plan is to continue self-funding its ambitious growth plans while reducing its debt/EBITDA to the low end of its 4.5X to 5X guidance.
- 5X or less is safe according to rating agencies
ENB has zero need for new stock issuances, and is in fact, buying back shares.
(Source: FactSet Research Terminal)
Going forward not only does ENB plan to have a very safe 60% to 70% DCF payout ratio (83% or less is safe) but analysts expect it to be fully FCF self-funding.
- free cash flow = what’s leftover after running the business and investing in all future growth
- includes all maintenance and growth capex
- ENB is expected to be able to fund the dividend entirely with FCF and still have about $1 billion per year leftover
Self-funding is the gold standard of safety in the industry.
FCF self-funding is the platinum standard of safety.
ENB has an $8 billion growth backlog of projects slated to be completed by 2025.
- approximately 40% of ENB’s current backlog is renewables
After investing in growth and paying its dividend, management expects to have $1.6 billion in retained cash flow each year to use for things like
- M&A
- debt repayment
- buybacks
(Source: earnings presentation)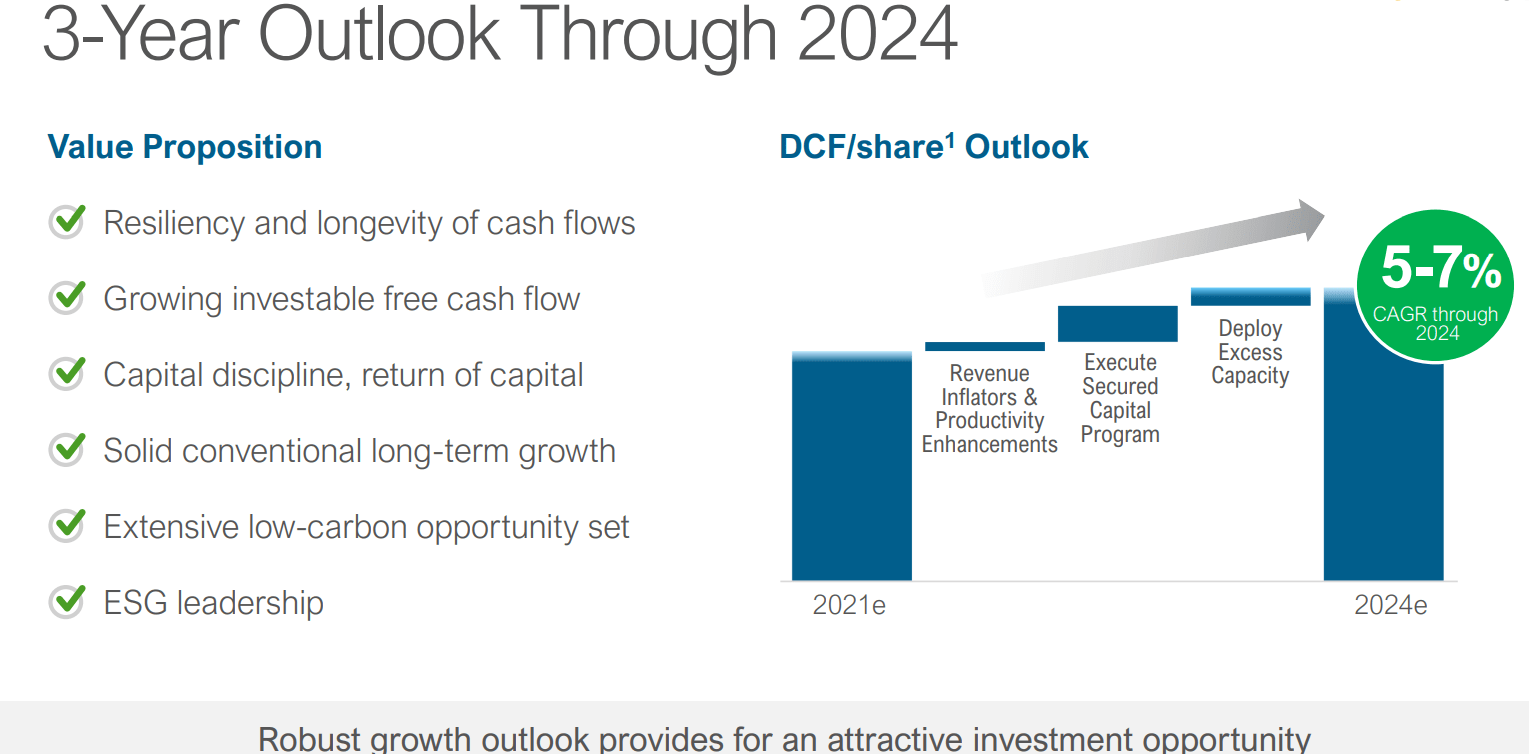
Through 2024 management expects 5% to 7% cash flow growth, and ENB’s growth runway is strong enough to sustain this growth rate (one of the best in the industry) for decades to come.
- S&P estimates that US electrical grid upgrades alone are a $13 trillion investment opportunity
- just an example of how North American (and European) energy infrastructure is a mountain of money just waiting to be earned by smart companies
ENB Credit Ratings
| Rating Agency | Credit Rating | 30-Year Default/Bankruptcy Risk | Chance of Losing 100% Of Your Investment 1 In |
| S&P | BBB+ stable | 5.00% | 20.0 |
| Fitch | BBB+ stable | 5.00% | 20.0 |
| Moody’s | Baa1 (BBB+ equivalent) stable | 5.00% | 20.0 |
| DBRS | BBB (High) | 5.00% | 20.0 |
| Consensus | BBB+ stable | 5.00% | 20.0 |
(Sources: S&P, Fitch, Moody’s, DBRS)
No less than four credit rating agencies all estimate ENB’s fundamental risk of going bankrupt in the next 30 years at 1 in 20.
ENB Leverage Consensus Forecast
| Year | Debt/EBITDA | Net Debt/EBITDA (5.0 Or Less Safe According To Credit Rating Agencies) |
Interest Coverage (2+ Safe) |
| 2020 | 5.04 | 5.13 | 3.42 |
| 2021 | 5.40 | 5.38 | 3.79 |
| 2022 | 4.75 | 5.01 | 3.66 |
| 2023 | 4.64 | 4.88 | 3.68 |
| 2024 | 4.64 | 4.69 | 3.66 |
| 2025 | 5.14 | 4.87 | NA |
| 2026 | 5.14 | 4.72 | NA |
| 2027 | 4.83 | NA | NA |
| Annualized Change | -0.60% | -1.38% | 1.68% |
(Sources: FactSet Research Terminal)
Our exposure to rising interest rates is limited, as most of our debt is fixed rate and what’s remaining, we actively hedge.” – CFO, Q4 conference call
ENB’s weighted debt maturities are 14.4 years, locking in profitability on new projects and limiting interest-rate sensitivity.
ENB Balance Sheet Consensus Forecast
| Year | Total Debt (Millions) | Cash | Net Debt (Millions) | Interest Cost (Millions) | EBITDA (Millions) | Operating Income (Millions) | Average Interest Rate |
| 2020 | $52,650 | $356 | $53,620 | $2,198 | $10,446 | $7,525 | 4.17% |
| 2021 | $59,625 | $225 | $59,399 | $2,109 | $11,037 | $8,000 | 3.54% |
| 2022 | $58,742 | $262 | $62,002 | $2,284 | $12,368 | $8,360 | 3.89% |
| 2023 | $58,861 | $281 | $61,893 | $2,347 | $12,690 | $8,634 | 3.99% |
| 2024 | $59,574 | $146 | $60,200 | $2,462 | $12,830 | $9,009 | 4.13% |
| 2025 | $66,169 | NA | $62,661 | $2,759 | $12,876 | NA | 4.17% |
| 2026 | $67,810 | NA | $62,329 | $2,961 | $13,197 | NA | 4.37% |
| 2027 | $67,487 | NA | NA | $3,102 | $13,967 | NA | 4.60% |
| Annualized Growth | 3.61% | -19.97% | 2.54% | 5.04% | 4.24% | 4.60% | 1.38% |
(Sources: FactSet Research Terminal)
ENB’s debt is expected to grow about 3.6% over time, slower than the cash flow that services it.
- slow and steady de-leveraging reducing its fundamental risk over time
- long-term borrowing costs are expected to remain 2.4% or less adjusted for inflation, some of the lowest costs of capital in the industry
ENB Bond Profile
- $6.4 billion in liquidity
- well-staggered bond maturity ladder, no trouble refinancing debt as it matures
- bond investors are willing to lend to ENB for 90 years at 5.7%
- the average borrowing cost is 4.25%
- 2.1% adjusted for inflation vs 4.6% returns on invested capital
- strong financial flexibility with 91% of debt unsecured
ENB Credit Default SWAPs: Real-Time Fundamental Risk-Assessment From The Bond Market
(Sources: FactSet Research Terminal)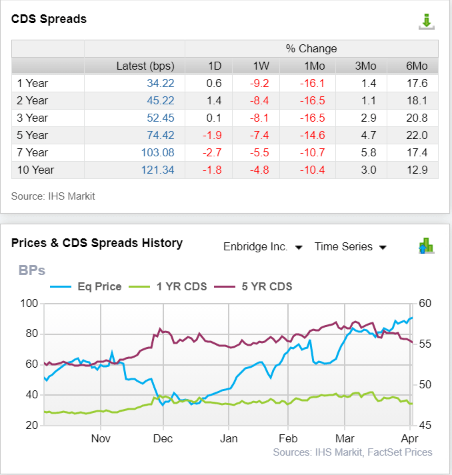
Credit default swaps are the insurance bond investors take out against default and provide real-time fundamental estimates from the bond market.
- useful for determining whether late-breaking news is fundamentally significant
- ENB’s default risk is consistent with BBB+ credit ratings and relatively stable over time
- the bond market estimates a 3.63% chance of default in the next 30 years
- slightly less than the rating agencies themselves
- the bond market indicates no major concern about ENB’s fundamental risk
- management, rating agencies, analysts, and the bond market all agree ENB’s thesis is intact
Profitability: Wall Street’s Favorite Quality Proxy
ENB’s profitability is historically above-average.
- up from 6/10 to 8/10 in the last quarter
In this industry, moatiness is determined by the asset base, management quality, and cost of capital advantage.
- ENB has irreplaceable assets, industry-leading management quality, and one of the lowest costs of capital
- a stable and wide moat
ENB Trailing 12-Month Profitability Vs Peers
| Metric | Industry Percentile | Major Oil & Gas Companies More Profitable Than ENB (Out Of 1,102) |
| Operating Margin | 68.86 | 343 |
| Net Margin | 72.66 | 301 |
| Return On Equity | 62.44 | 414 |
| Return On Assets | 63.25 | 405 |
| Return On Capital | 60.07 | 440 |
| Average | 65.46 | 381 |
(Source: GuruFocus Premium)
ENB’s profitability is in the top 3rd of its industry even when oil prices are over $100 and oil producers are minting money.
ENB’s profitability has been stable for 30 years, confirming the stability of its wide moat.
ENB Profit Margin Consensus Forecast
| Year | FCF Margin | EBITDA Margin | EBIT (Operating) Margin | Net Margin |
| 2020 | 16.8% | 34.0% | 24.5% | 12.5% |
| 2021 | 6.2% | 29.7% | 21.6% | 11.8% |
| 2022 | 14.7% | 31.1% | 21.0% | 12.8% |
| 2023 | 15.8% | 31.4% | 21.3% | 13.1% |
| 2024 | 18.9% | 31.5% | 22.1% | 14.3% |
| Annualized Growth | 2.97% | -1.87% | -2.49% | 3.29% |
| Annualized Growth (Ignoring Pandemic) | 44.72% | 1.92% | 0.85% | 6.51% |
(Sources: FactSet Research Terminal)
ENB’s profitability is expected to remain relatively stable with free cash flow margins soaring as it cuts back on growth capex spending after an epic growth year in 2021.
ENB Dividend Growth Consensus Forecast
| Year | Dividend Consensus | DCF/Share Consensus | Payout Ratio | Retained (Post-Dividend) Distributable Cash Flow | Buyback Potential | Debt Repayment Potential |
| 2021 | $2.63 | $3.91 | 67.3% | $2,593 | 1.92% | 4.3% |
| 2022 | $2.77 | $4.30 | 64.4% | $3,100 | 2.30% | 5.2% |
| 2023 | $2.86 | $4.42 | 64.7% | $3,161 | 2.34% | 5.4% |
| 2024 | $2.94 | $4.54 | 64.8% | $3,242 | 2.40% | 5.5% |
| 2025 | $2.97 | $4.64 | 64.0% | $3,383 | 2.51% | 5.7% |
| 2026 | $3.05 | $4.74 | 64.3% | $3,424 | 2.54% | 5.2% |
| 2027 | $3.50 | $5.12 | 68.4% | $3,282 | 2.43% | 4.8% |
| Total 2021 Through 2027 | $20.72 | $31.67 | 65.4% | $22,184.70 | 16.43% | 37.21% |
| Annualized Rate | 4.88% | 4.60% | 0.27% | 4.00% | 4.00% | 1.80% |
(Sources: FactSet Research Terminal)
- 83% is the safe DCF payout ratio rating agencies like to see in this industry
- ENB’s payout ratio policy is 60% to 70% and analysts expect 66% through 2026
ENB’s DCF payout ratio is expected to be in the mid-range of management’s 60% to 70% guidance.
- one of the largest buyback authorizations in midstream
- $1.2 billion
ENB Buyback Consensus Forecast
| Year | Consensus Buybacks ($ Millions) | % Of Shares (At Current Valuations) | Market Cap |
| 2022 | $802.0 | 0.8% | $94,475 |
| 2023 | $1,604.0 | 1.7% | $94,475 |
| 2024 | $1,604.0 | 1.7% | $94,475 |
| 2025 | $2,005.0 | 2.1% | $94,475 |
| 2026 | $2,005.0 | 2.1% | $94,475 |
| 2027 | $2,005.0 | 2.1% | $94,475 |
| Total 2022-2027 | $10,025.00 | 10.6% | $94,475 |
| Annualized Rate | 1.85% | Average Annual Buybacks | $1,670.83 |
(Sources: FactSet Research Terminal)
Analysts expect ENB to have the most aggressive buybacks in the industry by far, with $2 billion per year in buybacks after 2024.
ENB stopped using stock to finance growth after acquiring its MLPs in 2018.
If ENB does buy back stock at the rate analysts expect, it could be a game-changer for investors.
- 8.4% FCF yield right now
- 9.2% DCF yield right now
- each share ENB repurchases boosts FCF/share and DCF/share
- and makes the dividend that much safer
- and shares slightly more valuable
| Time Frame (Years) | Net Buyback Rate | Shares Remaining | Net Shares Repurchased | Each Share You Own Is Worth X Times More (Not Including Future Growth And Dividends) |
| 5 | 1.9% | 91.09% | 8.91% | 1.10 |
| 10 | 1.9% | 82.97% | 17.03% | 1.21 |
| 15 | 1.9% | 75.57% | 24.43% | 1.32 |
| 20 | 1.9% | 68.83% | 31.17% | 1.45 |
| 25 | 1.9% | 62.70% | 37.30% | 1.59 |
| 30 (Retirement Time Frame) | 1.9% | 57.11% | 42.89% | 1.75 |
| 35 | 1.9% | 52.02% | 47.98% | 1.92 |
| 40 | 1.9% | 47.38% | 52.62% | 2.11 |
| 45 | 1.9% | 43.16% | 56.84% | 2.32 |
| 50 | 1.9% | 39.31% | 60.69% | 2.54 |
| 55 | 1.9% | 35.81% | 64.19% | 2.79 |
| 60 | 1.9% | 32.62% | 67.38% | 3.07 |
| 65 | 1.9% | 29.71% | 70.29% | 3.37 |
| 70 | 1.9% | 27.06% | 72.94% | 3.70 |
| 75 | 1.9% | 24.65% | 75.35% | 4.06 |
| 80 | 1.9% | 22.45% | 77.55% | 4.45 |
| 85 | 1.9% | 20.45% | 79.55% | 4.89 |
| 90 (Bond Market Time Frame) | 1.9% | 18.63% | 81.37% | 5.37 |
| 95 | 1.9% | 16.97% | 83.03% | 5.89 |
| 100 | 1.9% | 15.45% | 84.55% | 6.47 |
(Sources: FactSet Research Terminal)
Over the decades ENB could buy back most of its shares, significantly increasing the value of the stock independent of its future growth and dividends.
Reason Two: Decades Of Steady Growth Ahead
We’ve already seen how ENB has potentially a century of steady growth ahead of it, making it the ultimate buy-and-hold forever midstream aristocrat.
What kind of medium-term growth do analysts expect from the 2nd largest growth backlog in the industry?
ENB Medium-Term Growth Consensus Forecast
| Year | Sales | Free Cash Flow | EBITDA | EBIT (Operating Income) | Net Income |
| 2020 | $30,763 | $5,164 | $10,446 | $7,525 | $3,852 |
| 2021 | $37,105 | $2,310 | $11,037 | $8,000 | $4,376 |
| 2022 | $39,831 | $5,841 | $12,368 | $8,360 | $5,088 |
| 2023 | $40,446 | $6,402 | $12,690 | $8,634 | $5,293 |
| 2024 | $40,741 | $7,688 | $12,830 | $9,009 | $5,806 |
| 2025 | NA | $6,465 | $12,876 | NA | $7,471 |
| 2026 | NA | $6,586 | $13,197 | NA | $7,530 |
| 2027 | NA | $6,756 | $13,967 | NA | NA |
| Annualized Growth | 7.28% | 3.91% | 4.24% | 4.60% | 11.82% |
| Annualized Growth (Ignoring Pandemic) | 3.17% | 19.59% | 3.02% | 4.04% | 11.47% |
(Sources: FactSet Research Terminal)
ENB’s top and bottom lines are expected to grow at a modest rate over time.
| Metric | 2021 Growth Consensus | 2022 Growth Consensus | 2023 Growth Consensus | 2024 Growth Consensus | 2025 Growth Consensus | 2026 Growth Consensus |
2027 Growth Consensus |
| Sales | 29% | 5% | 1% | 0% | NA | NA | NA |
| Dividend | 3% | 3% (Official) | 3% | 3% | 1% | 3% | 15% |
| Operating Cash Flow | 0% | 28% | -1% | 5% | NA | NA | NA |
| EBITDA | 7% | 35% | 3% | 1% | NA | NA | NA |
| EBIT (operating income) | 5% | 40% | 2% | 6% | NA | NA | NA |
(Sources: FAST Graphs, FactSet Research Terminal)
By 2027 analysts expect ENB’s dividend growth streak to reach 32 years.
What about the long-term?
ENB Long-Term Growth Outlook
(Sources: FactSet Research Terminal)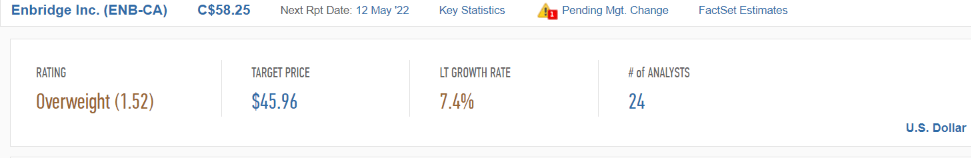
- 7.5% to 8.3% CAGR growth consensus range (five sources)
- 5% to 7% CAGR management guidance
- individual analyst estimate range: 5.0% to 9.8% CAGR
- we use the mid-range 6% management guidance
How good are analysts at forecasting ENB’s growth over time?
Smoothing for outliers, historical analyst margins of error are 10% to the downside, and 25% to the upside.
- 6% to 11% CAGR adjusted growth consensus range.
- 5% to 11% CAGR including management guidance.
ENB is expected to recover from the worst oil crash in human history (-$38 oil) and return to historical growth rates.
- the 2nd largest growth backlog in the industry makes this reasonable
- as does the massive growth opportunity in offshore wind
- as does the potential for up to 2% annual buybacks
Reason Three: A Wonderful Company At A Fair Price
Outside of bear markets, bubbles, and periods of hyper-growth tens of millions of investors have consistently paid 10 to 12X cash flow for ENB, for 20 years.
- 91% statistical probability that ENB’s intrinsic value is within this range
| Metric | Historical Fair Value Multiples (13-Years) | 2021 | 2022 | 2023 | 2024 |
12-Month Forward Fair Value |
| 5-Year Average Yield (Pure Industry Bear Market) | 6.38% | $41.22 | $43.27 | $43.27 | $46.08 | |
| 13-Year Median Yield | 3.84% | $68.49 | $71.90 | $71.90 | $76.56 | |
| Operating Cash Flow | 10.06 | $38.83 | $49.39 | $49.39 | $52.01 | |
| Average | $46.43 | $52.39 | $52.39 | $55.57 | $52.39 | |
| Current Price | $46.10 | |||||
|
Discount To Fair Value |
0.71% | 12.01% | 12.01% | 17.04% | 12.01% | |
|
Upside To Fair Value (NOT Including Dividends) |
0.72% | 13.64% | 13.64% | 20.54% | 13.64% (19.6% including dividend) | |
| 2022 OCF | 2023 OCF | 2022 Weighted OCF | 2023 Weighted OCF | 12-Month Forward OCF | 12-Month Average Fair Value Forward P/OCF |
Current Forward P/OCF |
| $4.91 | $4.91 | $3.59 | $1.32 | $4.91 | 10.67 | 9.39 |
No long-term investor, who avoided becoming a forced seller for emotional or financial reasons has ever regretted buying ENB at 9.4X cash flow.
And given the information we have today I can say with 80% confidence that today won’t be the first time.
| Rating | Margin Of Safety For Low-Risk 13/13 Ultra SWAN Quality Companies | 2022 Price | 2023 Price |
12-Month Forward Fair Value |
| Potentially Reasonable Buy | 0% | $52.39 | $52.39 | $52.39 |
| Potentially Good Buy | 5% | $49.77 | $49.77 | $49.77 |
| Potentially Strong Buy | 15% | $44.53 | $44.53 | $44.53 |
| Potentially Very Strong Buy | 25% | $37.33 | $39.29 | $39.29 |
| Potentially Ultra-Value Buy | 35% | $34.05 | $34.05 | $34.05 |
| Currently | $46.05 | 12.10% | 12.10% | 12.10% |
| Upside To Fair Value (Not Including Dividends) | 13.77% | 13.77% | 13.77% |
For anyone comfortable with its risk profile ENB is a potentially good buy and here’s why.
Consensus Return Potential Far Better Than The Market’s
For context, here’s the return potential of the 16% overvalued S&P 500.
| Year | EPS Consensus | YOY Growth | Forward PE | Blended PE | Overvaluation (Forward PE) |
Overvaluation (Blended PE) |
| 2021 | $206.25 | 50.34% | 20.7 | 21.9 | 20% | 25% |
| 2022 | $225.56 | 9.36% | 20.0 | 20.3 | 16% | 16% |
| 2023 | $248.01 | 9.95% | 18.2 | 19.1 | 6% | 8% |
| 2024 | $275.55 | 11.10% | 16.4 | 17.3 | -5% | -2% |
| 12-Month forward EPS | 12-Month Forward PE | Historical Overvaluation | PEG | 25-Year Average PEG | S&P 500 Dividend Yield |
25-Year Average Dividend Yield |
| $231.60 | 19.475 | 15.58% | 2.29 | 3.62 | 1.41% | 2.01% |
(Source: DK S&P 500 Valuation And Total Return Tool)
Stocks have already priced in 95% EPS growth from 2020 through 2024 and are trading at 20X forward earnings.
- 16.85 is the 25-year average
- 16.9 is the 10-year average (low rate era)
- 16.9 is the 45-year average
- 91% probability that stocks are worth about 17X forward earnings
- A 13.5% correction needed to get back to the historical market fair value
S&P 500 2027 Consensus Return Potential
| Year | Upside Potential By End of That Year | Consensus CAGR Return Potential By End of That Year | Probability-Weighted Return (Annualized) | Inflation And Risk-Adjusted Expected Returns |
Expected Market Return Vs Historical Inflation-Adjusted Return |
| 2027 | 34.84% | 6.16% | 4.62% | 1.21% | 18.91% |
(Source: DK S&P 500 Valuation And Total Return Tool)
Adjusted for inflation, the risk-expected returns of the S&P 500 are about 1% for the next five years.
- 19% of the S&P’s historical inflation-adjusted returns of 6.4% CAGR
S&P 500 Interest Rate Adjusted Fair Value
| S&P Earnings Yield | 10-Year US Treasury Yield | Earning Yield Risk-Premium (3.7% 10 and 20-year average) |
| 5.13% | 2.65% | 2.48% |
| Theoretical Interest Rate Justified Market Fair Value Forward PE | Current PE |
Theoretically Interest Rate Justified Market Decline |
| 15.75 | 19.47 | 19.14% |
(Source: DK S&P 500 Valuation And Total Return Tool)
Even adjusting for interest rates, stocks still require an even larger 19% correction before they become theoretically fairly valued.
But here’s what investors can reasonably expect if ENB grows as expected over the next five years.
- 5-year consensus return potential range: 9% to 16% CAGR
ENB 2024 Consensus Return Potential
(Source: FAST Graphs, FactSet Research)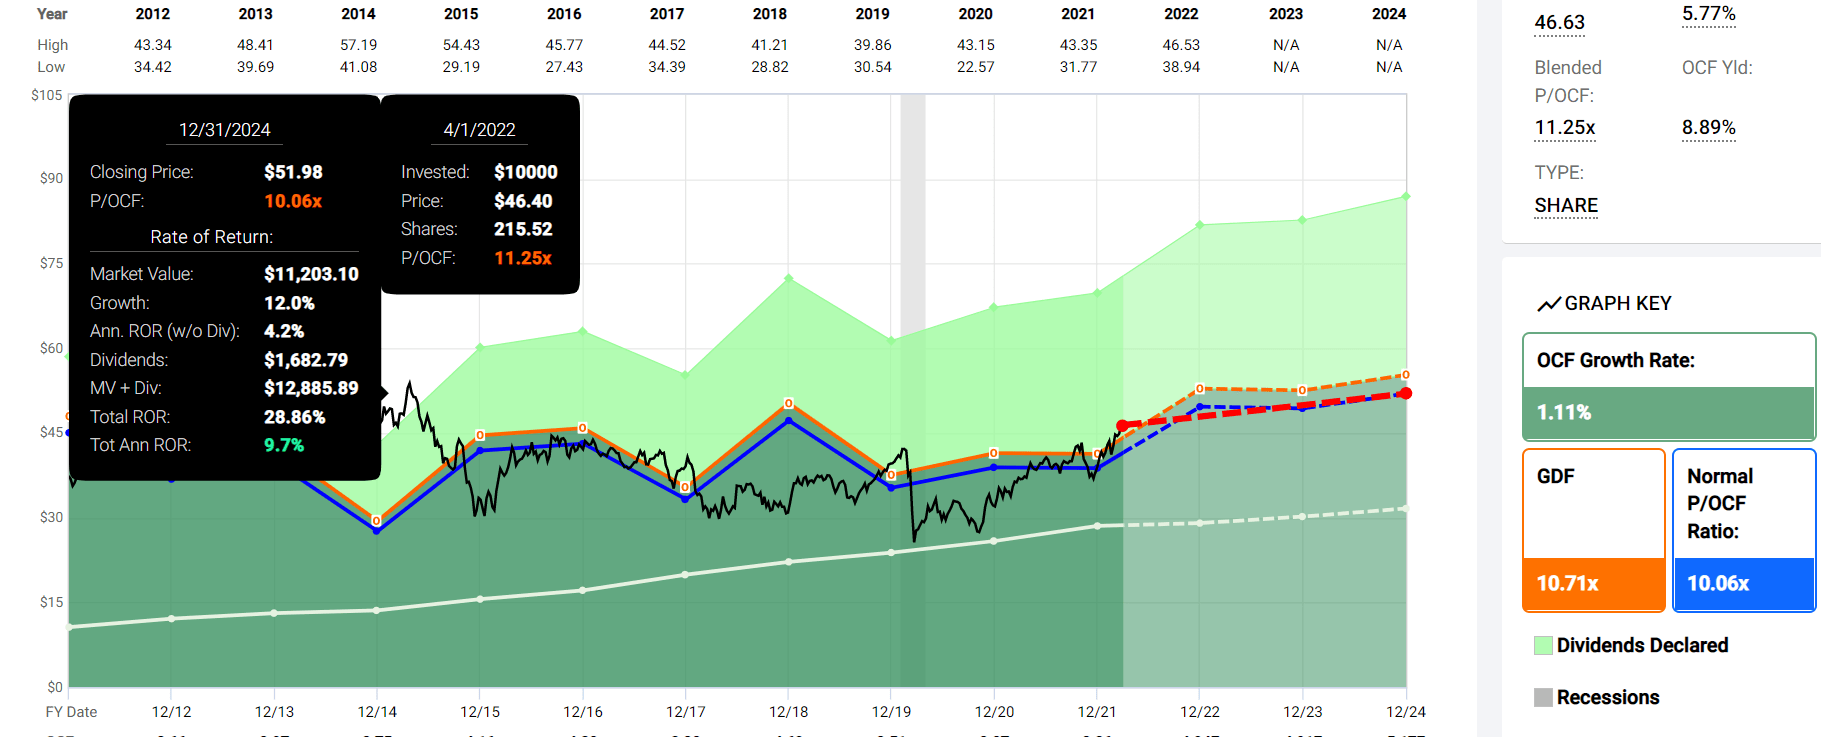
If ENB grows as expected through 2024 and returns to historical fair value then it is expected to deliver high-single-digit total returns.
ENB 2027 Consensus Return Potential
(Source: FAST Graphs, FactSet Research)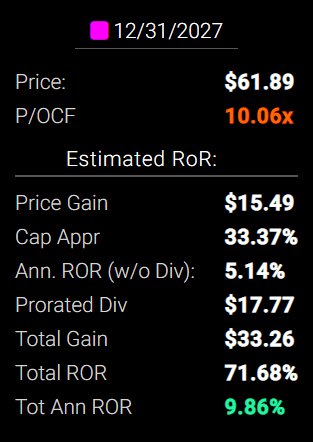
Over the next five years, it could conservatively deliver 72% returns or 10% annually.
More than 2X the S&P 500 consensus.
What does that mean?
ENB Investment Decision Score
DK (Source: DK Automated Investment Decision Tool)
For anyone comfortable with its risk profile, ENB is a potentially very good high-yield aristocrat investment.
- 11% discount vs 20% market premium = 31% better valuation
- far superior fundamental quality and safety
- 20% higher long-term return potential than S&P 500 overtime
- almost 2X the risk-adjusted expected return for the next five years
- more than 4X the yield
- and a much safer yield at that (as confirmed by the 27-year dividend growth streak)
Risk Profile: Why Enbridge Isn’t Right For Everyone
- Canadian Company: foreign diversification
- 15% tax withholding (not in retirement accounts) – tax credit available to recoup withheld dividend
- 1099 tax form, qualified dividends
- NO K1 tax form
What Could Cause ENB’s Investment Thesis To Break
- safety falls to 40% or less
- balance sheet collapses
- business model completely disrupted
- management’s long-term energy transition plan fails
- growth outlook falls to less than 2% for seven years
- ENB’s role in my portfolio is to deliver long-term 8+% returns with minimal fundamental risk
- like all non-defensive sectors (anything that’s not REITs, utilities, midstream, healthcare, telecom, consumer staples), I target 10+% long-term return potential for all recommendations
How long it takes for a company’s investment thesis to break depends on the quality of the company.
| Quality |
Years For The Thesis To Break Entirely |
| Below-Average | 1 |
| Average | 2 |
| Above-Average | 3 |
| Blue-Chip | 4 |
| SWAN | 5 |
| Super SWAN | 6 |
| Ultra SWAN | 7 |
| 100% Quality Companies (LOW and MA) | 8 |
These are my personal rule of thumb for when to sell a stock if the investment thesis has broken.
ENB is highly unlikely to suffer such catastrophic declines in fundamentals.
There are no risk-free companies and no company is right for everyone. You have to be comfortable with the fundamental risk profile.
ENB Risk Profile Summary
Enbridge’s biggest challenges are primarily regulatory, legal, and other stakeholder risks related to identifying and executing on projects within its growth portfolio. Challenges over Line 3, 5, and its small stake in the Dakota Access Pipeline offer clear examples of the potentially higher costs and lost earnings involved.
Material ESG exposures create additional risk for midstream investors. In this industry, the most significant exposures are greenhouse gas emissions (from upstream extraction, midstream operations, and downstream consumption), and other emissions, effluents, pipeline spills, and opposition and protests.
In addition to the reputational threat, these issues could force climate-conscious consumers away from fossil fuels in greater numbers, resulting in long-term demand erosion. Climate concerns could also trigger regulatory interventions, such as production limits, removal of existing infrastructure, and perhaps even direct taxes on carbon emissions, which already exist in Canada. Notably, Enbridge recently entered a $1 billion sustainability-linked credit facility and $1 billion bonds, which links its ESG performance to borrowing costs.” – Morningstar
ENB’s Risk Profile Includes
- political/regulatory risk (US and Canada plus Europe)
- project execution risk
- green energy transition risk (most renewable projects are not as profitable as oil & gas)
- litigation risk (over projects and industrial accidents)
- industrial accident risk (up to $1 billion per accident cost)
- M&A execution risk (ENB has historically been very acquisitive)
- talent retention risk
- supply chain disruption risk (causing havoc globally right now)
- currency risk
When commodity prices increase, especially energy, the dollar tends to fall against the CAD.
- a falling dollar means rising US dividends for investors in Canadian dividend stocks
- mean reversion over time means no need to hedge or worry excessively about CAD dividends
- ENB is 95% hedged on USD/CAD exposure in 2022
How do we quantify, monitor, and track such a complex risk profile? By doing what big institutions do.
Material Financial ESG Risk Analysis: How Large Institutions Measure Total Risk
- 4 Things You Need To Know To Profit From ESG Investing
- What Investors Need To Know About Company Long-Term Risk Management (Video)
Here is a special report that outlines the most important aspects of understanding long-term ESG financial risks for your investments.
- ESG is NOT “political or personal ethics based investing”
- it’s total long-term risk management analysis
ESG is just normal risk by another name.” Simon MacMahon, head of ESG and corporate governance research, Sustainalytics” – Morningstar
ESG factors are taken into consideration, alongside all other credit factors, when we consider they are relevant to and have or may have a material influence on creditworthiness.” – S&P
S&P, Fitch, Moody’s, DBRS (Canadian rating agency), AMBest (insurance rating agency), R&I Credit Rating (Japanese rating agency), and the Japan Credit Rating Agency have been using ESG models in their credit ratings for decades.
- credit and risk management ratings make up 41% of the DK safety and quality model
- dividend/balance sheet/risk ratings make up 82% of the DK safety and quality model
Dividend Aristocrats: 67th Industry Percentile On Risk Management (Above-Average, 24/100 Medium Risk)
ENB’s risk management has been ranked among the best among its peers not just by these four rating agencies, but also by MSCI, ISS, State Street, and Wells Fargo.
ENB Long-Term Risk-Management Consensus
| Rating Agency | Industry Percentile |
Rating Agency Classification |
| Morningstar/Sustainalytics 20 Metric Model | 94.5% |
22.0/100 medium-Risk |
| Reuters’/Refinitiv 500+ Metric Model | 95.4% | Excellent |
| S&P 1,000+ Metric Model | 75.0% |
Good, Stable Trend |
| FactSet | 30.0% |
Below-Average, Stable Trend |
| Morningstar Global Percentile (All 15,000 Rated Companies) | 69.5% | Good |
| Consensus | 73% |
Low-Risk, Good Risk-Management, Stable Trend |
(Sources: Morningstar, Reuters’, S&P, FactSet Research)
ENB’s Long-Term Risk Management Is The 154th Best In The Master List (69th Percentile)
For Context:
| Classification | Average Consensus LT Risk-Management Industry Percentile |
Risk-Management Rating |
| Dividend Champions | 57 | Average |
| Monthly Dividend Stocks | 60 | Above-Average |
| Hyper-Growth stocks | 61 | Above-Average |
| Master List average | 62 | Above-Average |
| Dividend Kings | 63 | Above-Average |
| Dividend Aristocrats | 67 | Above-Average |
| Low Volatility Stocks | 68 | Above-Average |
| Ultra SWANs | 71 | Good |
| Enbridge | 73 | Good |
| Foreign Dividend Stocks | 75 | Good |
| Strong ESG Stocks | 78 |
Good – Bordering On Very Good |
| S&P Global (SPGI) | 94 | Exceptional |
ENB’s risk-management consensus is in the top 31% of the world’s highest quality companies and similar to that of such other companies as
- T. Rowe Price (TROW) – dividend aristocrat
- Becton, Dickinson and Company (BDX) – dividend king
- Expeditors International (EXPD) – dividend aristocrat
- Federal Realty Investment Trust (FRT) – dividend king
- Johnson & Johnson (JNJ) – dividend king
- NextEra Energy (NEE) – dividend aristocrat
- Stanley Black & Decker (SWK) – dividend king
- Clorox (CLX) – dividend aristocrat
- Home Depot
- QUALCOMM
- Cisco (CSCO)
The bottom line is that all companies have risks, and ENB is good at managing theirs.
How We Monitor ENB’s Risk Profile
- 24 analysts
- 4 credit rating agencies
- 7 total risk rating agencies
- 31 experts who collectively know this business better than anyone other than management
- and the bond market for real-time fundamental risk-assessments
When the facts change, I change my mind. What do you do sir?” – John Maynard Keynes
There are no sacred cows at iREIT or Dividend Kings. Wherever the fundamentals lead we always follow. That’s the essence of disciplined financial science, the math behind retiring rich and staying rich in retirement.
Bottom Line: 6% Yielding Enbridge Is The Perfect Dividend Aristocrat To Help You Retire In Safety And Splendor
Interests are starting to rise, in fact, at a pretty impressive rate.
Daily Shot 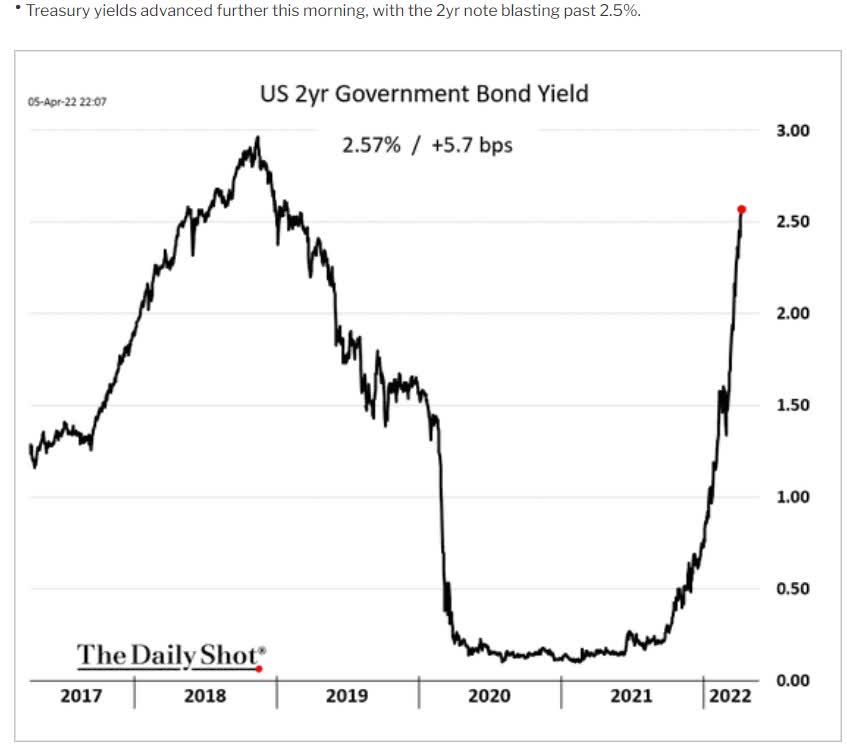
But we’re still a long way off from retirees being able to earn sufficient risk-free income to pay the bills, much less retire rich, and stay rich in retirement.
But that’s where high-yield aristocrats like Enbridge can help.
Reasons To Potentially Buy Enbridge
- 89% quality low-risk 13/13 Ultra SWAN quality global aristocrat
- very safe 6% yield (89% safety score)
- 0.5% average recession dividend cut risk
- 1.6% severe recession cut risk
- 27-year dividend growth streak
- 11% conservatively undervalued (potential good buy)
- Fair Value: $52.39 (10.7X cash flow)
- 9.4X cash flow vs 10 to 12 historical
- BBB+ stable outlook credit rating = 5% 30-year bankruptcy risk
- risk management consensus 73rd industry percentile = Good
- bond market is confident ENB will still have a stable business in 2112
- 5% to 11% CAGR margin-of-error growth consensus range
- 7.4% CAGR median growth consensus
- management growth guidance 5% to 7% CAGR
- 5-year consensus total return potential: 9% to 16% CAGR
- base-case 5-year consensus return potential: 10% CAGR (over 2X market consensus)
- consensus 12-month total return forecast: 5% (9.2X cash flow)
- Fundamentally Justified 12-Month Returns: 18% CAGR
After being medically retired from Army medicine I vowed that I would find a way to keep serving my country, and the world, by helping people like you achieve the rich retirement you deserve.
I make millionaires, it’s what I do.” -Lori Greiner
I can’t personally make you rich, but I can show you the companies that can.
If you’re looking for one of the highest-yielding aristocrats on earth, consider Enbridge.
Looking for a potential buy and hold forever high-yield blue-chip? Well, the bond market says ENB will be around in 2112, long after most of us are gone.
Looking for a reasonably priced way to maximize safe yield today and achieve potentially market and aristocrat beating returns for decades to come?
ENB’s exceptional management says it can deliver 11% to 13% long-term returns that can help you potentially retire in safety and splendor.
In a world that’s always changing, and full of risks that can cost income investors sleep, it’s time to focus on safety and quality first.
In a market that’s being roiled by extreme volatility and fears over the Fed, inflation, and war, it’s time to choose stability and dependability.
In a low-rate world where bonds are likely to never again offer a decent yield, Enbridge is a potentially wonderful 6% yielding Ultra SWAN dividend aristocrat solution.
Enbridge is a great example of how, no matter your goals, time horizon, or risk profile, something wonderful is always on safe on Wall Street if you know where to look.
Be the first to comment