

Deagreez
Bear markets are like hurricanes in Florida, an inevitable period of short-term pain that you just have to deal with.
There are ways to minimize the agony, but if you try to sit out bear markets entirely, then you simply will not get rich owning stocks.
Bank of America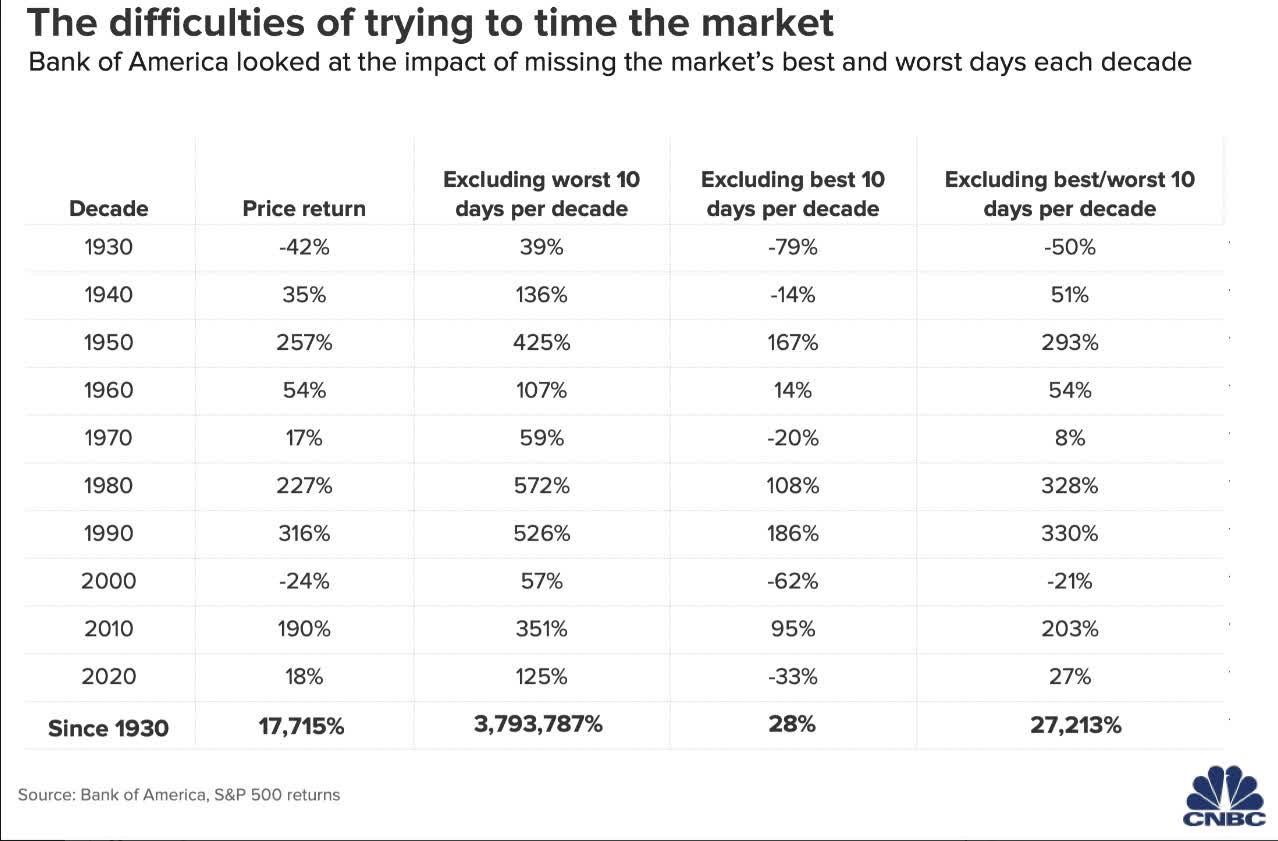
Bear markets are when 99.84% of long-term returns are generated from the single best daily gains, which mostly occur during periods of the most intense market volatility.
- 80% of the single best days occur within 2 weeks of the single worst days
But guess what’s a great way to stay sane and safe in bear markets? Blue-chip dividends!
Short-term gains are vanity, cash flow is sanity, and dividends are reality. – Paraphrase of Dragon’s Den UK
Dividends are real, tangible, and can help you truly achieve financial freedom.
Why? Because if you can generate enough income to life off in retirement, then you never have to sell stock. And then the market’s wild gyrations in times like these are 100% irrelevant.
Only the safety of your dividends matters, and that’s were world-beater Ultra SWAN (sleep well at night) high-yield aristocrats like Enbridge (NYSE:ENB) shine.
Let me show you the three reasons why Enbridge is a 7% yielding dividend aristocrat perfect for this recession, bear market, and all future market downturns in the years and decades to come.
Reason One: Enbridge Is The Complete Safe Ultra-Yield Rich Retirement Package
Here is the bottom line up front on Enbridge.
- Canadian Company: foreign diversification
- 15% tax withholding (not in retirement accounts) – tax credit available to recoup withheld dividend
- 1099 tax form, qualified dividends
- NO K1 tax form
(Source: August investor presentation)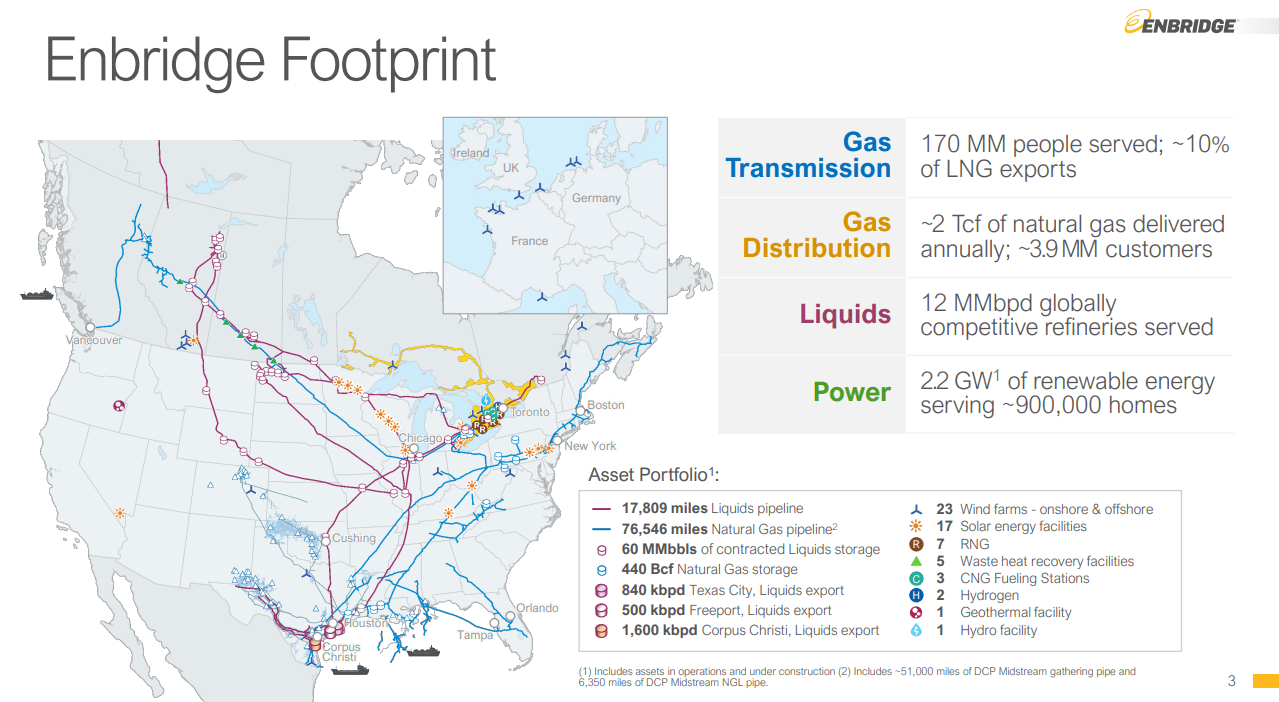
Enbridge has the continent’s largest, most diversified, and widest moat midstream network, without which our economy couldn’t operate.
(Source: August investor presentation)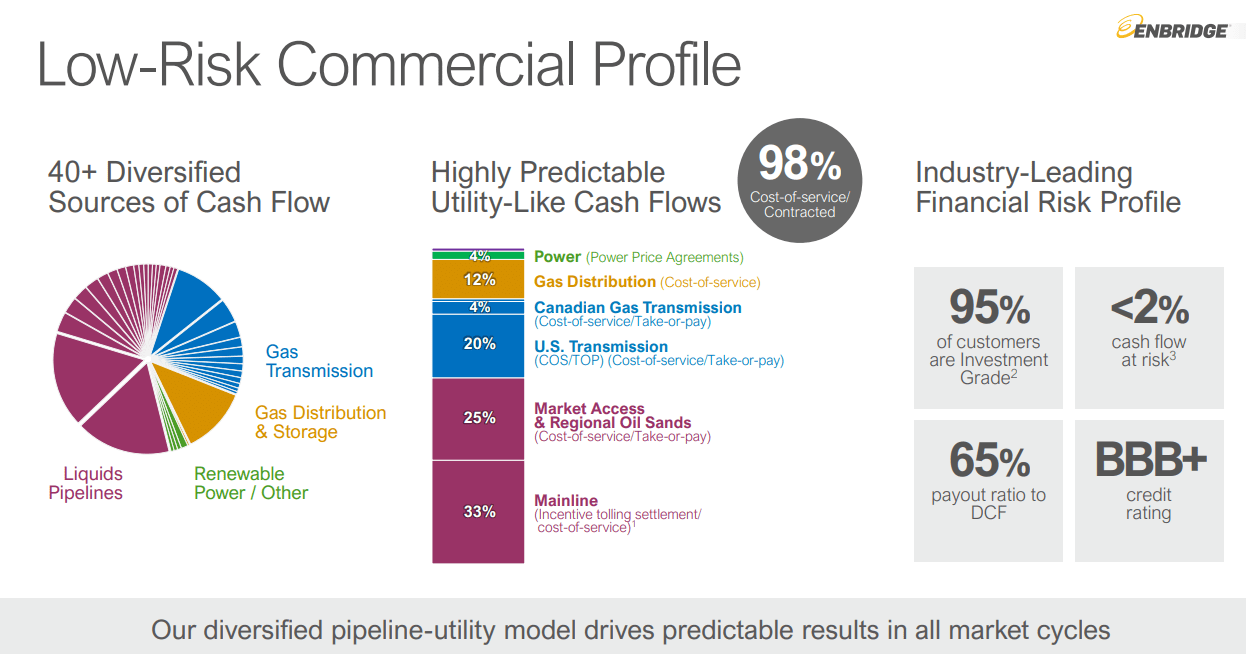
It’s the most utility-like midstream, with less than 2% cash flow sensitivity to commodity prices.
(Source: August investor presentation)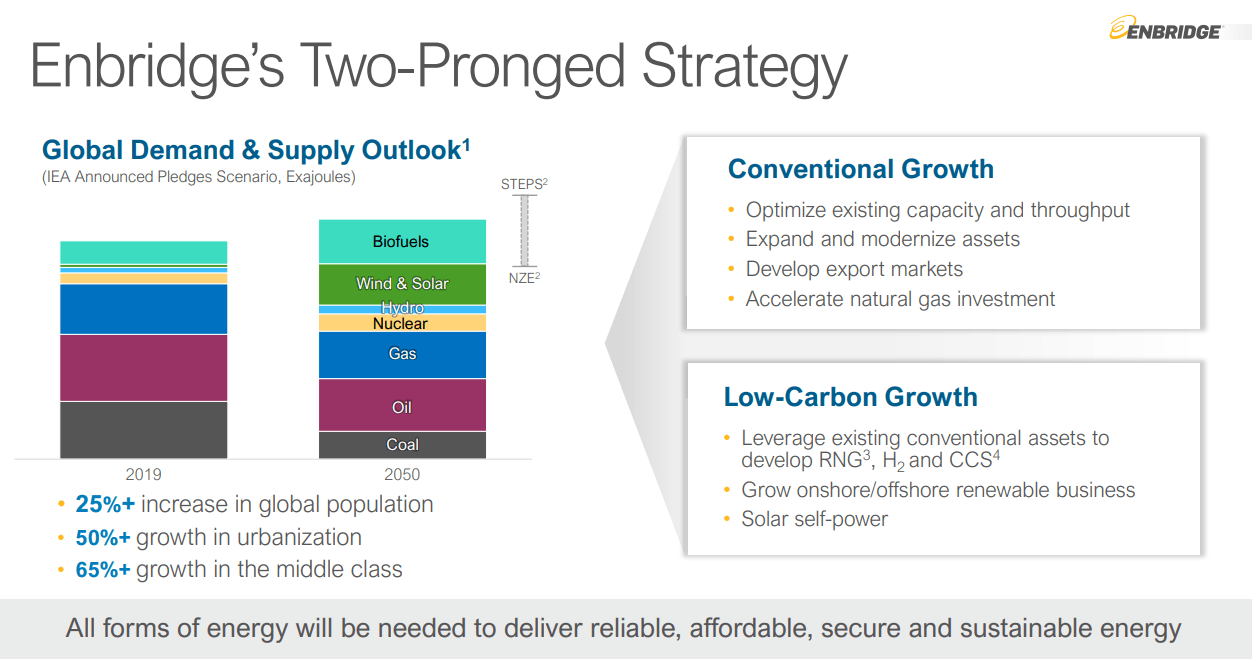
ENB is the most advanced midstream regarding the energy transition, having spent 20 years building up its renewable energy portfolio.
- 59 green energy projects and counting
(Source: August investor presentation)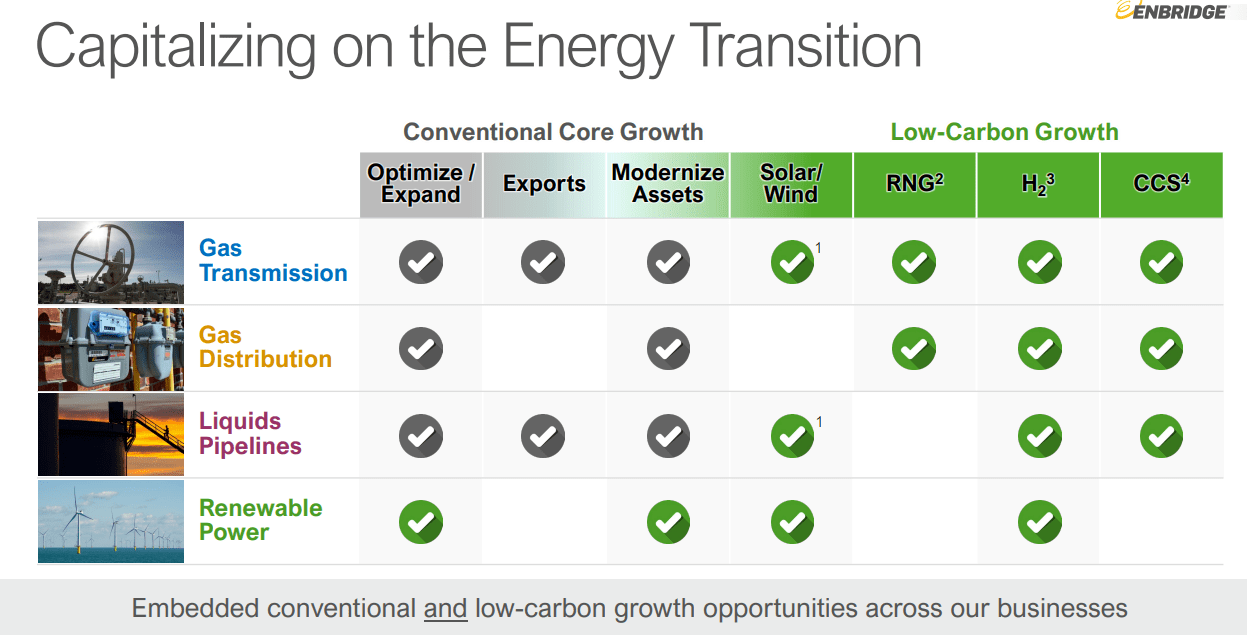
ENB does not just keep our economy running today, but it’s also a pioneer in clean hydrogen, carbon sequestration, renewal natural gas (methane from landfills), and solar and wind farms.
(Source: August investor presentation)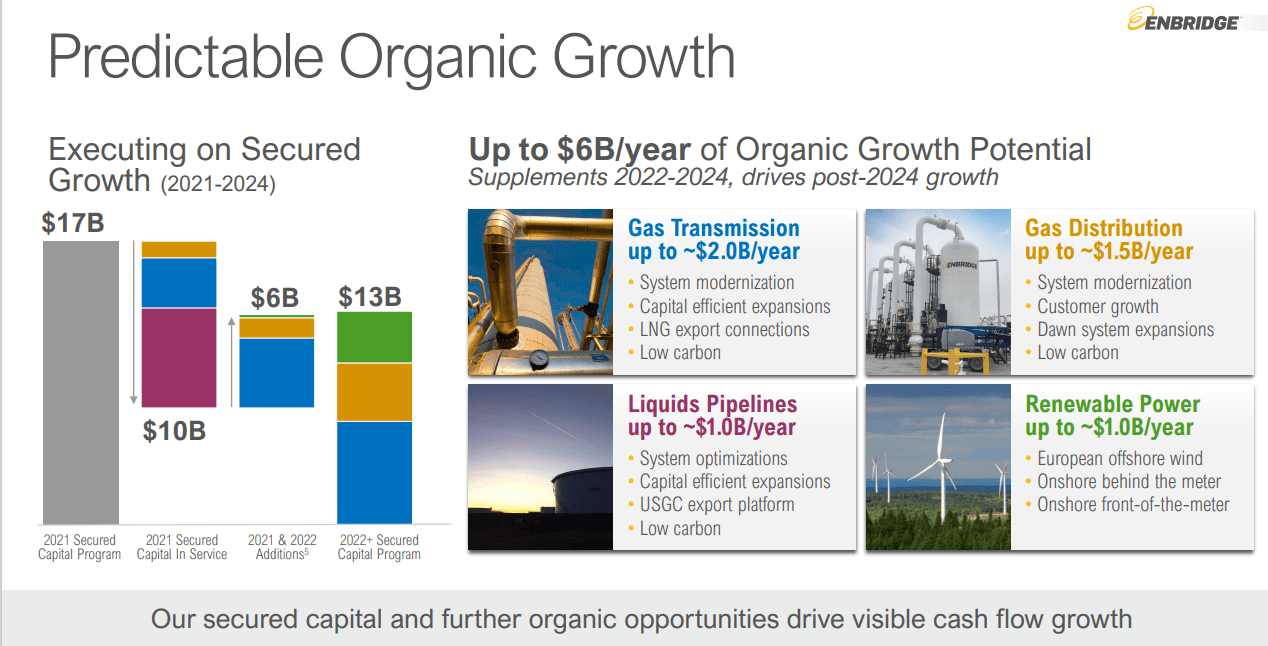
ENB is working on $9.4 billion in growth projects and has a backlog of growth projects that management believes can sustain $4.3 billion in growth spending per year for the foreseeable future.
YCharts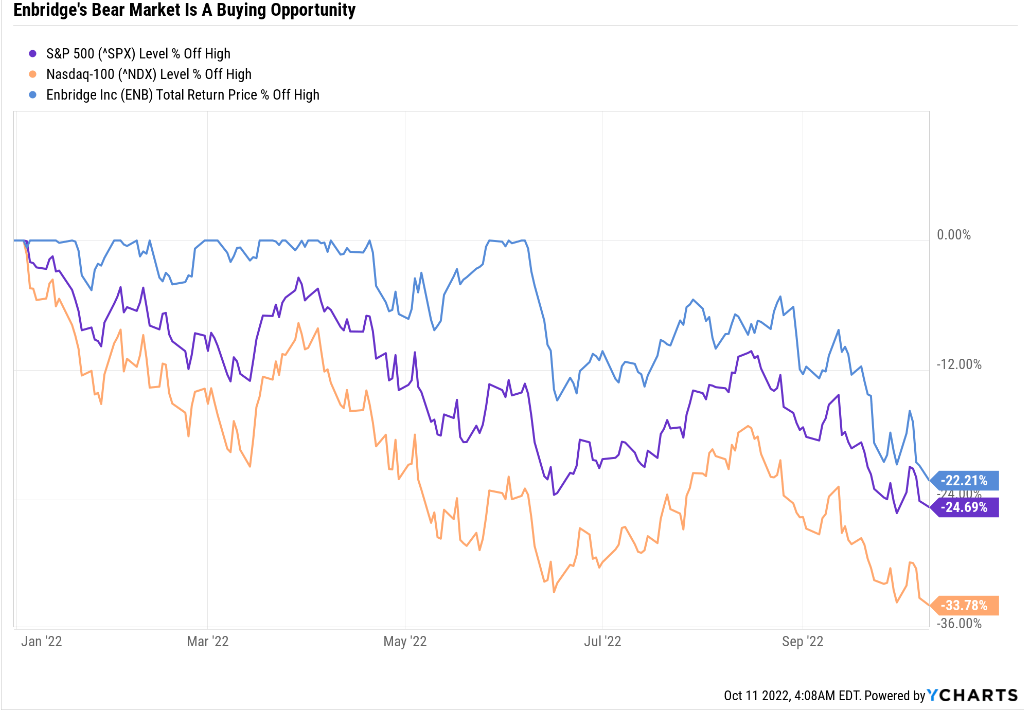
ENB has fallen in recent weeks, hard and fast, and has now joined the broader market in a bear market.
ENB Credit Ratings
| Rating Agency | Credit Rating | 30-Year Default/Bankruptcy Risk | Chance of Losing 100% Of Your Investment 1 In |
| S&P | BBB+ Stable Outlook | 5.00% | 20.0 |
| Fitch | BBB+ Stable Outlook | 5.00% | 20.0 |
| Moody’s | Baa1 (BBB+ equivalent) Stable Outlook | 5.00% | 20.0 |
| DBRS | BBB High (BBB+ equivalent) Stable Outlook | 5.00% | 20.0 |
| Consensus | BBB+ Stable Outlook | 5.00% | 20.0 |
(Source: S&P, DBRS, Moody’s)
There is nothing wrong with ENB’s balance sheet, which is tied for the strongest in the industry, with a 5% fundamental risk.
(Source: FactSet Research Terminal) (Source: FactSet Research Terminal)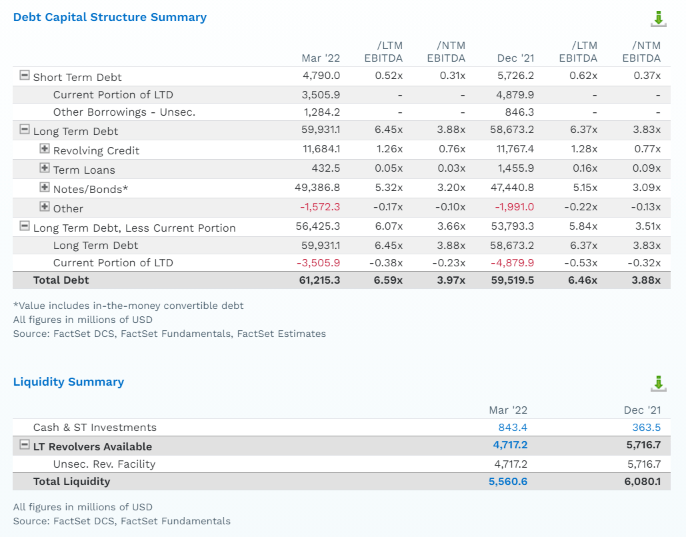
(Source: FactSet Research Terminal)
ENB’s leverage is temporarily elevated but expected to come in next year at just 4.0X debt/EBITDA.
- 5.0X or less is safe according to rating agencies
- one of the lowest leverage ratios in the industry
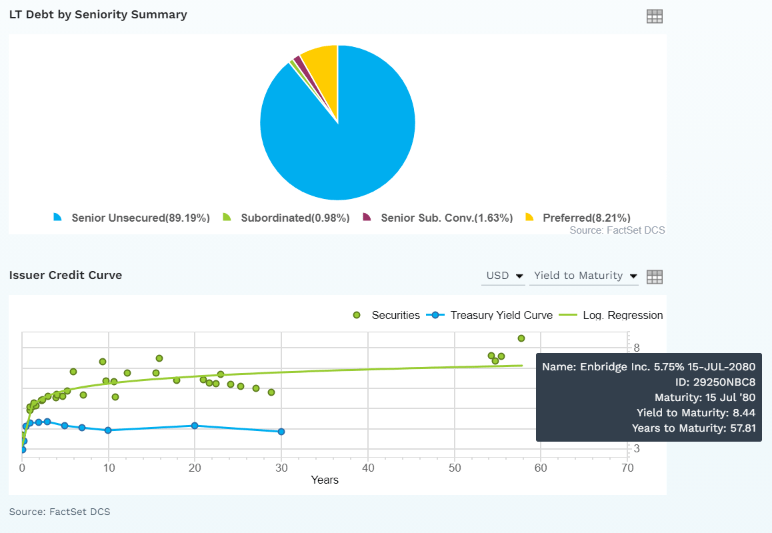
ENB has nearly $6 billion in liquidity and well-staggered bond maturities. After paying off its oldest bonds in the last quarter (matured in 2,112), the bond market is now willing to lend to it for almost 60 years at 8.4% (5.75% originally).
(Source: FactSet Research Terminal)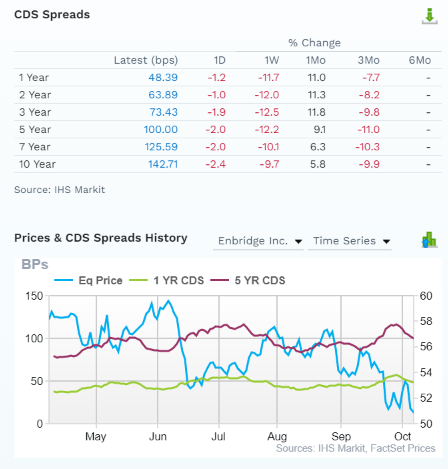
The bond market is pricing in 4.3% 30-year default risk, with stable fundamental risk over time.
- consistent with its BBB+ stable credit rating
Credit default swaps or CDS are the bond market’s real-time fundamental risk assessment based on bond investors’ insurance policies against defaults.
- CDS confirms in-real time (when news breaks) whether a company’s investment thesis remains intact
(Source: August investor presentation)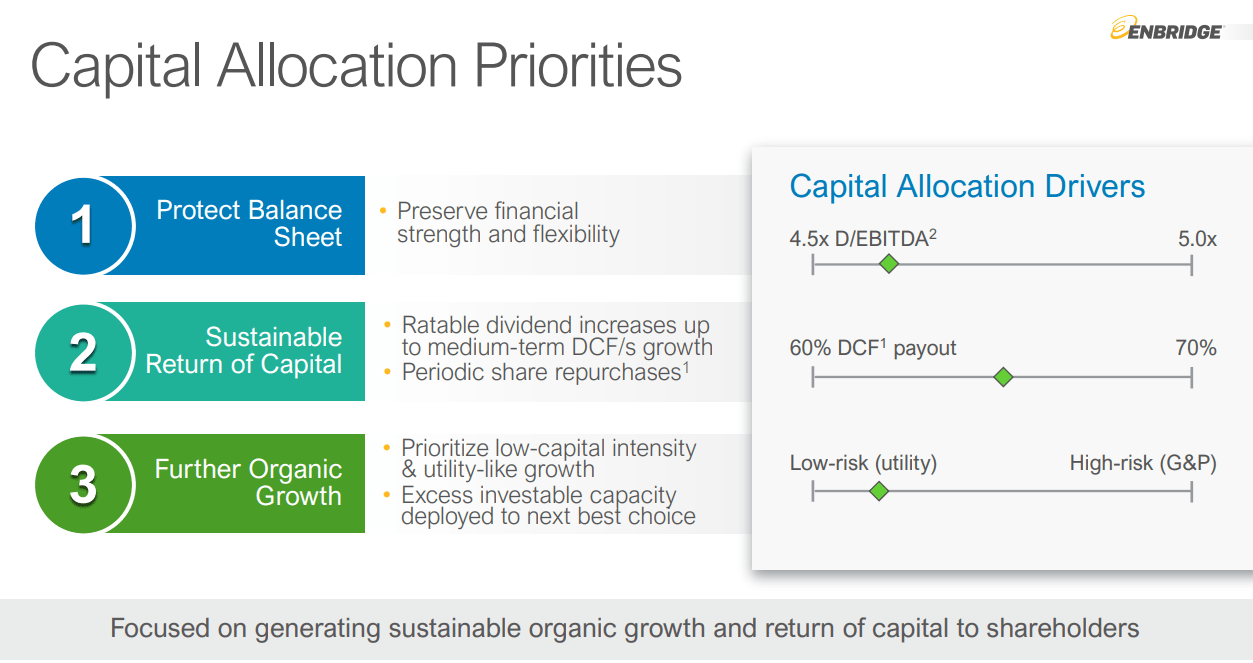
Management plans to keep leverage within a safe range of 4.5X to 5X and maintain a 65% payout ratio over time. It only invests in the most utility-like midstream projects.
Self-Funding Business Model: The Gold Standard Of Industry Dividend Safety
| Year | Distributable Cash Flow | Free Cash Flow | Dividends | DCF Payout Ratio | FCF Payout Ratio | Dividend/Share |
| 2022 | $7,895.0 | $6,358.50 | $5,062.50 | 64.1% | 79.6% | $2.50 |
| 2023 | $8,051.0 | $6,480.00 | $5,224.50 | 64.9% | 80.6% | $2.58 |
| 2024 | $8,277.0 | $6,642.00 | $5,386.50 | 65.1% | 81.1% | $2.66 |
| 2025 | $7,984.0 | $5,285.25 | $5,447.25 | 68.2% | 103.1% | $2.69 |
| 2026 | $8,166.0 | $5,589.00 | $5,589.00 | 68.4% | 100.0% | $2.76 |
| Annual Growth | 1.22% | -1.44% | 4.86% | 3.60% | 6.40% | 4.86% |
(Source: FactSet Research Terminal)
ENB has a self-funding business model, meaning zero reliance on equity issuances to fund growth plans.
Management has a policy of paying out 60% to 70% of distributable cash flow as dividends, and until growth spending accelerates in 2025, the company is even covering dividends with free cash flow.
- almost unheard of for utilities
- just a handful of midstreams have FCF self-funding business models
(Source: August investor presentation)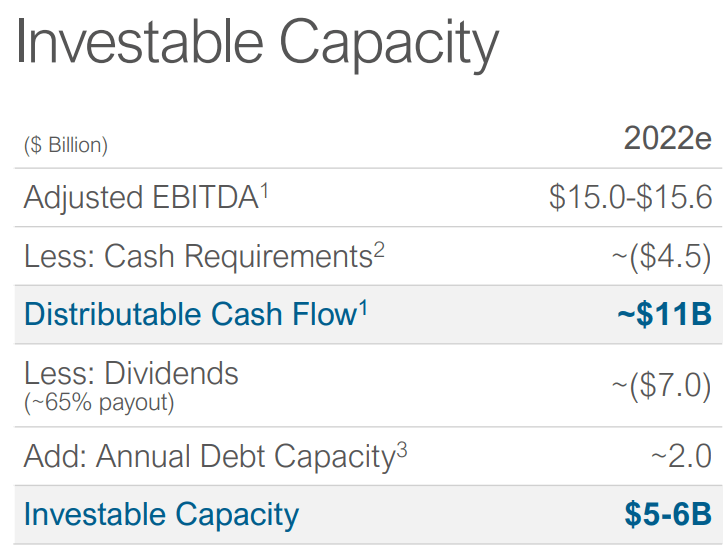
ENB has no plans ever to issue shares again to fund its growth projects (potentially it might make a big acquisition).
(Source: August investor presentation)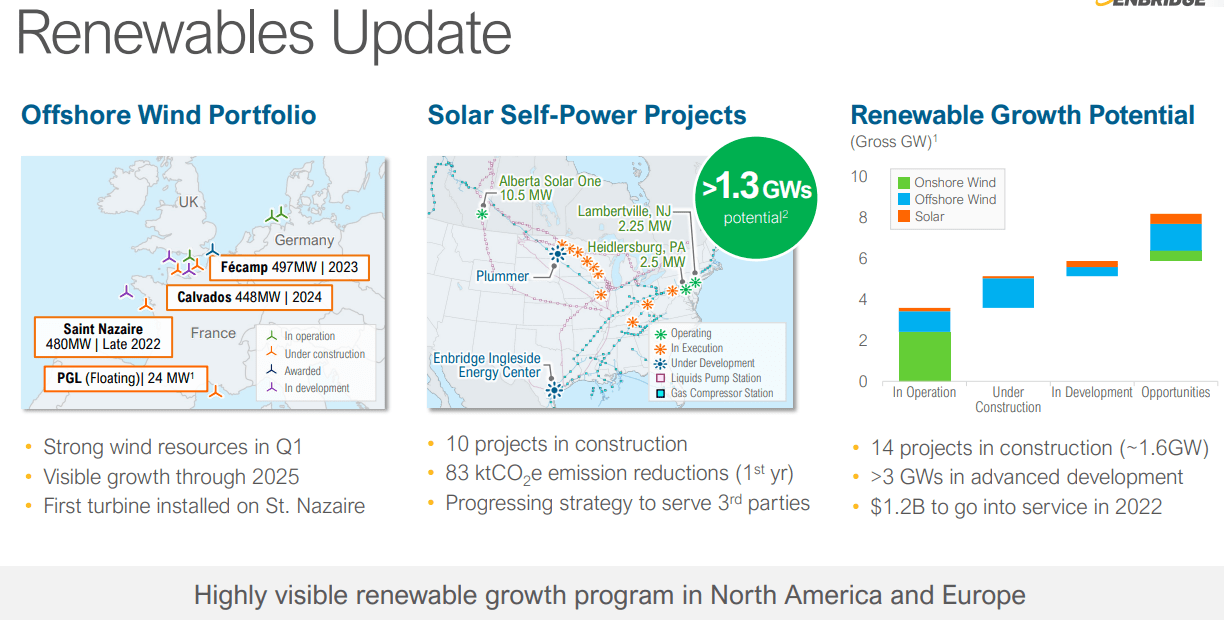
Its investments in renewables include the ability to double solar and wind capacity within a few years.
- ENB wind power already powers 900,000 homes in Europe
(Source: August investor presentation)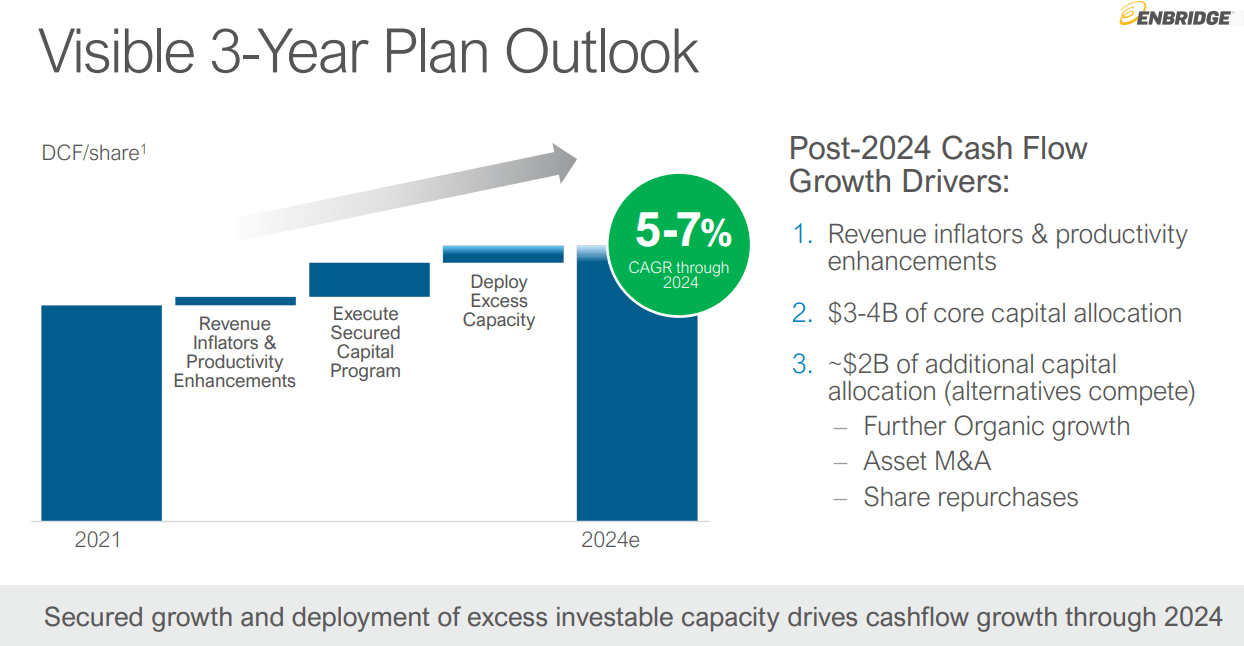
Management believes it can easily grow from 5% to 7% through 2024, and analysts think ENB can grow at this rate for decades.
Reasons To Potentially ENB Today
| Metric | Enbridge |
| Quality | 85% 13/13 Ultra SWAN (Sleep Well At Night) Quality Global Aristocrat |
| Risk Rating | Very Low Risk |
| DK Master List Quality Ranking (Out Of 500 Companies) | 164 |
| Quality Percentile | 68% |
| Dividend Growth Streak (Years) | 27 |
| Dividend Yield | 5.70% |
| Dividend Safety Score | 86% |
| Average Recession Dividend Cut Risk | 0.5% |
| Severe Recession Dividend Cut Risk | 1.70% |
| S&P Credit Rating | BBB+ Stable |
| 30-Year Bankruptcy Risk | 5.00% |
| Consensus LT Risk-Management Industry Percentile | 84% Very Good |
| Fair Value | $45.95 |
| Current Price | $36.41 |
| Discount To Fair Value | 21% |
| DK Rating |
Potentially Strong Buy |
| Price/Cash Flow | 8.2 (Anti-Bubble Blue-Chip) |
| Growth Priced In | -0.6% |
| Historical P/Cash Flow | 9 to 13 |
| LT Growth Consensus/Management Guidance | 6.7% |
| 5-year consensus total return potential |
10% to 22% CAGR |
| Base Case 5-year consensus return potential |
14% CAGR (2X the S&P 500) |
| Consensus 12-month total return forecast | 26% |
| Fundamentally Justified 12-Month Return Potential | 33% |
| LT Consensus Total Return Potential | 13.5% |
| Inflation-Adjusted Consensus LT Return Potential | 11.2% |
| Consensus 10-Year Inflation-Adjusted Total Return Potential (Ignoring Valuation) | 2.89 |
| LT Risk-Adjusted Expected Return | 8.98% |
| LT Risk-And Inflation-Adjusted Return Potential | 6.69% |
| Conservative Years To Double | 10.77 Vs. 15.4 S&P 500 |
(Source: Dividend Kings Zen Research Terminal)
Enbridge 2024 Consensus Total Return Potential
(Source: FAST Graphs, FactSet)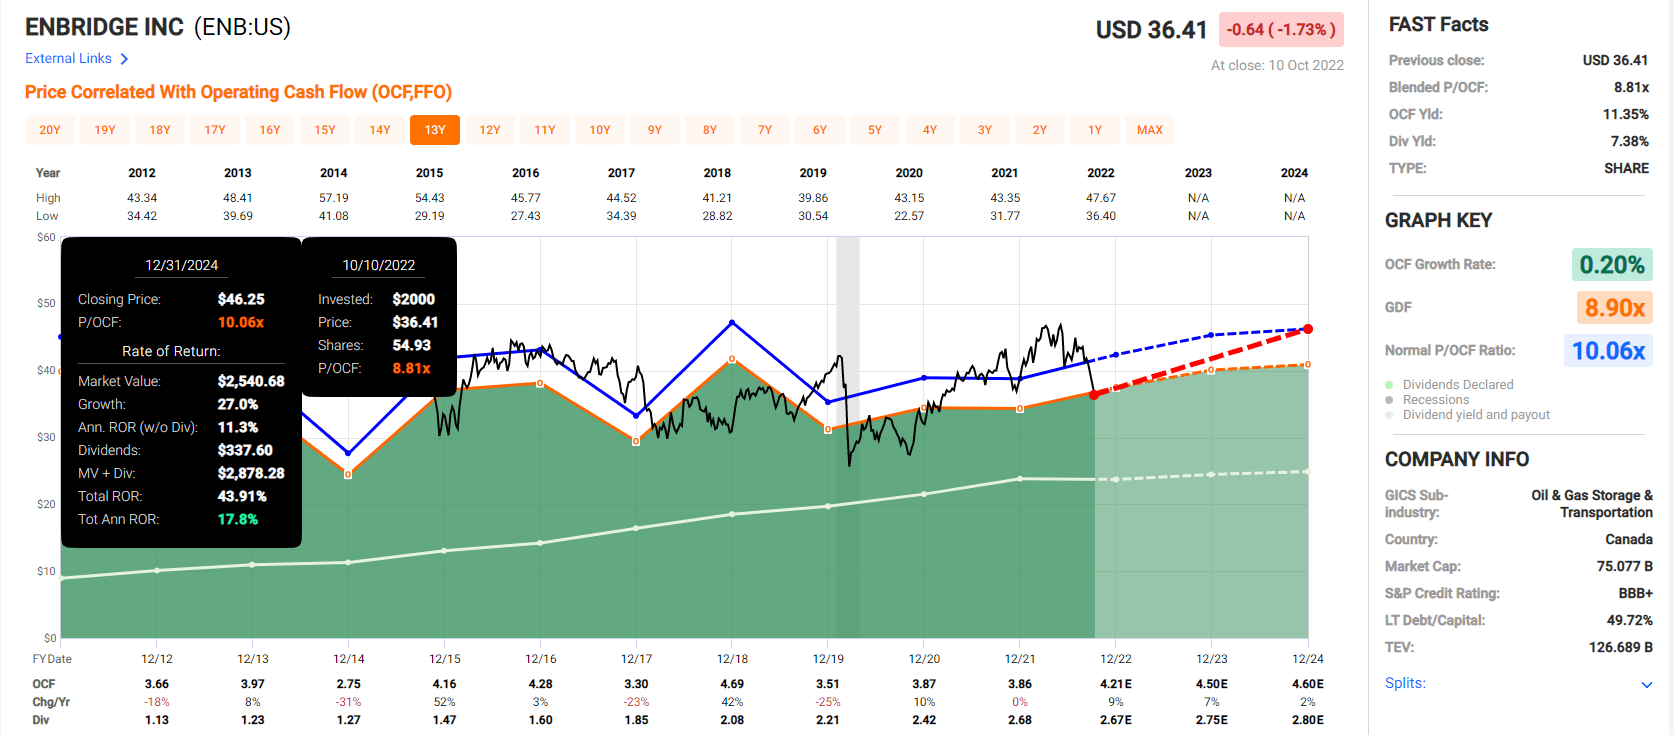
ENB is offering the potential for 18% annual returns through 2024 if it grows as expected and returns to historical fair value.
Enbridge 2027 Consensus Total Return Potential
(Source: FAST Graphs, FactSet)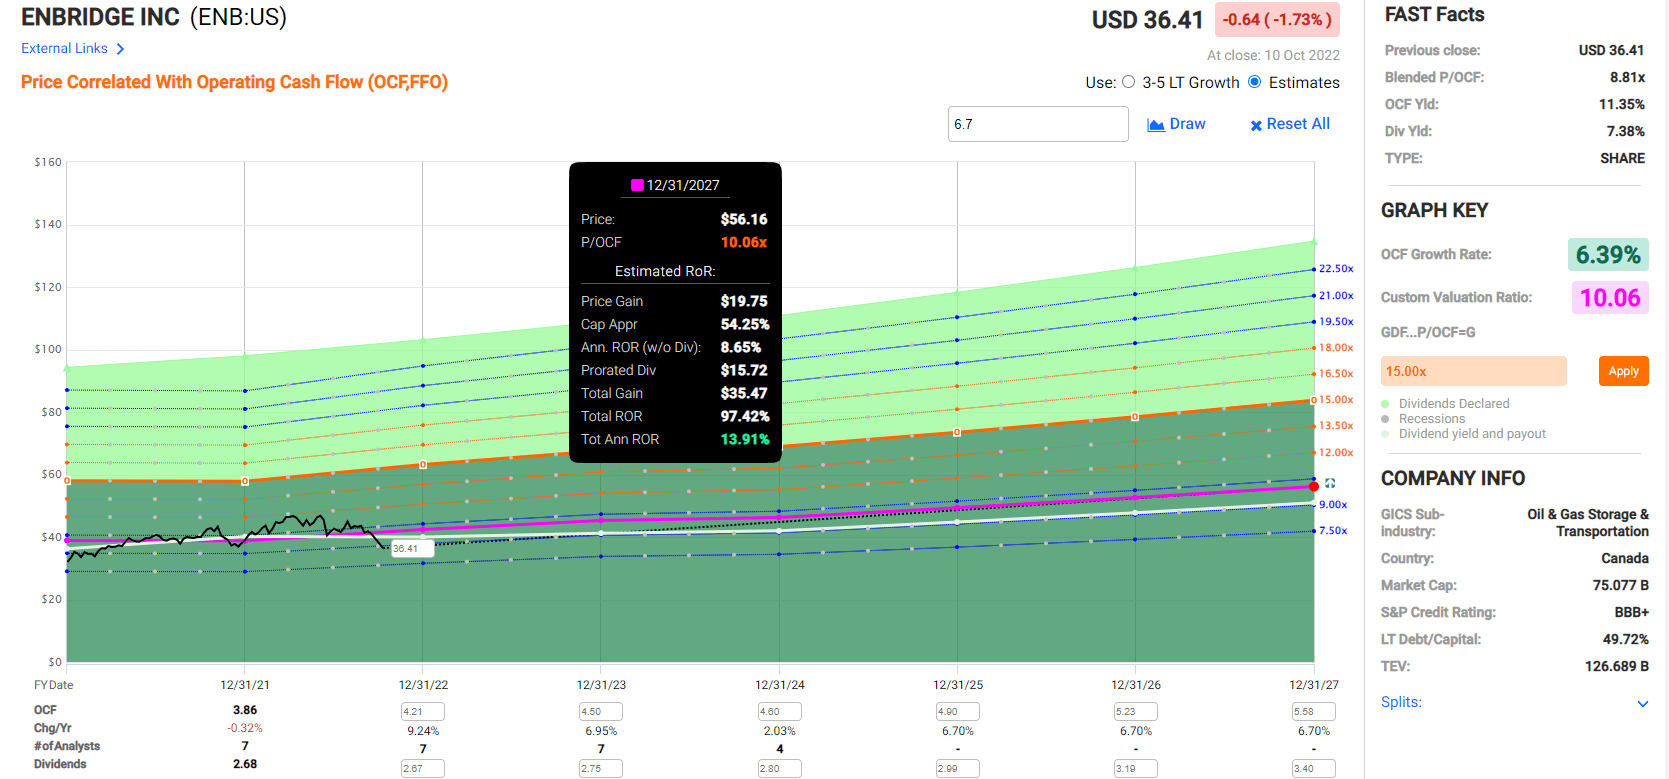
If ENB grows as expected and returns to fair value by 2025, it could double and deliver 14% annual returns.
- about 2X the total return potential of the S&P 500
ENB Corp Investment Decision Tool
DK (Source: Dividend Kings Automated Investment Decision Tool)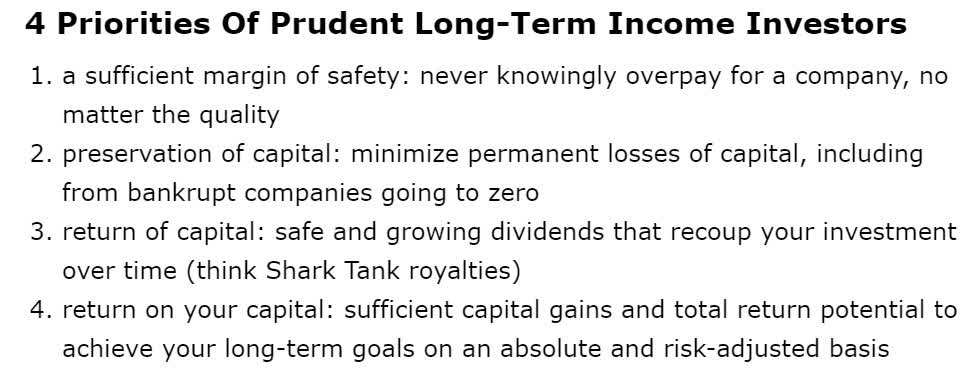
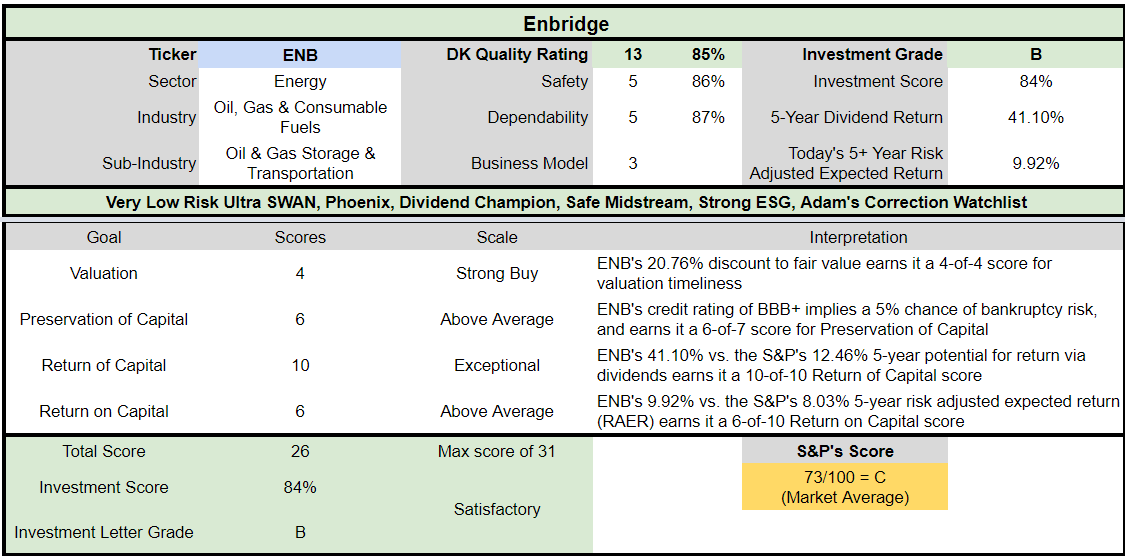
ENB is a potentially good ultra-yield aristocrat opportunity for anyone comfortable with its risk profile. Look at how it compares to the S&P 500.
- 21% discount to fair value vs. 10% S&P = 11% better valuation
- 6.8% very safe yield vs. 1.9% S&P (3X higher and much safer yield)
- 25% higher annual long-term return potential
- slightly higher risk-adjusted expected returns
- over 3X the consensus 5-year income
Reason Two: Decades Of Steady Growth Ahead
ENB is trading at 8.2X cash flow, pricing in -0.6% long-term growth. Management says it has a clear path to 5% to 7% growth in the medium-term, and here’s what analysts expect, even with currency effects.
| Metric | 2021 Growth | 2022 Growth Consensus | 2023 Growth Consensus | 2024 Growth Consensus | 2025 Growth Consensus | 2026 Growth Consensus |
2027 Growth Consensus |
| Sales | 29% | 14% | 2% | 1% | NA | NA | NA |
| Dividend | 3% | 3% (Official) | 3% | 3% | 1% | 3% |
15% (32-Year Dividend Growth Streak) |
| Operating Cash Flow | 0% | 9% | 7% | 2% | NA | NA | NA |
| Distributable Cash Flow | 6% | -1% | 3% | 3% | 1% | 2% | 7% |
| EBITDA | 7% | 33% | 2% | 1% | NA | NA | NA |
| EBIT (operating income) | 5% | 41% | 4% | 3% | NA | NA | NA |
(Source: FAST Graphs, FactSet)
Boring but beautiful, steady growth, even with a mild recession looming.
ENB Long-Term Growth Outlook
(Source: FactSet Research Terminal)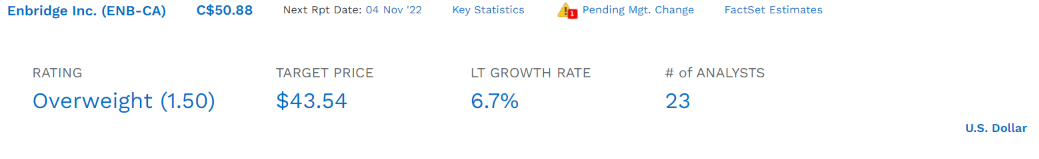
- 6.1% to 8.1% CAGR growth consensus range (from four sources)
- 6.7% CAGR median growth consensus from all 23 analysts
(Source: FAST Graphs, FactSet)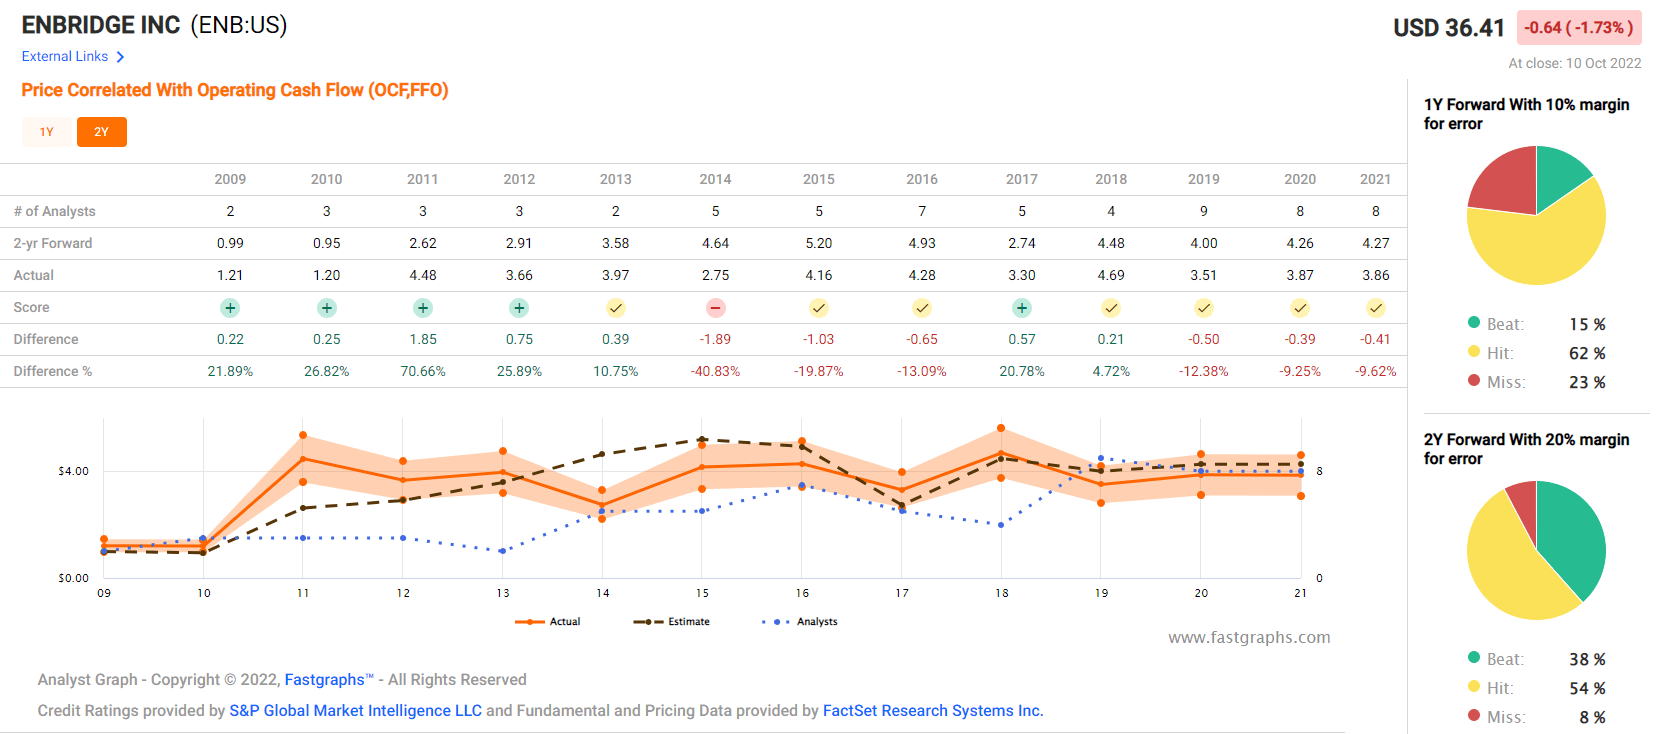
Smoothing for outliers analyst historical margins of error are 20% to the downside and 25% to the upside.
- 4% to 10% CAGR margin-of-error growth adjusted range
- vs. -0.6% growth priced in
(Source: FAST Graphs, FactSet) (Source: FAST Graphs, FactSet) (Source: FAST Graphs, FactSet) (Source: FAST Graphs, FactSet)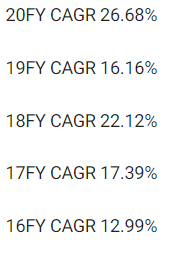
Early on, hyper-growth resulted from ENB utilizing its MLPs to grow at a breakneck pace. Management and analysts think that steady growing spending of $4 billion per year should drive around 6% growth in the future, potentially for 50 to 100 years.
- backed up by the incredible investment opportunities represented by the green energy transition
| Investment Strategy | Yield | LT Consensus Growth | LT Consensus Total Return Potential | Long-Term Risk-Adjusted Expected Return | Long-Term Inflation And Risk-Adjusted Expected Returns | Years To Double Your Inflation & Risk-Adjusted Wealth |
10-Year Inflation And Risk-Adjusted Expected Return |
| Enbridge | 6.8% | 6.7% | 13.5% | 9.5% | 7.2% | 10.0 | 2.01 |
| Safe Midstream | 6.3% | 6.4% | 12.7% | 8.9% | 6.7% | 10.8 | 1.91 |
| REITs | 3.9% | 6.1% | 10.0% | 7.0% | 4.8% | 15.1 | 1.60 |
| Schwab US Dividend Equity ETF | 3.6% | 8.80% | 12.4% | 8.7% | 6.5% | 11.1 | 1.87 |
| Dividend Aristocrats | 2.8% | 8.7% | 11.5% | 8.1% | 5.8% | 12.3 | 1.76 |
| S&P 500 | 1.8% | 8.5% | 10.3% | 7.2% | 5.0% | 14.4 | 1.63 |
| Nasdaq | 0.9% | 11.8% | 12.7% | 8.9% | 6.7% | 10.8 | 1.91 |
(Source: DK Research Terminal, FactSet, Morningstar, YCharts)
ENB has the potential to outperform most popular investing strategies. Not just the high-yield ones but also the S&P, aristocrats, and even the Nasdaq.
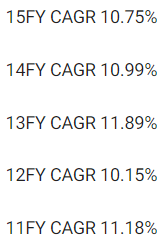
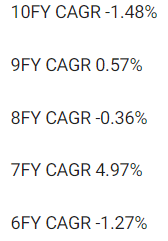
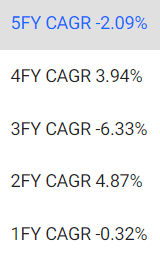
ENB Historical Returns Since 1990
(Source: Portfolio Visualizer Premium) (Source: Portfolio Visualizer Premium) (Source: Portfolio Visualizer Premium)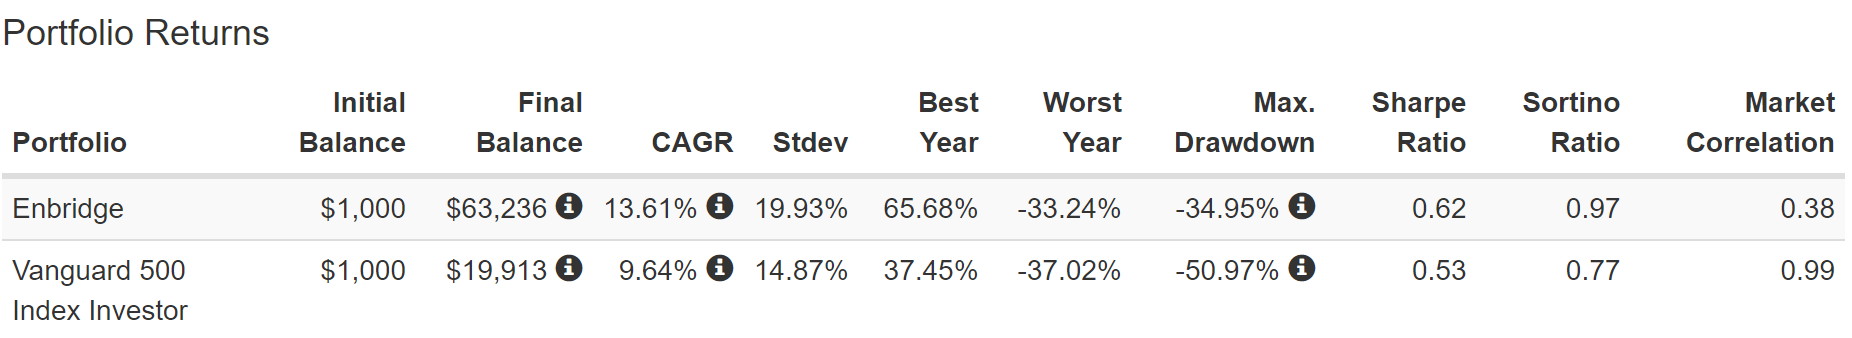
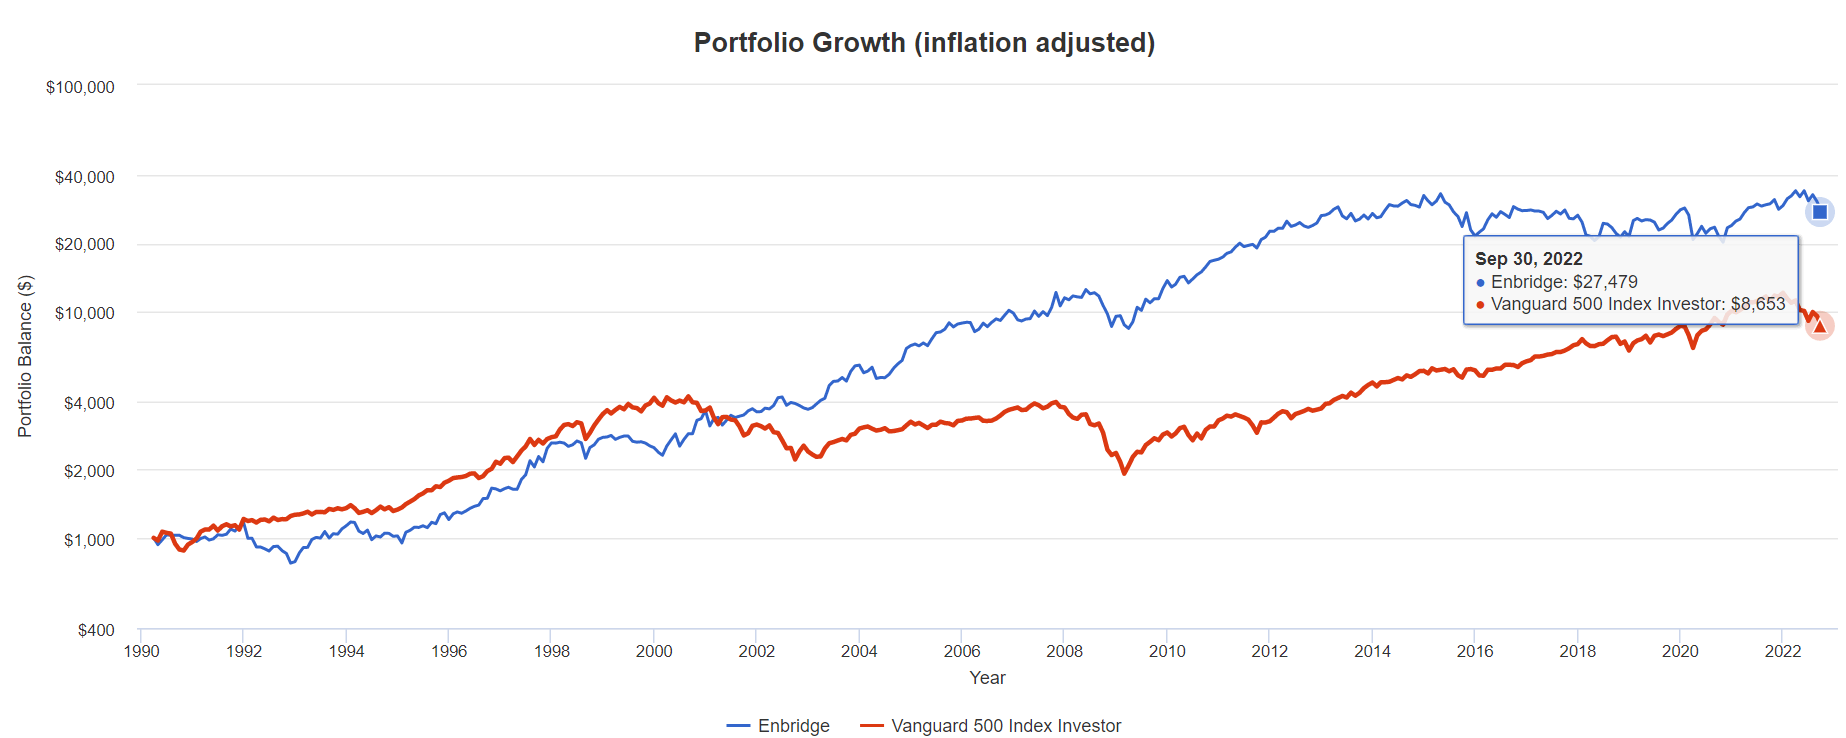
Thanks to its much higher starting yield, analysts think ENB growing at a slower rate, can still deliver the same 13.6% annual returns it delivered over the last 32 years.
- 27.5X inflation-adjusted returns
- more than 3X more than the S&P 500
Inflation-Adjusted Consensus Total Return Potential: $1,000 Initial Investment
| Time Frame (Years) | 8.1% CAGR Inflation-Adjusted S&P 500 Consensus | 9.3% Inflation-Adjusted Dividend Aristocrats Consensus | 11.3% CAGR Inflation-Adjusted ENB Consensus | Difference Between Inflation-Adjusted ENB Consensus And S&P Consensus |
| 5 | $1,474.78 | $1,558.49 | $1,706.42 | $231.64 |
| 10 | $2,174.97 | $2,428.88 | $2,911.86 | $736.89 |
| 15 | $3,207.60 | $3,785.39 | $4,968.86 | $1,761.26 |
| 20 | $4,730.50 | $5,899.48 | $8,478.96 | $3,748.46 |
| 25 | $6,976.43 | $9,194.27 | $14,468.65 | $7,492.21 |
| 30 (retirement time frame) | $10,288.69 | $14,329.16 | $24,689.57 | $14,400.88 |
| 35 | $15,173.53 | $22,331.82 | $42,130.74 | $26,957.21 |
| 40 | $22,377.60 | $34,803.86 | $71,892.68 | $49,515.08 |
| 45 | $33,001.99 | $54,241.40 | $122,679.01 | $89,677.02 |
| 50 | $48,670.61 | $84,534.56 | $209,341.75 | $160,671.14 |
| 55 | $71,778.35 | $131,746.09 | $357,224.66 | $285,446.31 |
| 60 (investing lifetime) | $105,857.14 | $205,324.69 | $609,574.82 | $503,717.68 |
| 100 (institutional time frame, multi-generational wealth) | $2,368,828.40 | $7,146,092.50 | $43,823,968.06 | $41,455,139.66 |
(Source: DK Research Terminal, FactSet)
Over the next 30 years, analysts think ENB could potentially deliver 25X inflation-adjusted returns, similar to what it’s done since 1990.
Over an investing lifetime, ENB could deliver life-changing income and wealth.
| Time Frame (Years) | Ratio Inflation-Adjusted ENB Consensus/Aristocrat Consensus | Ratio Inflation-Adjusted ENB Consensus vs. S&P consensus |
| 5 | 1.09 | 1.16 |
| 10 | 1.20 | 1.34 |
| 15 | 1.31 | 1.55 |
| 20 | 1.44 | 1.79 |
| 25 | 1.57 | 2.07 |
| 30 | 1.72 | 2.40 |
| 35 | 1.89 | 2.78 |
| 40 | 2.07 | 3.21 |
| 45 | 2.26 | 3.72 |
| 50 | 2.48 | 4.30 |
| 55 | 2.71 | 4.98 |
| 60 | 2.97 | 5.76 |
| 100 | 6.13 | 18.50 |
(Source: DK Research Terminal, FactSet)
Even a bit better returns add up over time, and ENB could almost double the aristocrats over the next 30 years and potentially deliver 2.4X more than the S&P 500.
Reason Three: A Wonderful Company At A Wonderful Price
(Source: FAST Graphs, FactSet) (Source: FAST Graphs, FactSet) (Source: FAST Graphs, FactSet)
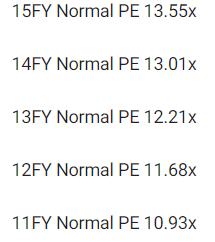
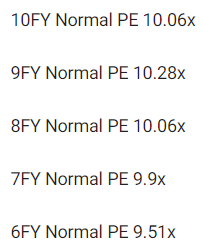
During periods of slower growth, tens of millions of investors have consistently paid between 9X and 13X cash flow for ENB.
- 90% statistical probability ENB is worth around 11X cash flow even if it fails to grow at management’s growth guidance levels
| Metric | Historical Fair Value Multiples (13-Years) | 2021 | 2022 | 2023 | 2024 |
12-Month Forward Fair Value |
| 5-Year Average Yield (Pure Industry Bear Market) | 6.44% | $40.84 | $38.57 | $38.57 | $41.30 | |
| 13-Year Median Yield | 4.22% | $62.32 | $58.86 | $58.86 | $63.03 | |
| Operating Cash Flow | 10.06 | $38.83 | $42.35 | $45.27 | $50.80 | |
| Average | $45.26 | $45.10 | $46.15 | $50.20 | $45.95 | |
| Current Price | $36.41 | |||||
|
Discount To Fair Value |
19.55% | 19.26% | 21.11% | 27.47% | 20.76% | |
|
Upside To Fair Value ( Including Dividends) |
24.30% | 23.85% | 26.75% | 37.88% | 33.02% | |
| 2022 OCF | 2023 OCF | 2022 Weighted OCF | 2023 Weighted OCF | 12-Month Forward OCF | 12-Month Average Fair Value Forward P/OCF |
Current Forward P/OCF |
| $4.21 | $4.50 | $0.81 | $3.63 | $4.44 | 10.34 | 8.19 |
I estimate ENB is historically worth 10.3X cash flow and today trades at an anti-bubble 8.2X.
| Rating | Margin Of Safety For Very Low Risk 13/13 UltraSWAN Quality Companies | 2022 Fair Value Price | 2023 Fair Value Price |
12-Month Forward Fair Value |
| Potentially Reasonable Buy | 0% | $45.10 | $46.15 | $45.95 |
| Potentially Good Buy | 5% | $42.84 | $43.84 | $43.65 |
| Potentially Strong Buy | 15% | $38.33 | $39.23 | $39.06 |
| Potentially Very Strong Buy | 25% | $32.13 | $34.61 | $34.46 |
| Potentially Ultra-Value Buy | 35% | $29.31 | $30.00 | $29.87 |
| Currently | $36.41 | 19.26% | 21.11% | 20.76% |
| Upside To Fair Value (Including Dividends) | 30.68% | 33.58% | 33.02% |
ENB is a potentially strong buy for anyone comfortable with its risk profile.
Risk Profile: Why Enbridge Isn’t Right For Everyone
There are no risk-free companies, and no company is right for everyone. You have to be comfortable with the fundamental risk profile.
Risk Profile Summary
- economic cyclicality risk: modest cash flow variability in recessions (up to 19% but larger in oil crashes)
- M&A execution risk: from future industry consolidation
- regulatory risk: specifically for new project approvals (Keystone XL is a good example of what can go wrong)
- failure of the green energy transition plan
- talent retention risk in the tightest job market in 50 years
- cyber-security risk: hackers and ransomware (Colonial pipeline hack is an example of what can happen)
- currency risk: including the dividend
How do we quantify, monitor, and track such a complex risk profile? By doing what big institutions do.
Long-Term Risk Management Analysis: How Large Institutions Measure Total Risk Management
See the risk section of this video to get an in-depth view (and link to two reports) of how DK and big institutions measure long-term risk management by companies
ENB Corp Long-Term Risk-Management Consensus
| Rating Agency | Industry Percentile |
Rating Agency Classification |
| MSCI 37 Metric Model | 96.0% |
AA, Industry Leader |
| Morningstar/Sustainalytics 20 Metric Model | 92.8% |
22.5/100 Medium Risk |
| Reuters’/Refinitiv 500+ Metric Model | 94.0% | Excellent |
| S&P 1,000+ Metric Model | 69.0% |
Above-Average, Stable Trend |
| Morningstar Global Percentile (All 15,000 Rated Companies) | 66.6% | Above-Average |
| Consensus | 84% |
Very Low Risk, Very Good Risk Management, Stable Trend |
(Sources: Morningstar, MSCI, S&P, Reuters)
ENB’s Long-Term Risk Management Is The 37th Best In The Master List (93rd Percentile)
| Classification | Average Consensus LT Risk-Management Industry Percentile |
Risk-Management Rating |
| S&P Global (SPGI) #1 Risk Management In The Master List | 94 | Exceptional |
| Enbridge | 84 |
Very Good |
| Foreign Dividend Stocks | 76 |
Good |
| Strong ESG Stocks | 73 |
Good |
| Ultra SWANs | 70 | Good |
| Low Volatility Stocks | 68 | Above-Average |
| Dividend Aristocrats | 67 | Above-Average |
| Dividend Kings | 63 | Above-Average |
| Master List average | 62 | Above-Average |
| Hyper-Growth stocks | 61 | Above-Average |
| Monthly Dividend Stocks | 60 | Above-Average |
| Dividend Champions | 57 | Average bordering on above-average |
(Source: DK Research Terminal)
ENB’s risk-management consensus is in the top 7% of the world’s highest quality companies and similar to that of such other blue-chips as
- Colgate-Palmolive (CL): Ultra SWAN dividend king
- Ecolab (ECL): Super SWAN dividend aristocrat
- BlackRock (BLK): Ultra SWAN
- Allianz SE (OTCPK:ALIZY): Super SWAN (best insurance company in the world according to rating agencies)
- Lockheed Martin (LMT): Ultra SWAN
The bottom line is that all companies have risks, and ENB is very good, at managing theirs.
How We Monitor ENB’s Risk Profile
- 23 analysts
- 4 credit rating agencies
- 8 total risk rating agencies
- 31 experts who collectively know this business better than anyone other than management
- and the bond market for real-time fundamental risk assessment
When the facts change, I change my mind. What do you do, sir?” – John Maynard Keynes
There are no sacred cows at iREIT or Dividend Kings. Wherever the fundamentals lead, we always follow. That’s the essence of disciplined financial science, the math behind retiring rich and staying rich in retirement.
Bottom Line: Enbridge Is A 7% Yielding Dividend Aristocrat Retirement Dream Stock
Let me be clear: I’m NOT calling the bottom in ENB (I’m not a market-timer).
Sleep Well At Night doesn’t mean “can’t fall hard in a bear market.”
Fundamentals are all that determine safety and quality, and my recommendations.
- over 30+ years, 97% of stock returns are a function of pure fundamentals, not luck
- in the short term; luck is 25X as powerful as fundamentals
- in the long term, fundamentals are 33X as powerful as luck
While I can’t predict the market in the short term, here’s what I can tell you about ENB.
- One of the highest quality, safest, and most dependable ultra-yield aristocrats on earth.
- 6.8% very safe yield, growing at 3% to 5% CAGR over time
- 13.5% CAGR long-term total return consensus, better than the Nasdaq, aristocrats, S&P 500, and SCHD.
- 21% historically undervalued, a potentially strong buy
- 8.2X cash flow (anti-bubble blue-chip)
- 100% consensus return potential over the next five years, 14% CAGR, about 2X more than the S&P 500
- over 3X better income potential over the next five years
If you want to stop paying for luck on Wall Street, it’s time to start making your own with the world’s best dividend blue-chips.
If you are sick of losing sleep during market crashes, then it’s time to embrace Ultra SWAN investing.
If you want true financial freedom in retirement, then it’s hard to beat ultra-yield aristocrats like Enbridge.
I can’t tell you when the bear market will end (I can only give the probabilities and historical context). But what I can tell you is that Enbridge has been enriching income investors for the last 73 years and is built to last.
In fact, the bond market is confident that it will outlive us all and still be around in the next century. That’s thanks to a utility-like business model, 84th percentile risk management, and a fortress balance sheet tied for the best in the industry.
I’m highly confident that ENB is one of the safest ultra-yielding blue-chips on earth, which is why I’ve personally invested a small fortune into it, and it remains one of my favorite high-yield aristocrat picks for new money today.
Be the first to comment