

Oat_Phawat
Part I – Introduction
The Vancouver-based Eldorado Gold (NYSE:EGO) released its preliminary production results for the second quarter of 2022 on July 13, 2021.
Note: This article is an update of my article published on May 18, 2022. I have followed EGO on Seeking Alpha since January 2015.
1 – Production Snapshot and 2022 guidance
1.1 – 2Q22 decent production
EGO delivered decent gold production this quarter, following a very weak output in 1Q22. Gold production came in at 113,462 Oz, down slightly from 116,066 ounces produced in 2Q21 and 93,209 Oz delivered the preceding quarter due to a weak production at the Lamaque mine and Olympias, which has been fixed this quarter.
However, Kisladag is still struggling with lower production but should get back on track in 3Q22.
EGO Quarterly production 1Q22 versus 2Q22 (Fun Trading)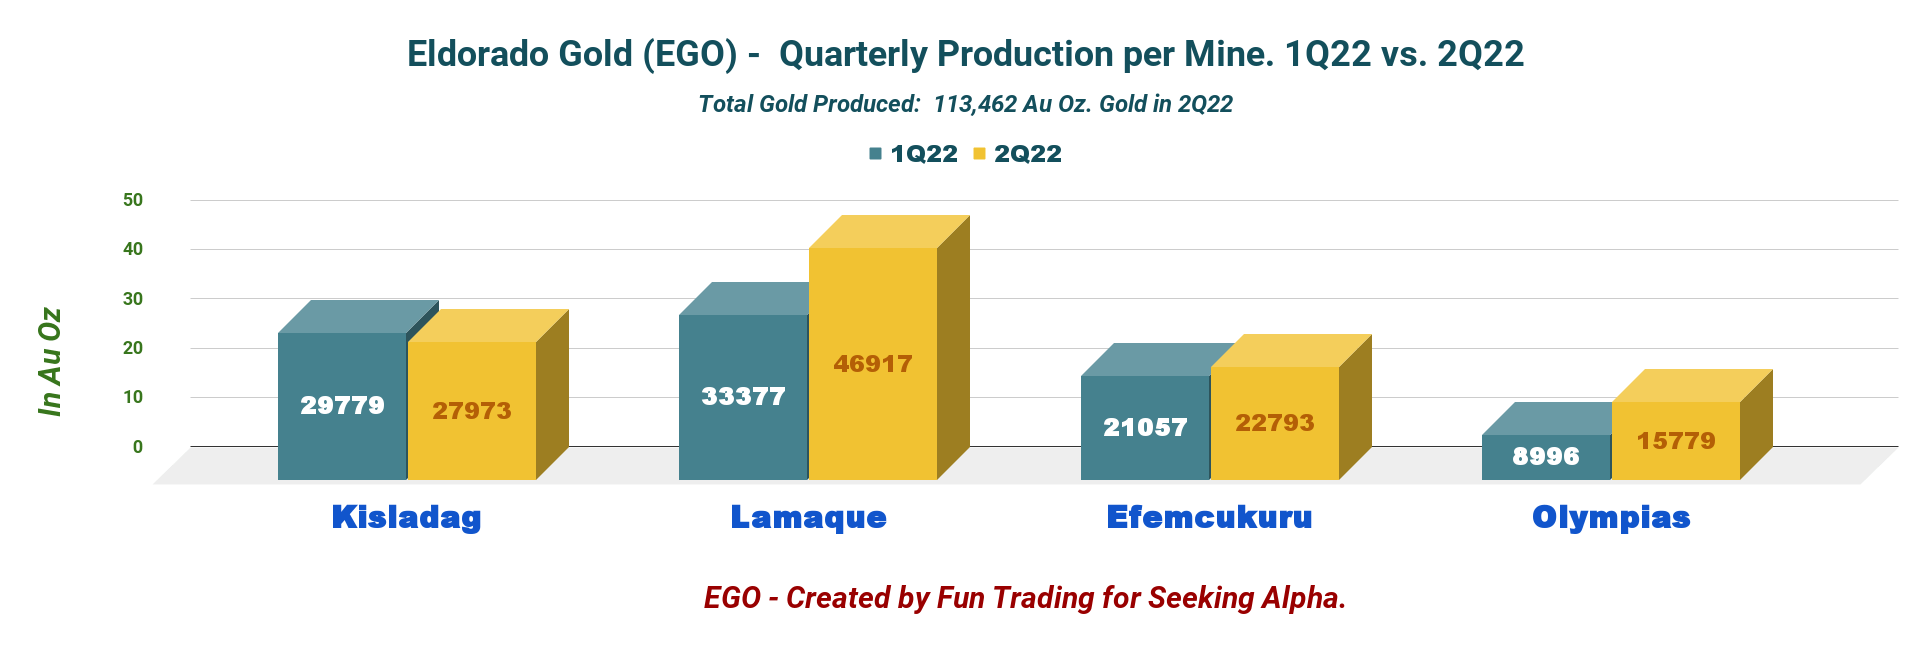
EGO Production per mine Press release (Eldorado Gold)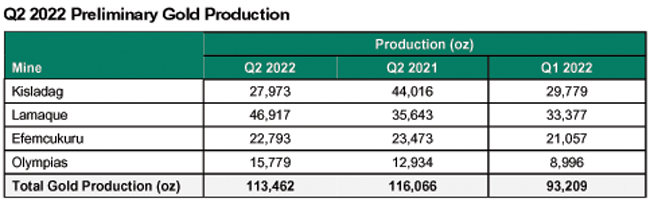
2.2 – Eldorado Gold maintains full-year consolidated production guidance of 460K to 490K ounces.
Cash operating cost is expected to be $640 to $690 per ounce, and the average all-in sustaining costs (“AISC”) will be $1,075 to $1,175 per ounce.
EGO Guidance previous presentation (Eldorado Gold)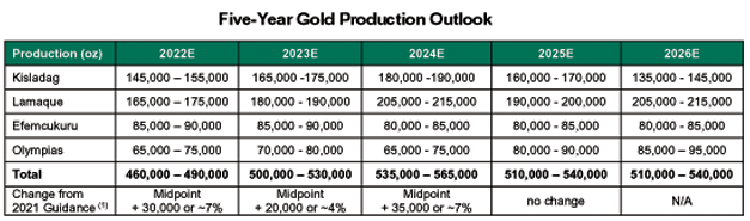
2 – Investment Thesis
The investment thesis has been a challenge for EGO for many years. EGO experienced an unprecedented selloff starting in early May.
The stock dropped even more than its peers, probably due to management that I would qualify as slow. The issue with Greece is a stark example.
Eldorado Gold completed the Feasibility Study on the wholly-owned Skouries project with an initial CapEx of approximately $845 million on December 15, 2021. Seven months have passed… CEO George Burns said:
Financing discussions continue to advance, and we are evaluating all available options,
These options include a joint venture with equity partners, project and debt financing through European and Greek lenders, the European Union’s Recovery and Resilience Fund, and metal streams.
However, CEO Burns expects financial backing and board approval in the coming weeks, with construction restarting at Skouries in the year’s second half, subject to financing and board approval.
The entire gold industry fell off the cliff when the Fed decided to hike interest by 75 bps, and rampant inflation started to be out of control. Furthermore, despite a hawkish action by the Fed in June, the recent CPI number came in at 9.1%, which spooked the market even more.
In general, gold should be flying with such elevated inflation, but it has not been the case this time. Instead, the gold price is breaking down as I speak, which is not what it should do if we look at history. A few consider this situation a temporary anomaly exacerbated by a bullish US dollar. I tend to agree.
Thus, I believe it is an excellent time to take advantage of the low stock price and start a gradually long-term accumulation. It must be incremented by short-term trading using the LIFO method to turn this process worthwhile. The solution is to trade EGO short-term LIFO using at least 40% of your entire position while keeping a core long term.
This two-level strategy has succeeded in my marketplace, “The Gold And Oil Corner,” and I believe it is the safer way to play EGO. However, only US investors can use LIFO. Please read my note at the end of this article.
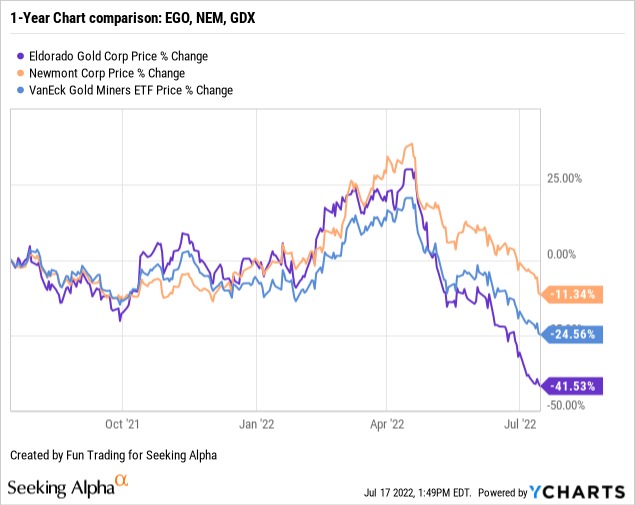
3 – Stock Performance
The stock has underperformed the VanEck Vectors Gold Miners ETF (GDX) and Newmont Corp. (NEM) and is now down a whopping 42% on a one-year basis.
Part II – Gold Production Details For 2Q22
On July 13, 2022, the company announced the preliminary gold production for the second quarter of 2022.
EGO Quarterly Gold production history (Fun Trading)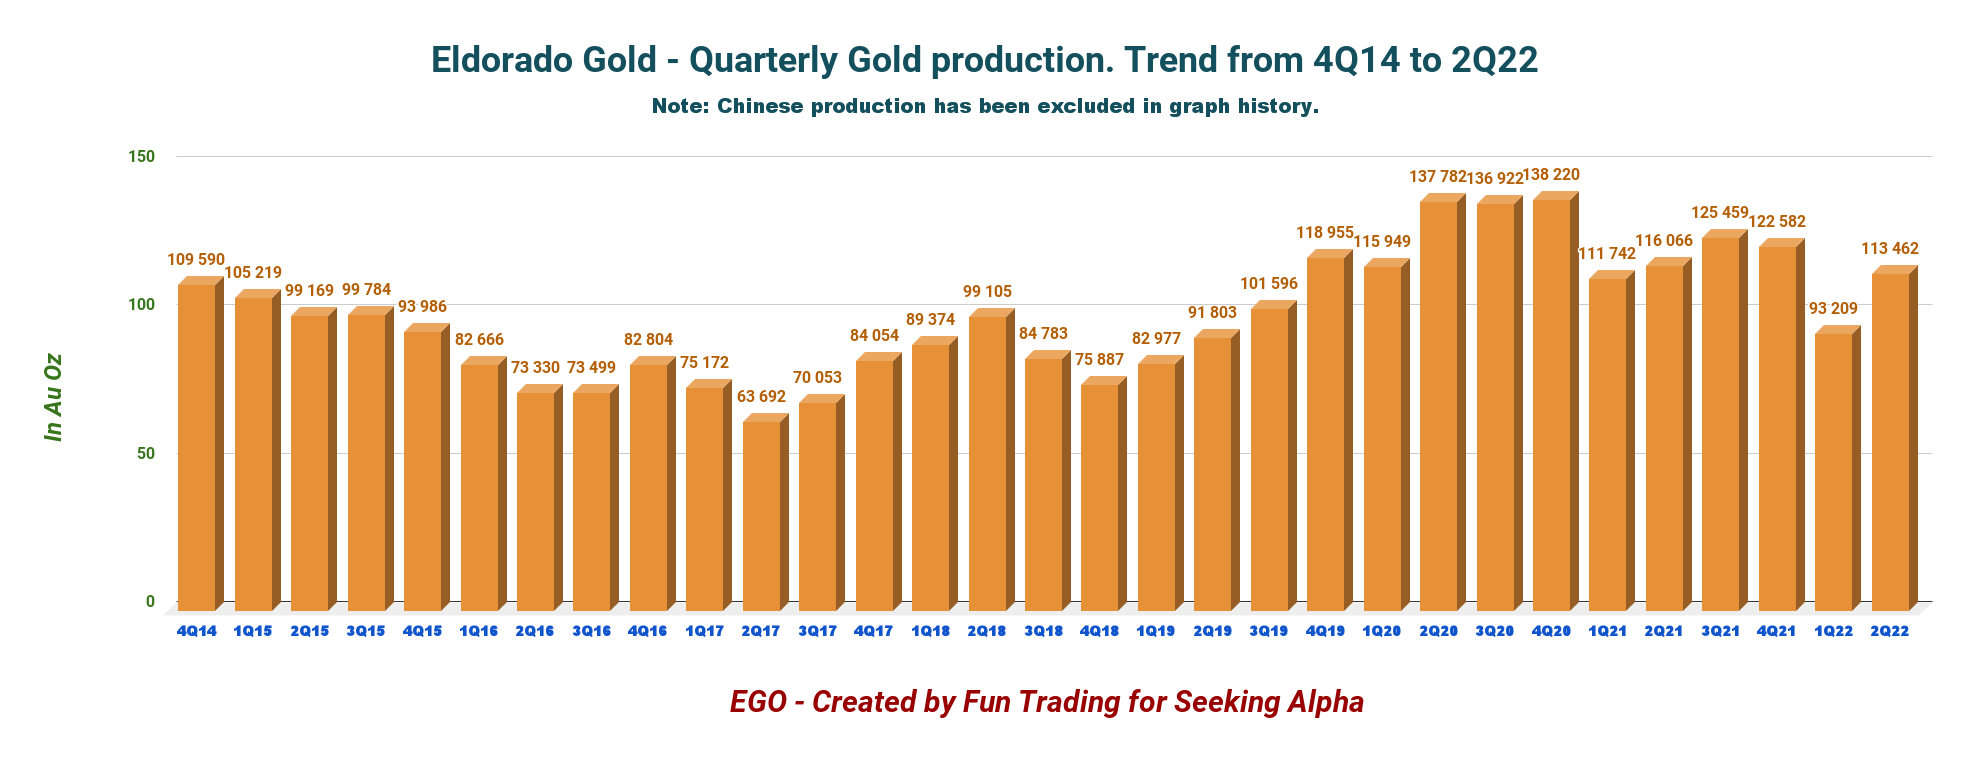
The second quarter of 2021 production came in at 113,462 Au Oz, down slightly year-over-year and up 21.7% sequentially. Production was expected to recover significantly from the preceding quarter. Production during January and February was impacted considerably by higher-than-anticipated absenteeism related to the surge of the COVID-19 Omicron variant. The company said it maintains its full-year 2022 consolidated production guidance of 460K to 490K ounces.
1 – Olympias Mine
Olympias mine experienced impressive productivity improvements and enhanced control of gold grades in the second quarter. Gold output jumped from 12,934 ounces in 2Q21 to 15,779 ounces in 2Q22. The production increased as a result of processing ore stockpiles.
Production came at 15,779 ounces compared to 8,996 ounces produced in 1Q22 and 12,934 ounces in 2Q21.
EGO Olympias quarterly gold production history (Fun Trading)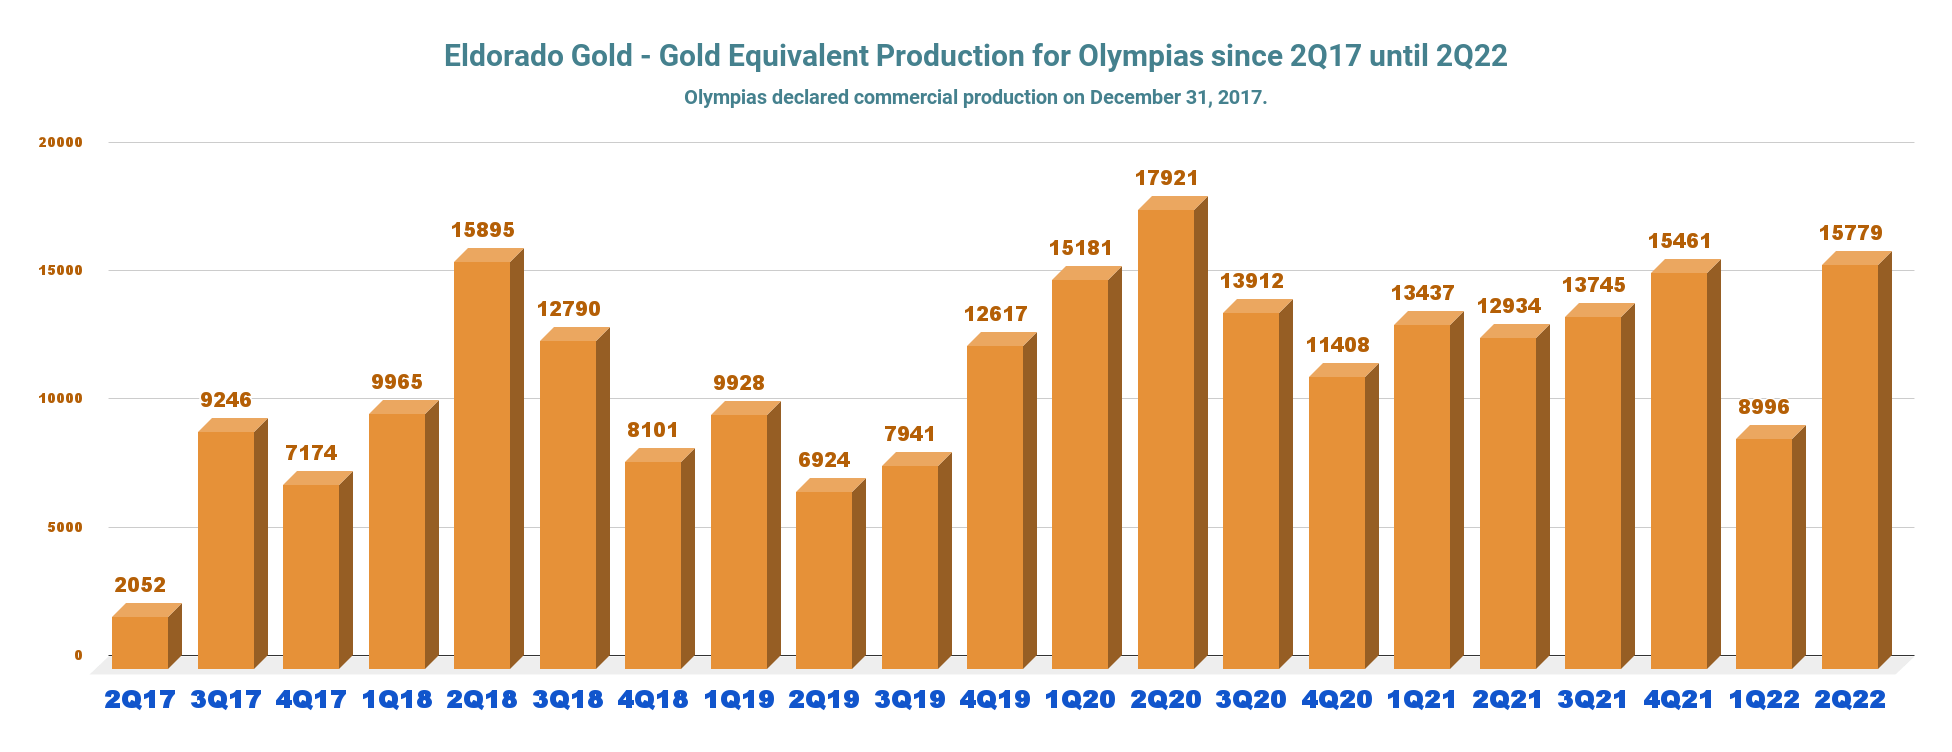
2 – Lamaque Mine
Mine and mill optimization efforts helped the company to achieve positive results this quarter after a very weak production in 1Q22. Underground development of high-grade stopes progressed well, and gold production was higher than planned due to higher throughput and grades.
Additionally, resource conversion drilling commenced on the Lamaque deposit during the quarter.
Production came in at 46,917 ounces, up from 35,643 ounces in 2Q21 and up 39.7% sequentially.
EGO Lamaque Quarterly Production history (Fun Trading)
3 – Kisladag Mine
Gold production in 2Q22 was below plan due to the effects of lower tonnes placed on the leach pad in 1Q22. Optimization of the high-pressure grinding roll (“HPGR”) and debottlenecking of the belt agglomeration circuit continued in the second quarter. The HPGR is performing according to plan.
The company said a notable increase in tonnes was placed on the leach pad with a higher average grade. Thus, the company expects higher gold production in 3Q22, with production weighted to H2 2022.
Production came in at 27,973 ounces, down from 44,016 ounces in 2Q21 and 29,779 ounces produced in 1Q22.
EGO Kisladag quarterly production history (Fun Trading)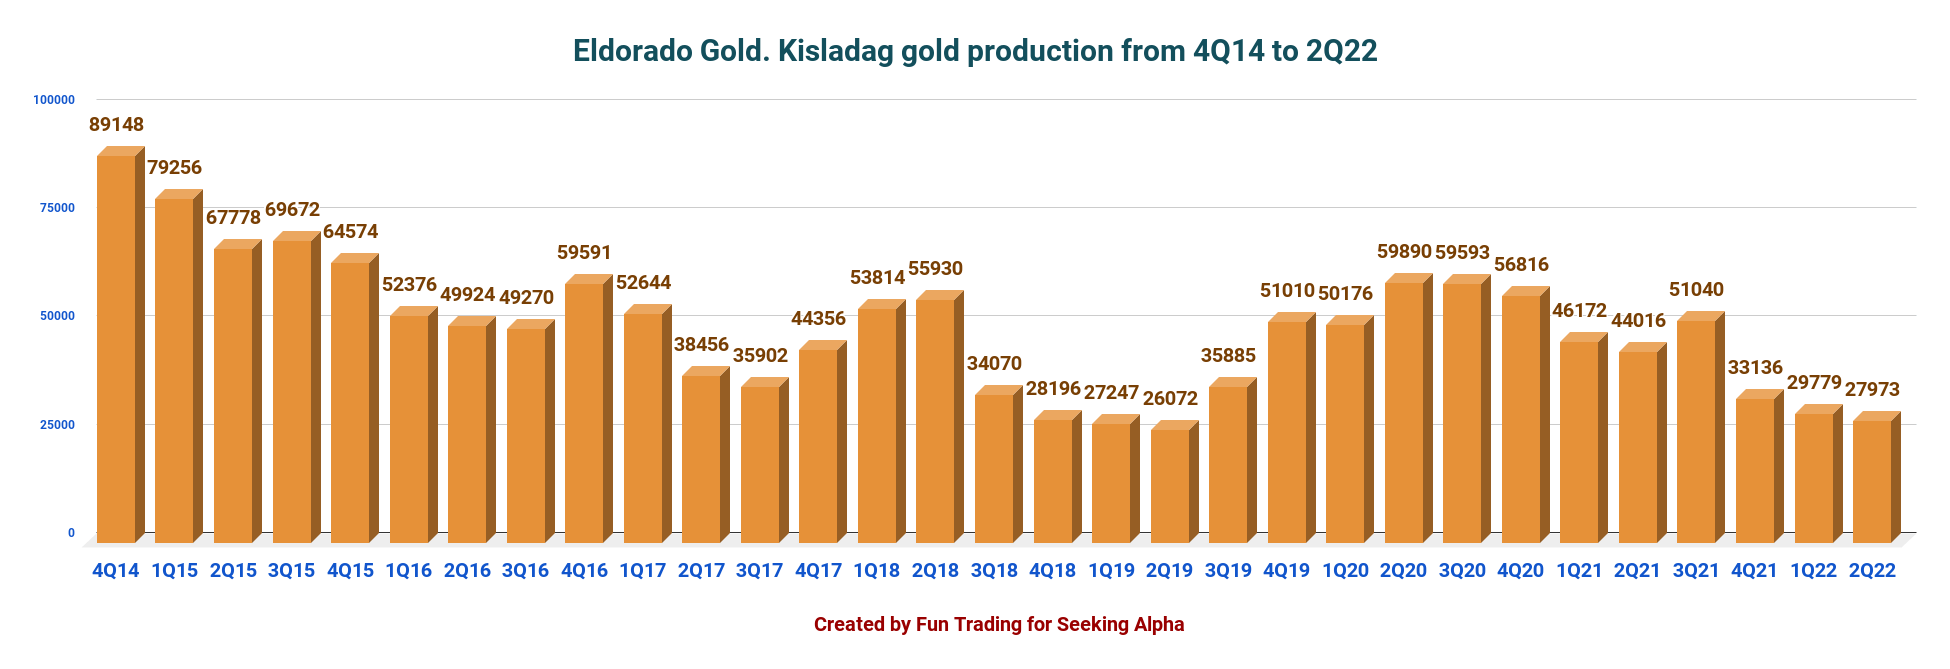
4 – Efemcukuru Mine
Production was in line with expectations. Gold production was 22,793 ounces compared to 23,473 ounces in the same quarter last year.
Gold production, throughput, and average gold grade aligned with expectations.
EGO Efemcukuru Quarterly production history (Fun Trading)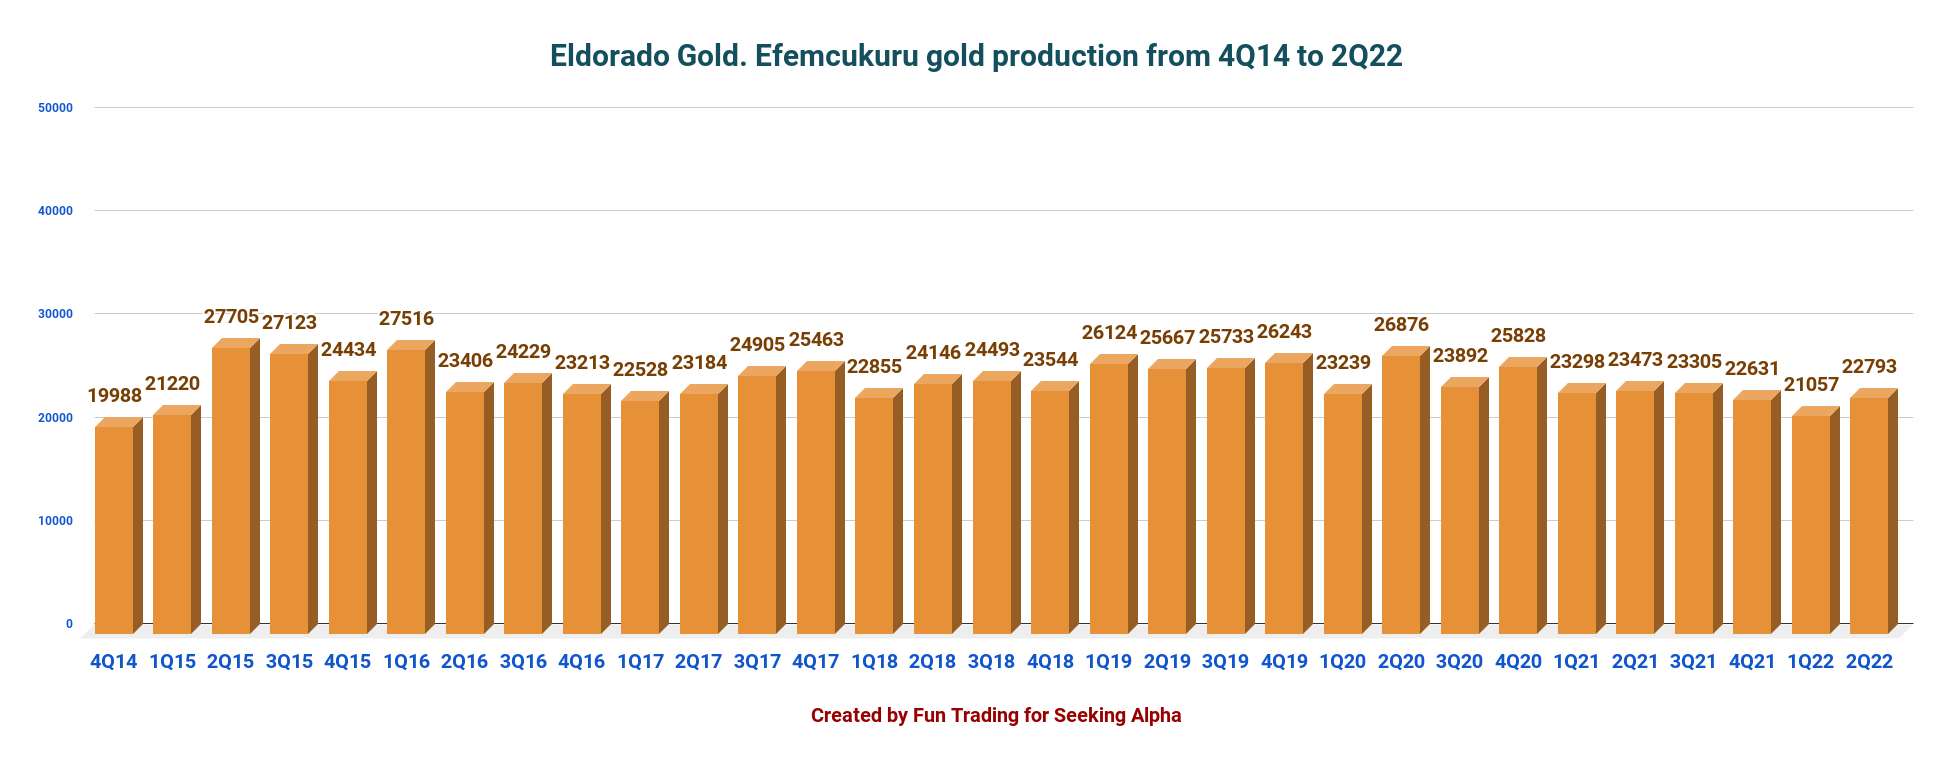
5 – Commentary about Turkiye, which is the new official name of Turkey
We should expect increased costs due to the weakening of the Lira.
The Company’s profits from mining operations in Turkiye are taxed at the enacted rate and the resulting current income tax expense can be further increased or reduced by other items.
In the second quarter, the Company expects the Turkish current income tax expense on mining profits, at an enacted rate of 22%, to be further increased up to $4 million.
The expected increase is primarily related to the weakening of the Lira in the quarter and the resulting generation of taxable unrealized foreign exchange gains, partly offset by reductions related to Lira deposits and the investment tax credit relating to Kisladag heap leach improvements
Technical Analysis And Commentary
EGO TA chart short-term (Fun Trading)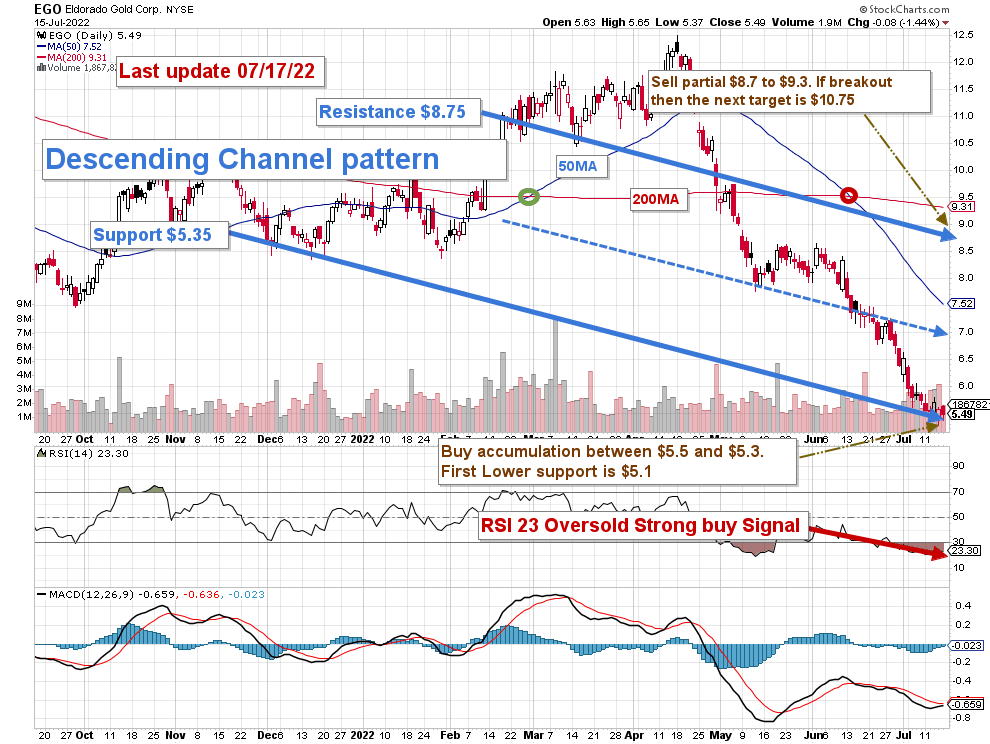
EGO forms a descending channel pattern with resistance at $8.75 and support at $5.35. The stock is highly oversold with an RSI of 23, which is a strong buy signal.
The trading strategy I suggest is to sell about 40% between $8.7 and $9.3 (trading LIFO). However, I recommend starting selling between $7 and $7.50 (50MA), which is considered an intermediate resistance.
Conversely, I suggest accumulating on any weakness at or below $5.5 with a possible low at $5.1 depending on the Fed’s action on the interest rate.
Watch gold like a hawk.
Note: The LIFO method is prohibited under International Financial Reporting Standards (IFRS), though it is permitted in the United States by Generally Accepted Accounting Principles (GAAP). Therefore, only US traders can apply this method. Those who cannot trade LIFO can use an alternative by setting two different accounts for the same stocks, one for the long term and one for short-term trading.
Warning: The TA chart must be updated frequently to be relevant. It is what I am doing in my stock tracker. The chart above has a possible validity of about a week. Remember, the TA chart is a tool only to help you adopt the right strategy. It is not a way to foresee the future. No one and nothing can.
Author’s note: If you find value in this article and would like to encourage such continued efforts, please click the “Like” button below as a vote of support. Thanks.
Be the first to comment