

peshkov/iStock via Getty Images
A guest post by Ovi
Each month the EIA produces four reports which project oil output for the US and the World. The Short Term Energy Outlook (STEO) forecasts oil output for a period of 12 to 24 months into the future for US and World oil production. A second report, the Drilling Productivity Report (DPR) forecasts the combined production for conventional and tight oil in the main tight oil basins, four months ahead of the EIA monthly report. Their third report, Light Tight Oil (LTO), reports on only the tight oil produced in seven tight oil basins and a few smaller ones. A fourth and final outlook is the Monthly Energy Review (MER) that forecasts US output two months past the official US production numbers, for this report that will be October and November. Due to technical issues at the EIA, the LTO report and the MER were not available at press time.
Production numbers/charts for May for four countries obtained from their official sites are provided below.
Normally the Outlooks report appears at the end of the monthly US report. For this month it has been posted separately and early.
1) Short-Term Energy Outlook
The June STEO provides projections for the next 21 months, starting with April 2022 to December 2023, for US C + C and other countries.
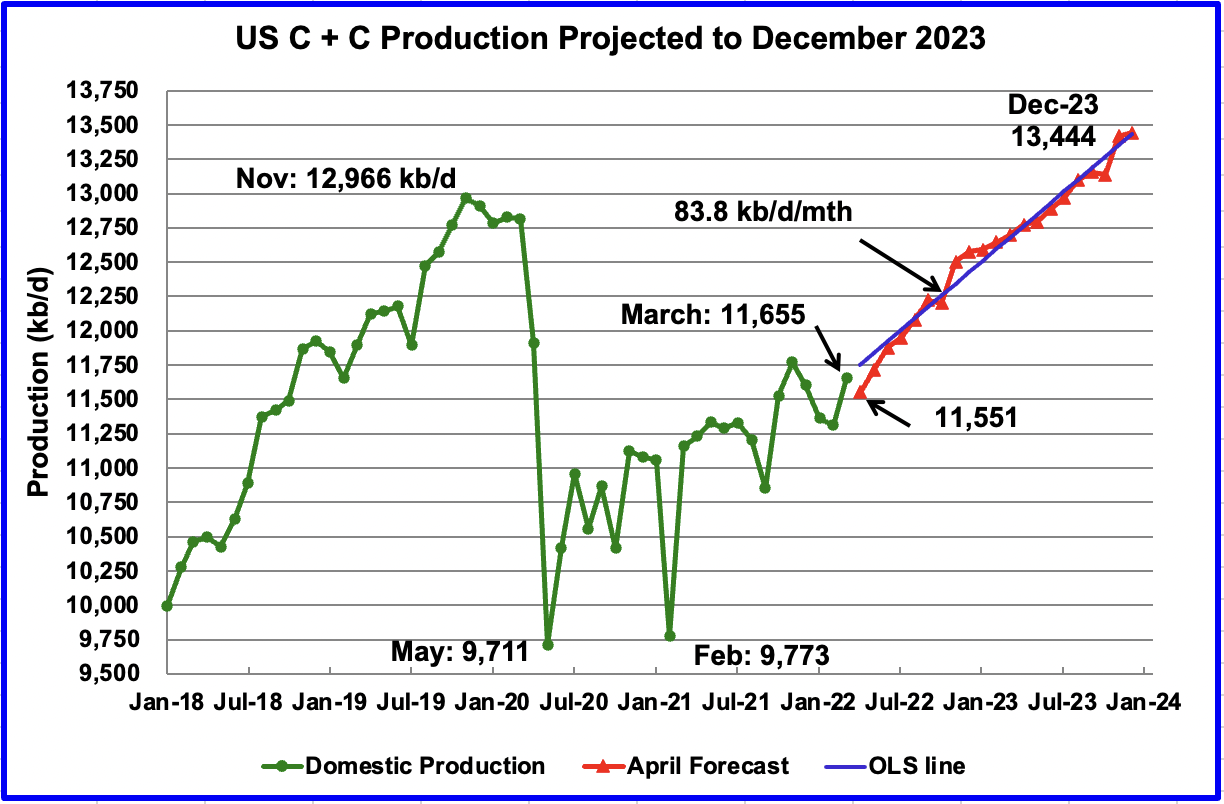
The June 2022 STEO has revised downward its projected US oil output from May 2022 to Q3-23. However, Q4-23 has been revised up from the previous May 2022 STEO. In December 2023 output is expected to reach 13,444 kb/d, 160 kb/d higher than reported in the May report.
Using only the projected data from May 2022 to December 2023 to fit an OLS line, the STEO is forecasting production will increase at an average rate of 83.8 kb/d/mth, much higher than the average rate of 76.1 kb/d/mth estimated in the May report. If the December 2023 output is achieved, it will be 478 kb/d higher than the November 2019 record. The monthly rate of 83.8 kb/d translates into a yearly increase of more than 1,000 kb/d.
Note that the STEO is projecting a drop in April, which may be associated with North Dakota’s April production drop.
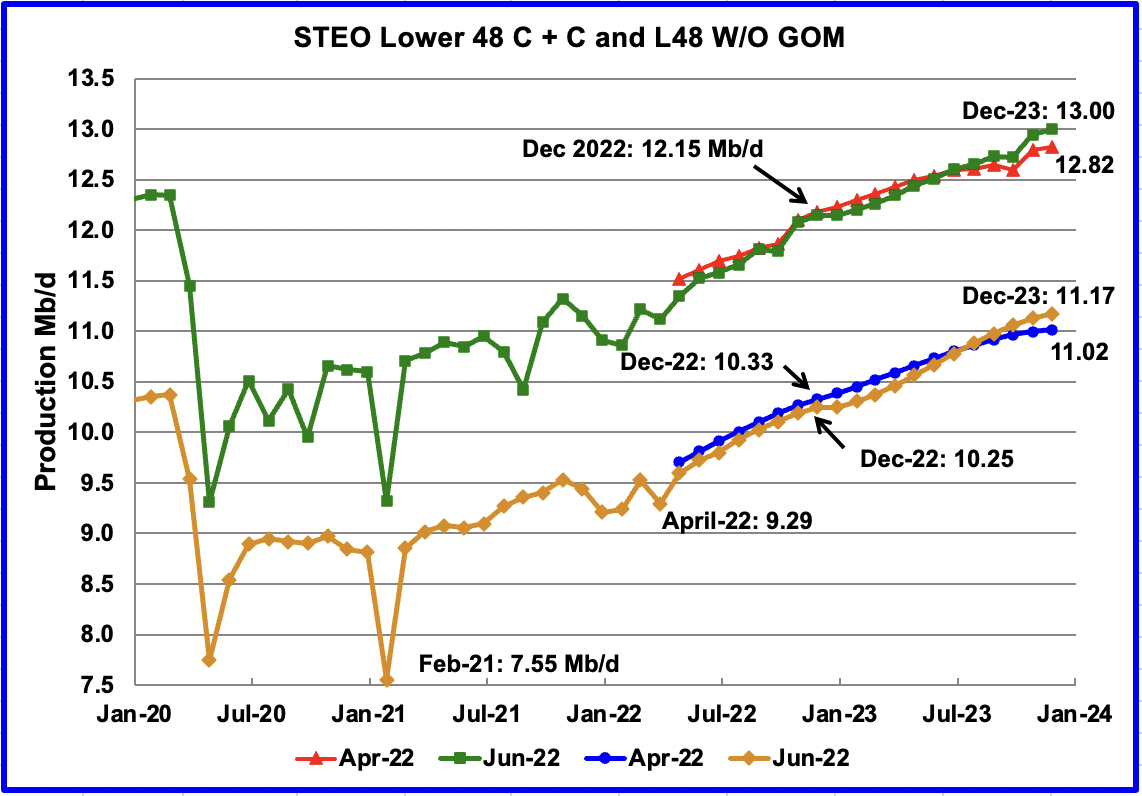
This chart compares the STEO forecast from the April report with the current June report to better illustrate how the output forecast for June 2022 changed. For the Lower 48, the December 2023 output has been revised up by 180 kb/d to 13.00 Mb/d. For most of 2022 and 2023, production was revised slightly closer to the April estimate. However, over the last 4 months of 2023 production is projected to be higher.
The June output projection for the Onshore L48 states has also been revised down from the April forecast except for the last three months of 2023 which are higher. For December 2023, the output is increased by 150 kb/d to 11.17 Mb/d.
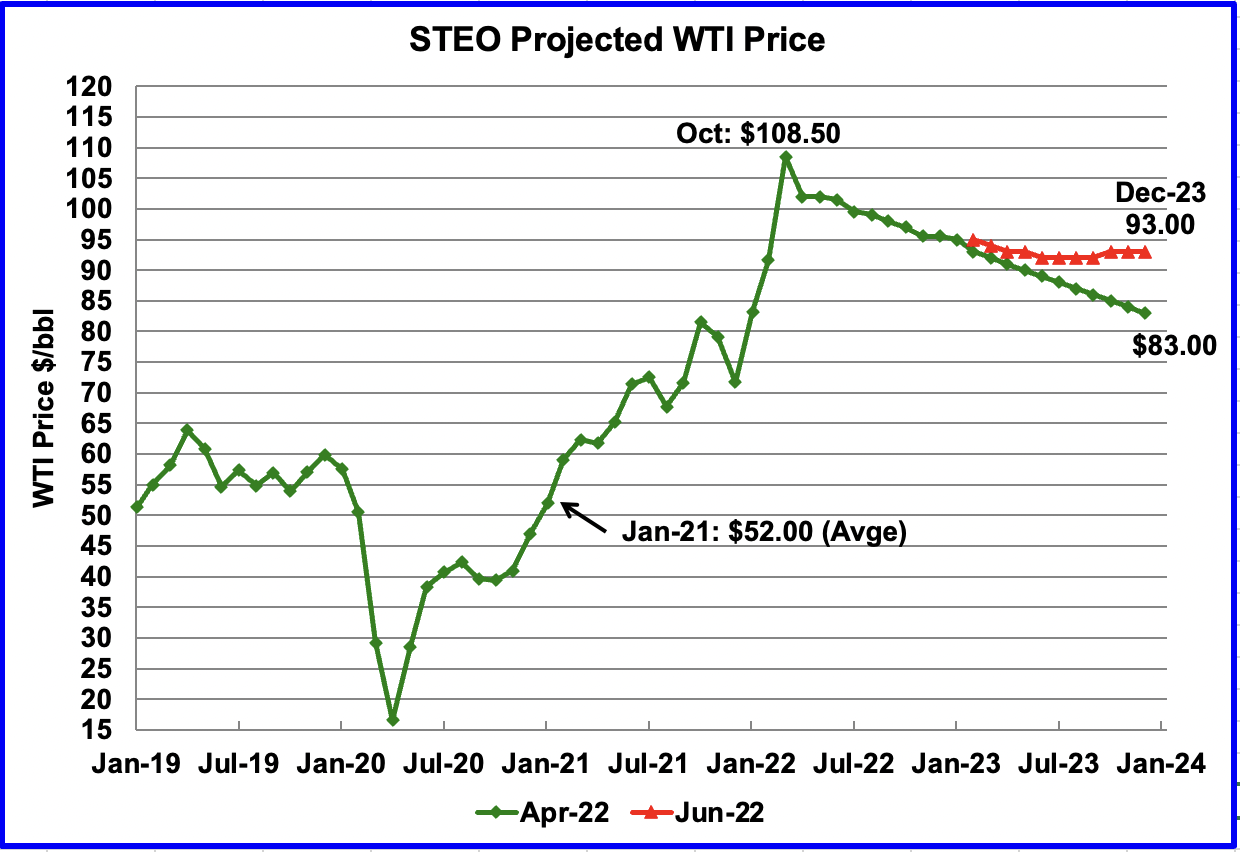
The June 2022 STEO oil price forecast continues to show a steady decline from the EIA’s new March peak of $108.50/bbl to $93/bbl in December 2023. Essentially, the EIA is continuing to forecast that the only direction for the price of WTI going forward is down to $93/bbl. However, what is different with their latest forecast is that the price of oil stabilizes in the $93/b area during the latter half of 2023.
The June STEO price forecast was the same as May even though the July contract at the publishing time was over $115/b. The average July STEO price for WTI is $99.50/b.
The August WTI contract settled at $107.62 on June 24, $8.62/b higher than the EIA’s forecast average price of $99.00/bbl for the August contract.
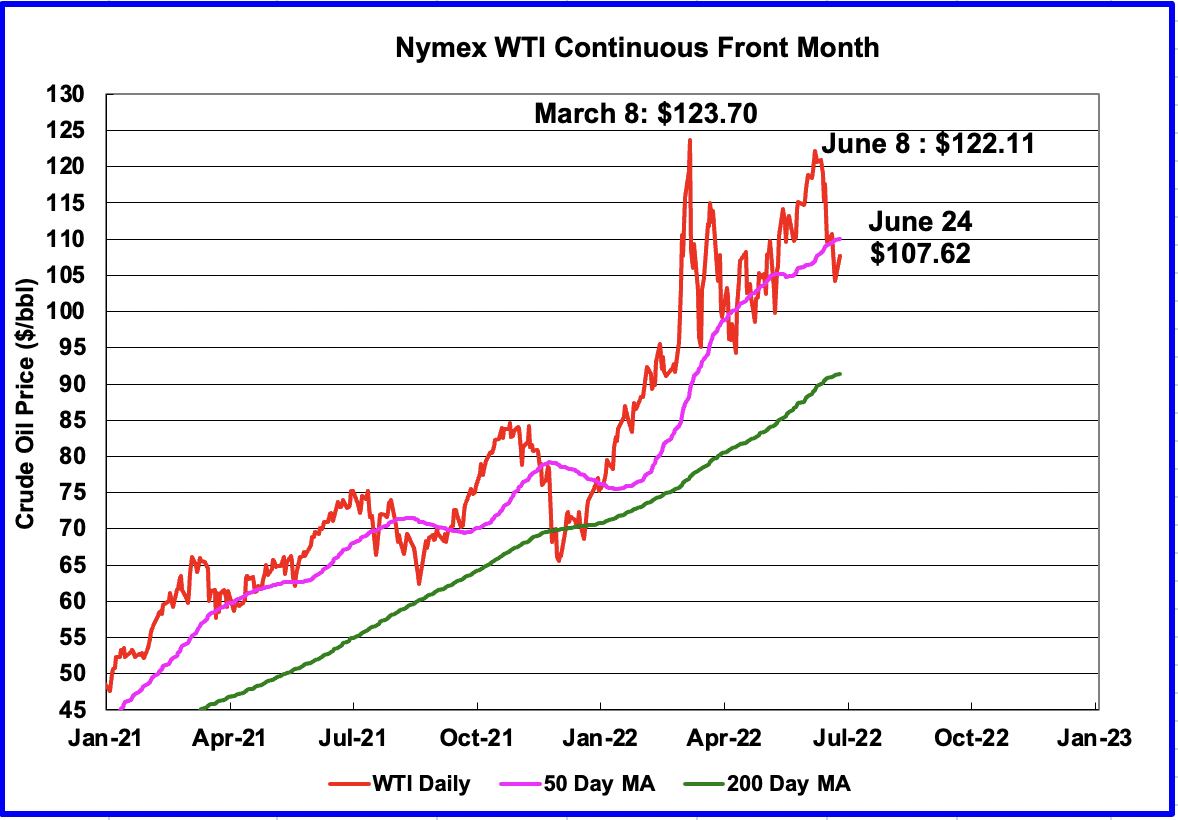
WTI on June 24 settled below the 50-day moving average. The rapid decline from the June 8 high of $122.11/b was due to recession concerns and possible higher Russian production than anticipated.
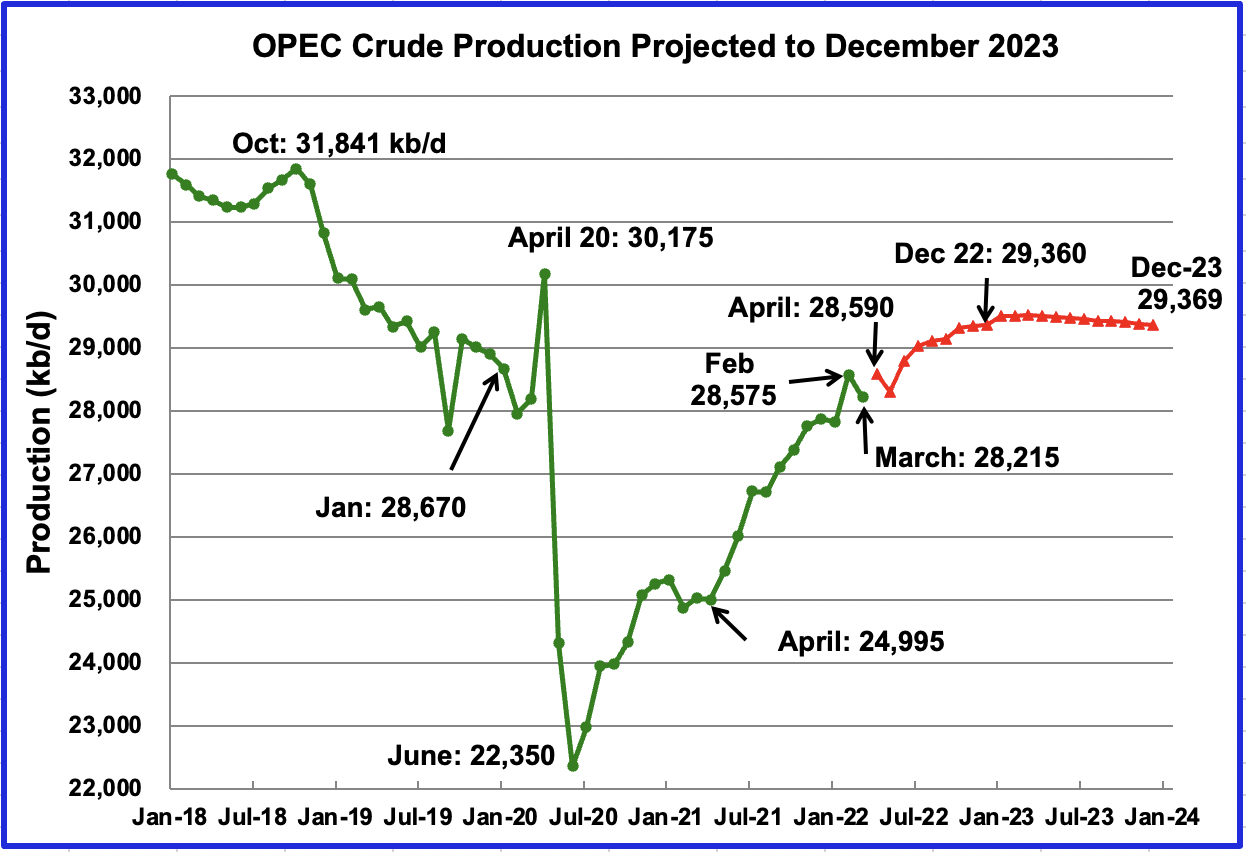
This chart shows the STEO’s June forecast for OPEC crude output from April 2022 to December 2023. OPEC’s output is projected to increase from April 2022 to December 2022 by 770 kb/d to 29,360 kb/d. After December 2022, production remains essentially flat at close to 29,365 kb/d out to December 2023.
The June report decreased OPEC output for December 2022 by 124 kb/d. In parallel, the December 2023 output was decreased by 92 kb/d.
For May 2022, the June STEO forecasted OPEC production to be 28,295 kb/d, lower than April’s 28,590 kb/d. Actual May production as reported by OPEC was 28,508 kb/d. OPEC’s May production was lower than April as forecast by the STEO.
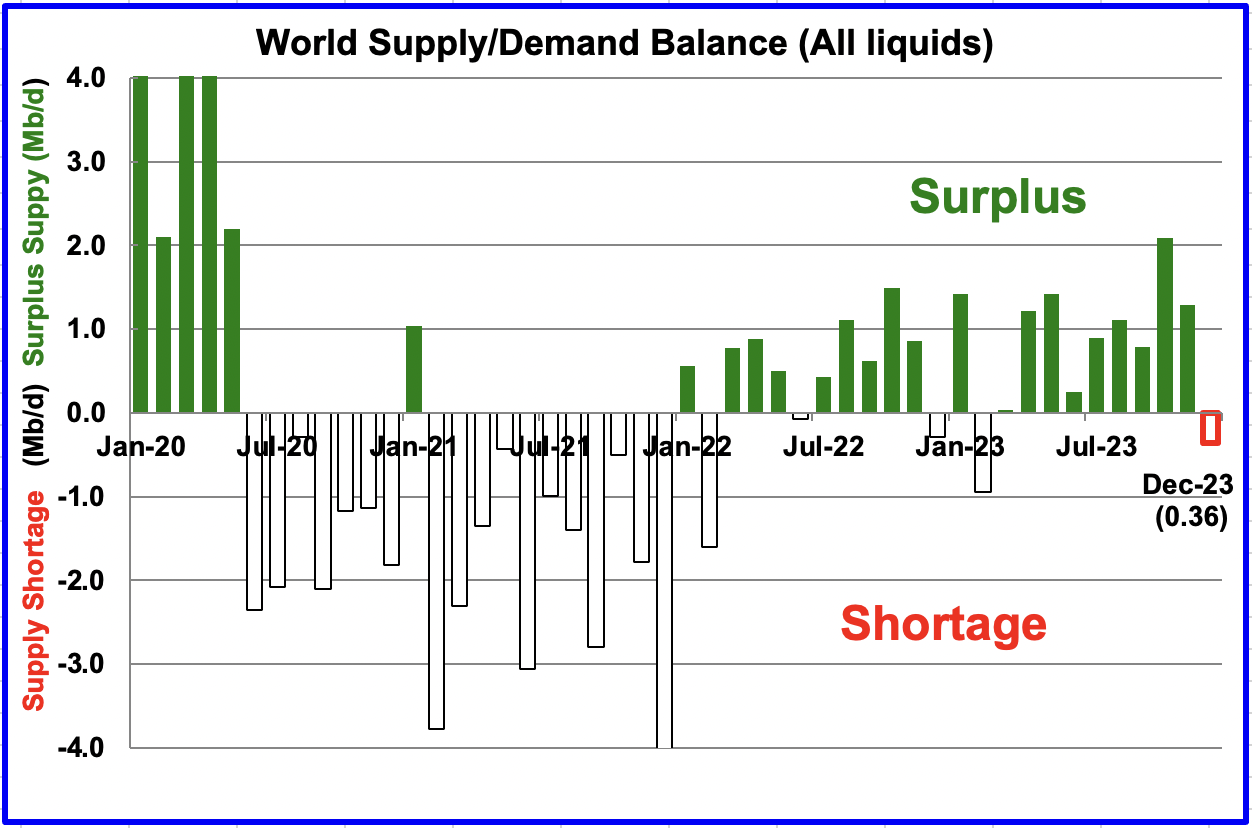
This chart shows the historical world supply/demand balance up to April 2022 and after that, the EIA’s forecast out to December 2023.
From May 2022 to December 2023, the STEO is forecasting an average monthly surplus of close to 693 kb/d up from 167 kb/d in the previous report. The sanctions on Russian oil increased prices and reduced future demand may account for the increase to this month’s surplus forecast.
2) Drilling Productivity Report
The Drilling Productivity Report (DPR) uses recent data on the total number of drilling rigs in operation along with estimates of drilling productivity and estimated changes in production from existing oil wells to provide estimated changes in oil production for the principal tight oil regions. The June DPR forecasts production to July 2022 and the following charts are updated to July 2022.
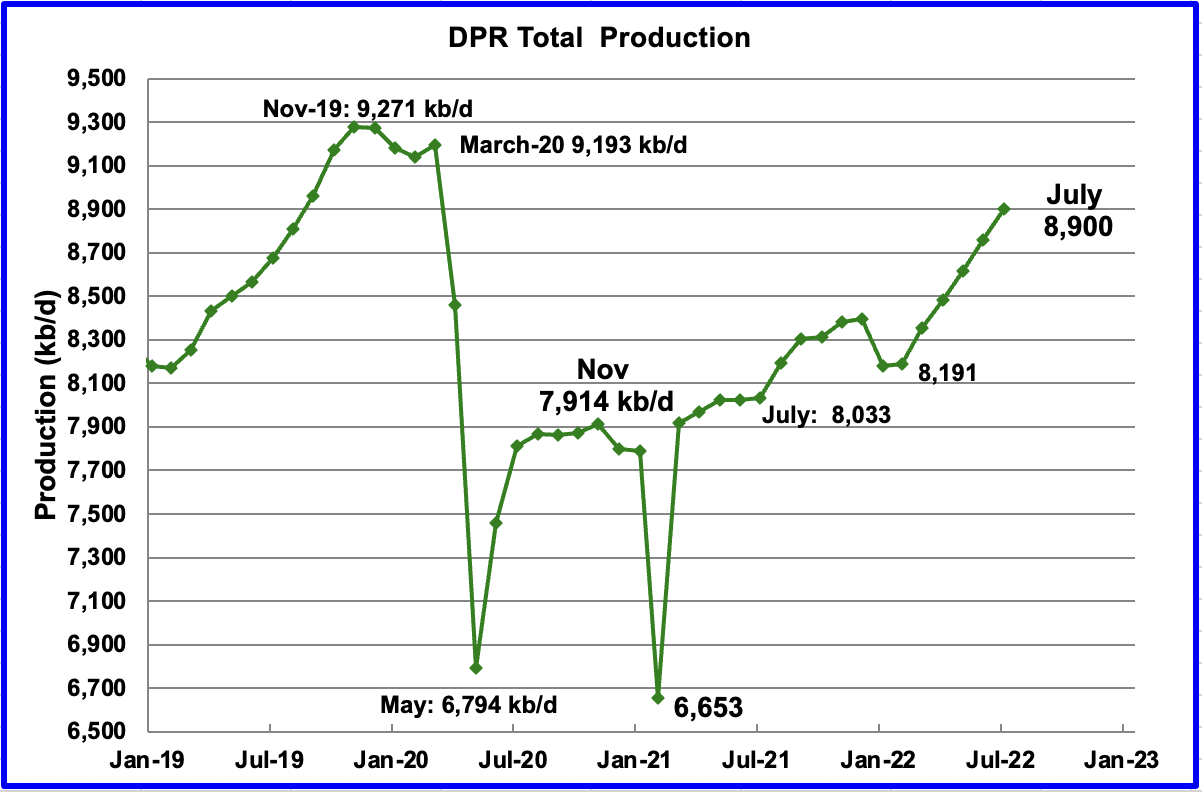
Above is the total oil production projected to July 2022 for the 7 DPR basins that the EIA tracks. Note that DPR production includes both LTO oil and oil from conventional wells.
The DPR is projecting that oil output for July 2022 will increase by 143 kb/d to 8,900 kb/d. From February’s output of 8,191 kb/d to July 2022, output in the DPR basins is forecast to increase by 709 kb/d or by an average of 141.8 kb/d/mth. Note that this monthly production rate is much higher than the STEO rate of 83.8 kb/d projected in the STEO section above.
It is difficult to assess what is really happening in the near term in the DPR basins since significant revisions are made to the previous few months. For Instance, North Dakota has now reported a production drop of close to 220 kb/d in April. That drop does not show up in this projection. This raises the question of from where does the STEO get their information to make these projections?
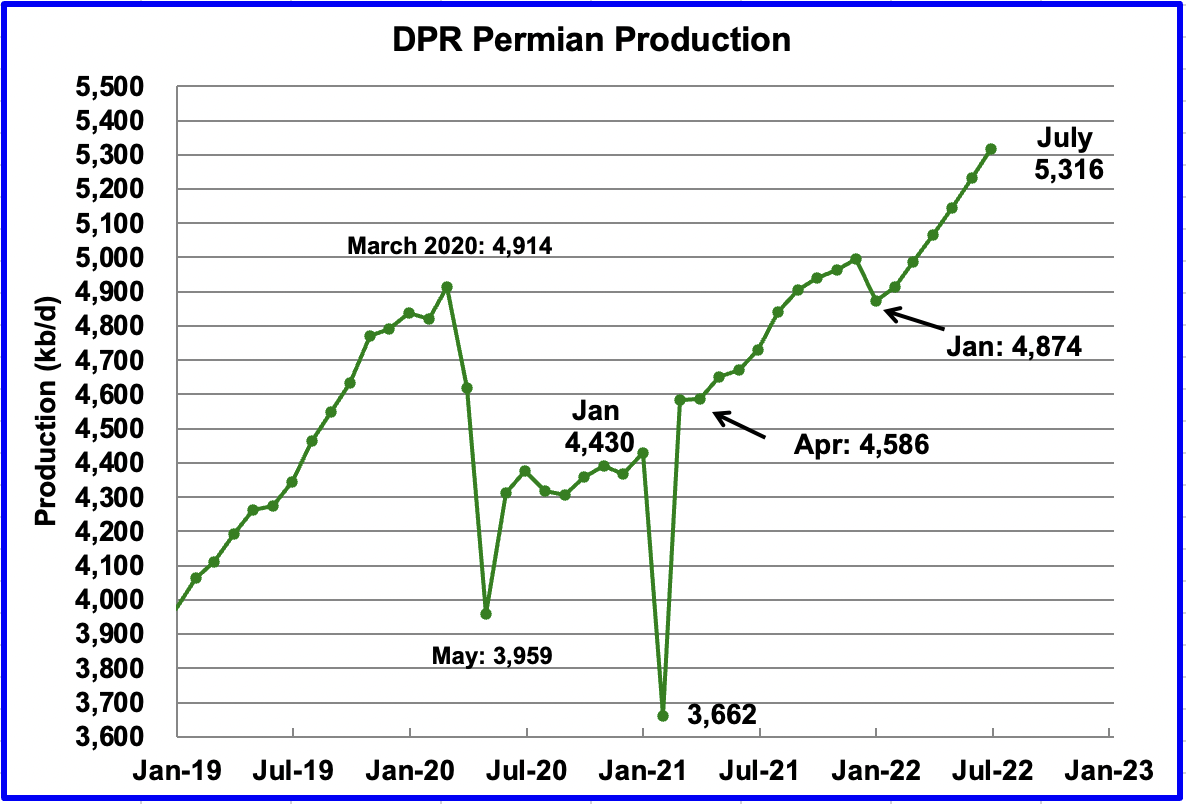
Permian output exceeded 5,000 kb/d in April 2022 and continues to increase. In July, production is expected to increase by 84 kb/d to a new high of 5,316 kb/d. From January to July, production is forecast to increase by 442 kb/d or at an average rate of 73.7 kb/d/mth. If the Permian were part of OPEC, at 5,316 kb/d it would be the second-largest producer after Saudi Arabia.
During May, 399 wells were drilled and 436 were completed in the Permian. The completed wells added 358 kb/d to May’s output for an average of 821 kb/d/well. The overall decline was 278 kb/d which resulted in a net increase for Permian output of 80 kb/d. Of the 436 completed wells, 339 were required to offset the decline. It is the completion of the additional 97 DUCs, over and above the drilled wells that accounts for the increase in the production in the Permian.
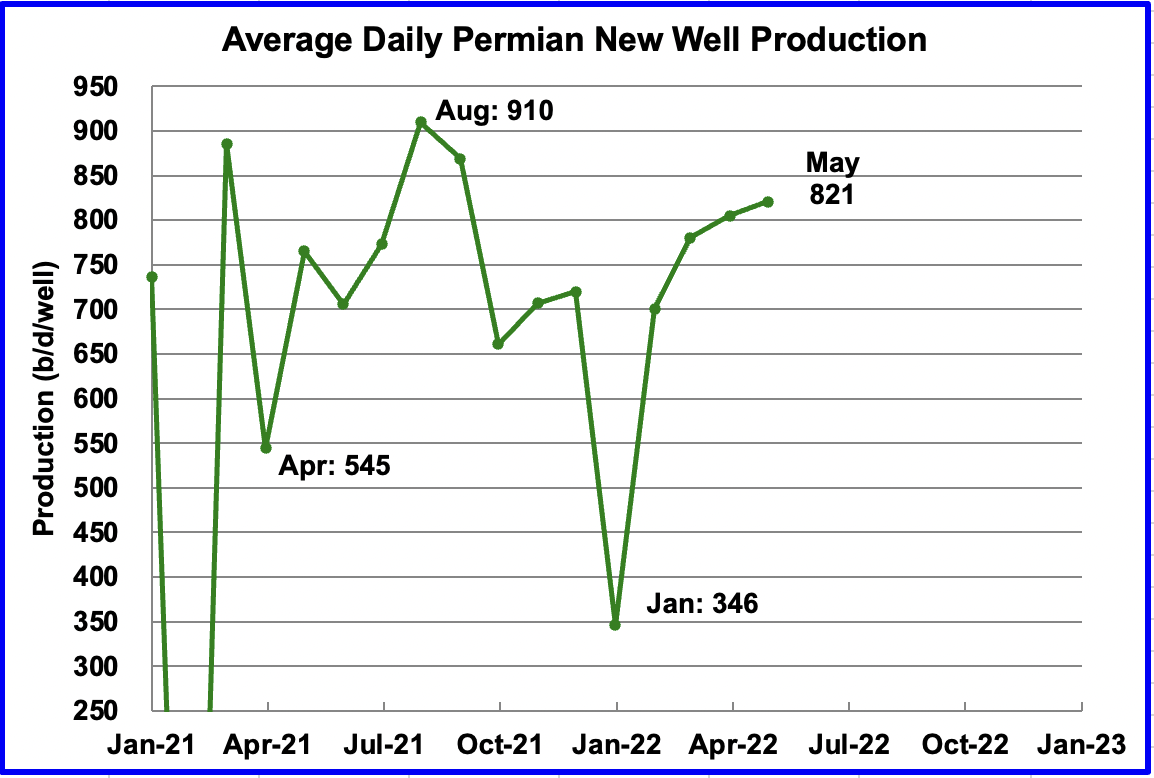
This chart shows the daily production from the average first month Permian well tracked on a monthly basis. The daily output for new Permian wells was divided by the number of completed wells, as reported in the DPR and DUC reports. Note this chart is two months behind the DPR production charts.
The recent average first-month output continues to be close to 800 kb/d. May’s average output was 821 b/d/well. January dropped due to bad weather in Texas.
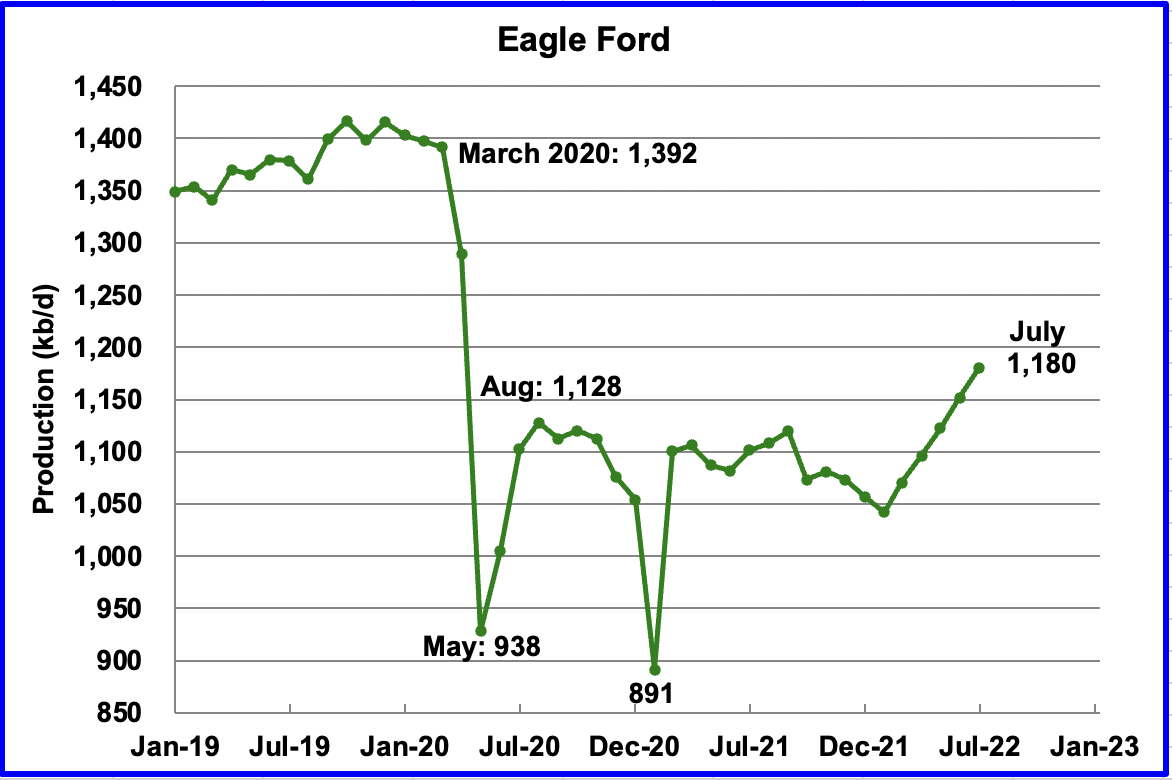
Output in the Eagle Ford basin has been showing an increasing trend since March 2022. For July, output is expected to increase by 28 kb/d to 1,180 kb/d.
Here is a story on “How One Eagle Ford Shale Producer Illustrates The New Model For Success”
“The days of an active rig count of 2,000+ in North America generating oil and natural gas drilling and fracking booms in half a dozen major shale plays across a dozen states are gone, at least for the foreseeable future. Despite global demand for more oil and gas, much stronger commodity prices and the sudden new interest from the Biden administration for more domestic energy production, the focus of corporate independent producers like Ranger Oil is on performance metrics like free cash flow and rewarding investors with higher returns.”
“We have a share repurchase program of $100 million that starts in the 2ndquarter. Starting in the 3rd quarter we’re going to implement an annual dividend of 25 cents per share, we’ll do that quarterly at 6.25 cents per share.”
“One thing Henke and his team will not be doing with that free cash flow is implementing major increases in the company’s drilling program. “We haven’t had shareholders on our doorstep demanding we grow our production and out-spend our cash flow like the industry did for many years,” he told me. “That’s certainly not what is being rewarded in the market now.”
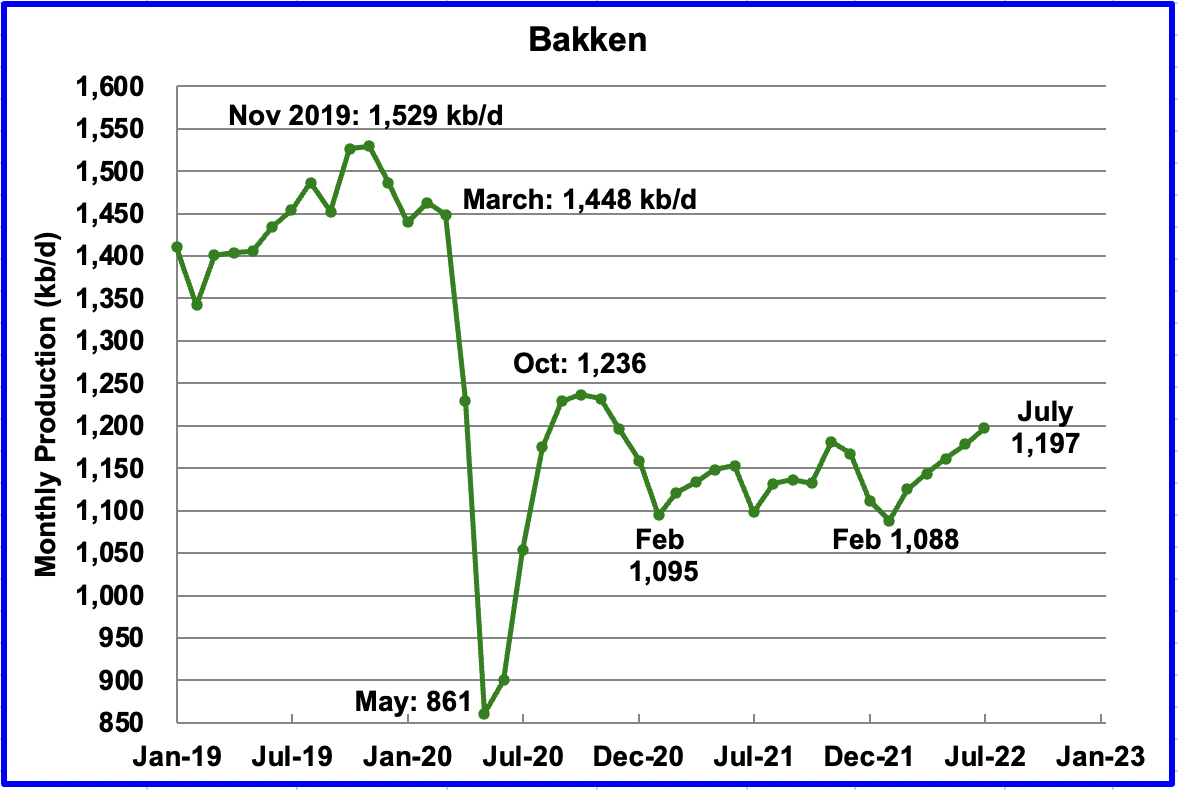
The DPR forecasts Bakken output in July to be 1,197 kb/d an increase of 19 kb/d from June.
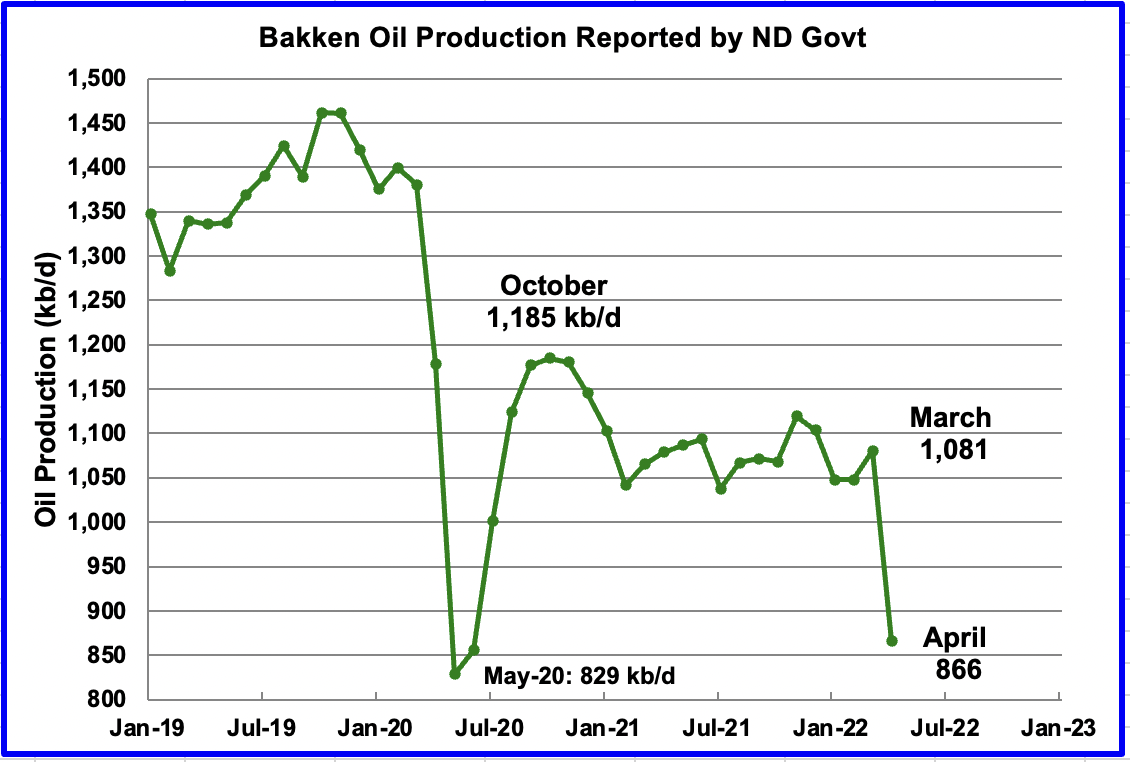
This is the Bakken output as reported by the North Dakota government. Note the 215 kb/d drop in April does not show up in the DPR Bakken chart above.
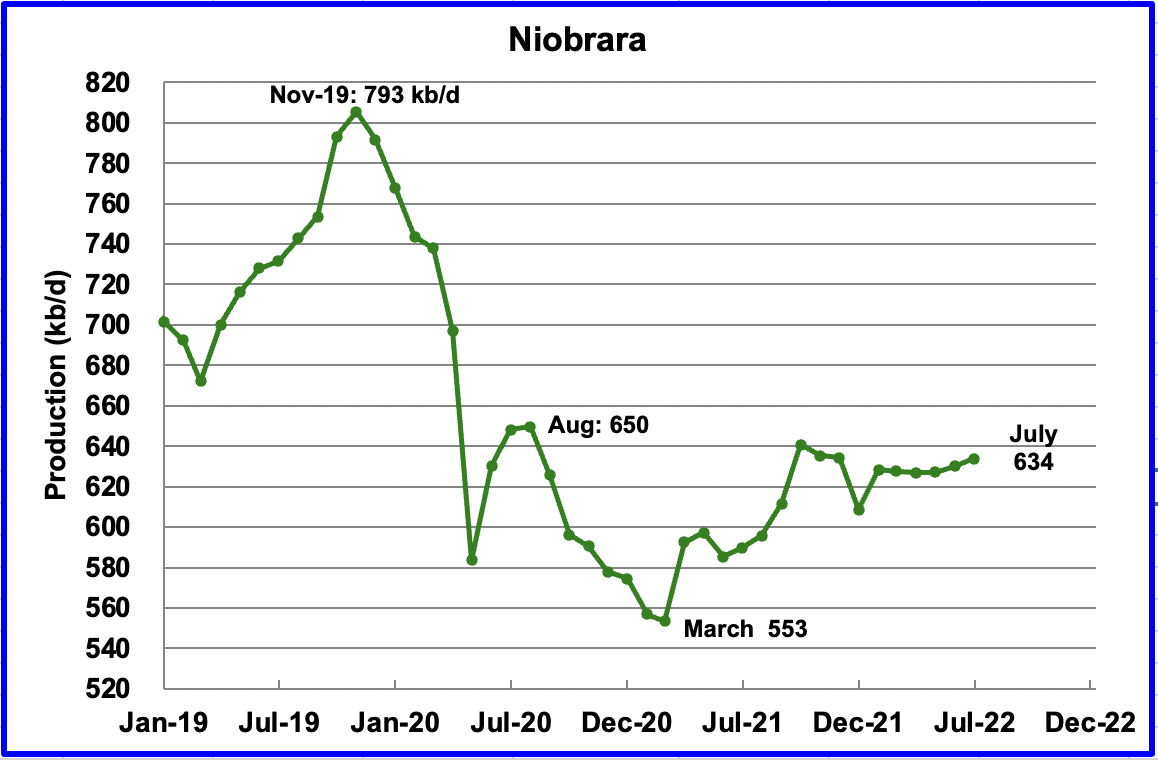
Output in the Niobrara is growing slowly. July output increased by 4 kb/d to 634 kb/d.
DUCs and Drilled Wells
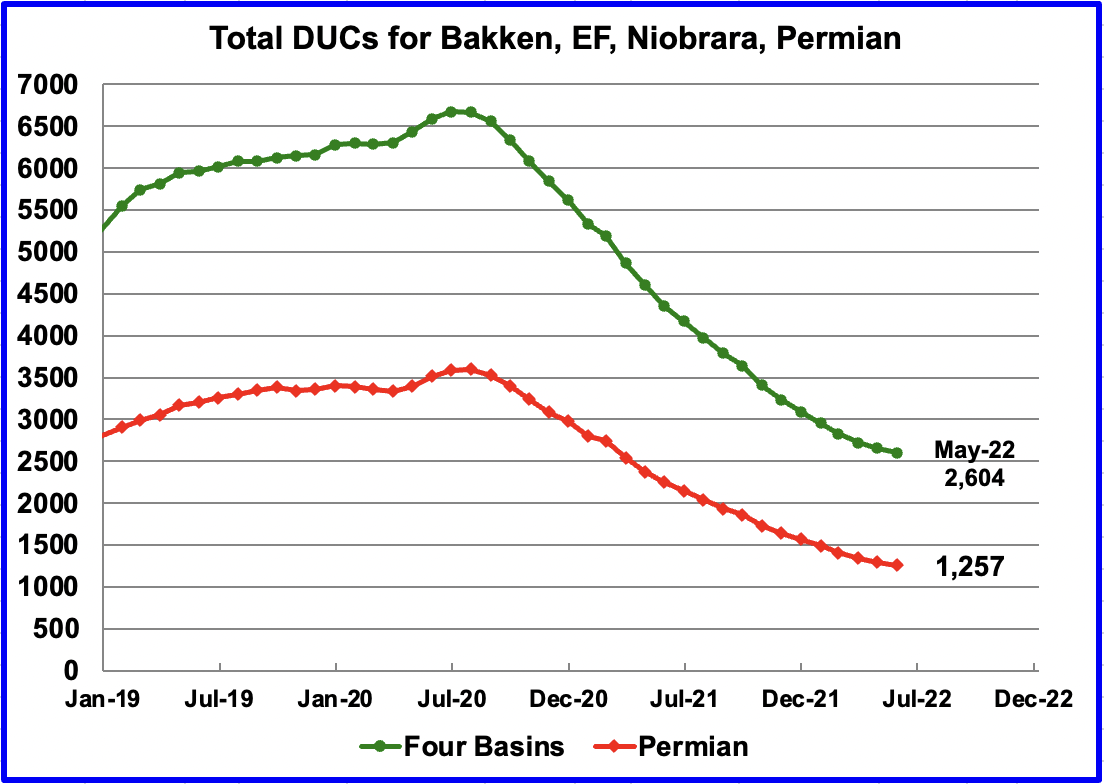
The number of DUCs available for completion in the Permian and the four major DPR oil basins has continued to fall every month since July 2020. Prior to July, more wells were drilled than were completed.
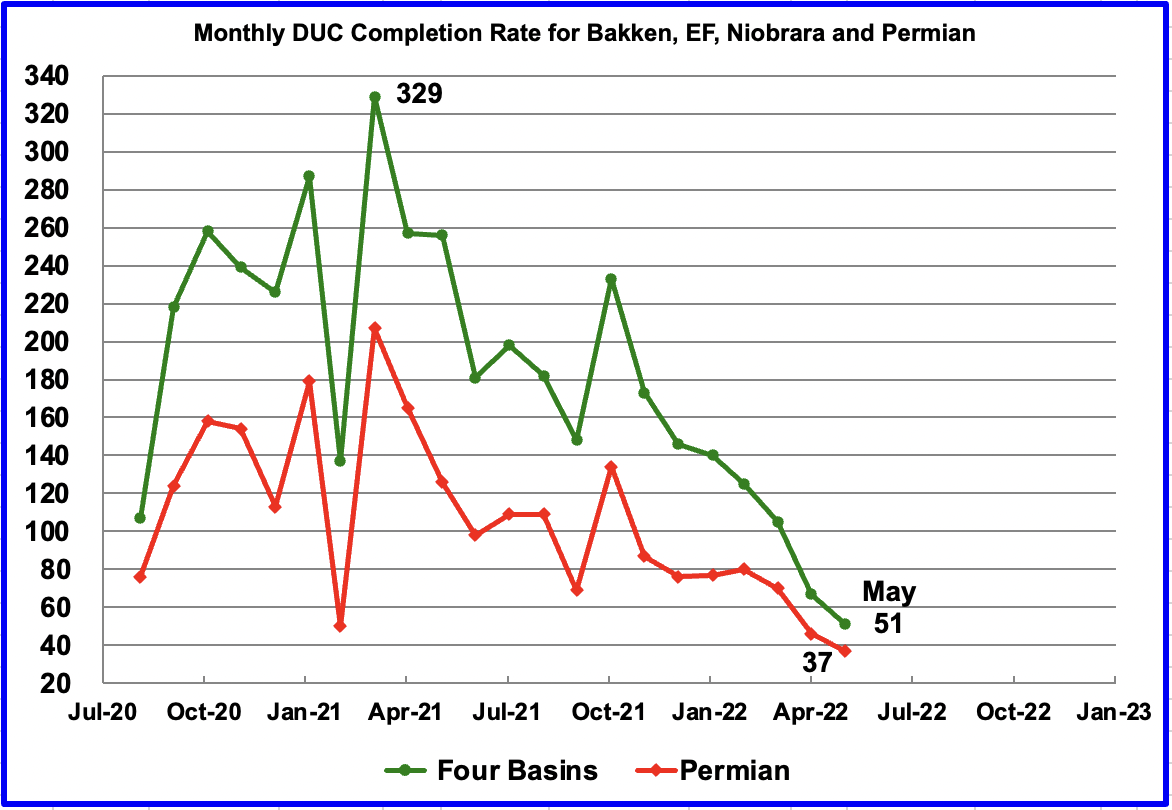
In these four primarily oil basins, the monthly completion rate of DUCs started to slow after peaking in March 2021 at 329. In May 2022, 51 DUCs were completed, 16 fewer than in April. Similarly, the monthly completion rate for DUCs in the Permian continues to fall. It dropped from 46 in April to 37 in May. Is this an indication that the remaining DUCs are getting less economic.
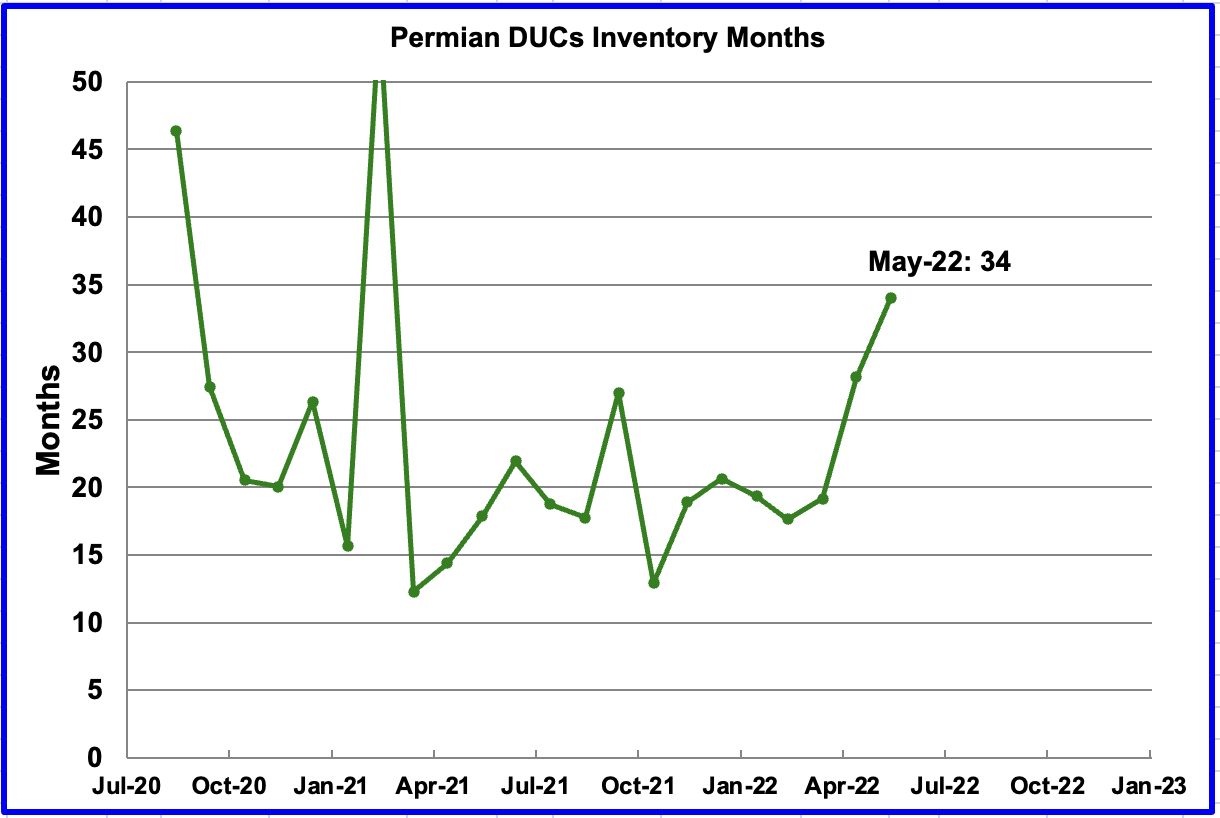
If Permian DUCs were to be completed at the latest rate of 37 DUCs/mth, that converts into 34 months of DUC inventory, assuming the remaining 1,257 are all commercially viable. The increase in DUC inventory months is due to the slowing rate of completing DUCs.
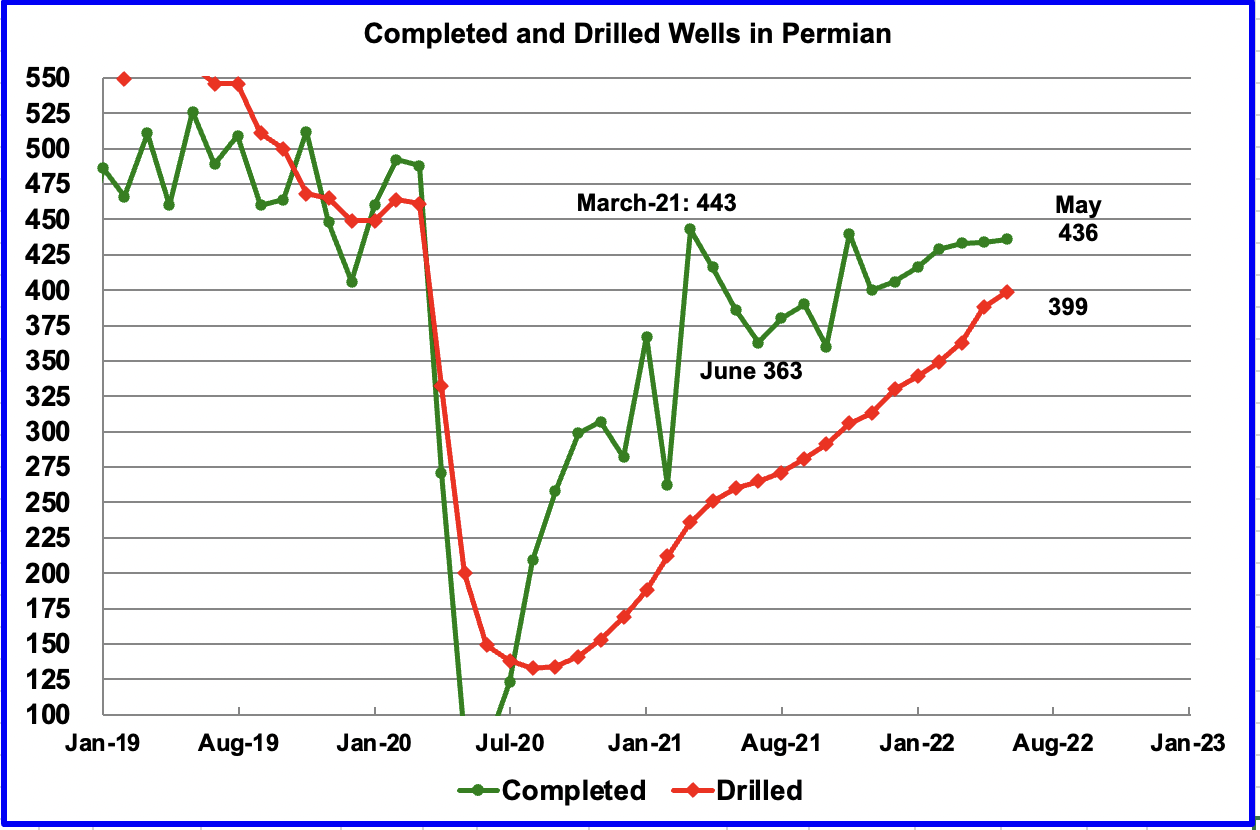
In the Permian, the monthly completion rate has been showing signs of slowing since March. In May 436 wells were completed, 2 more than in April. During May, 399 new wells were drilled, an increase of 11 over April. To counteract the lowering use of DUCs, drilling has been increased.
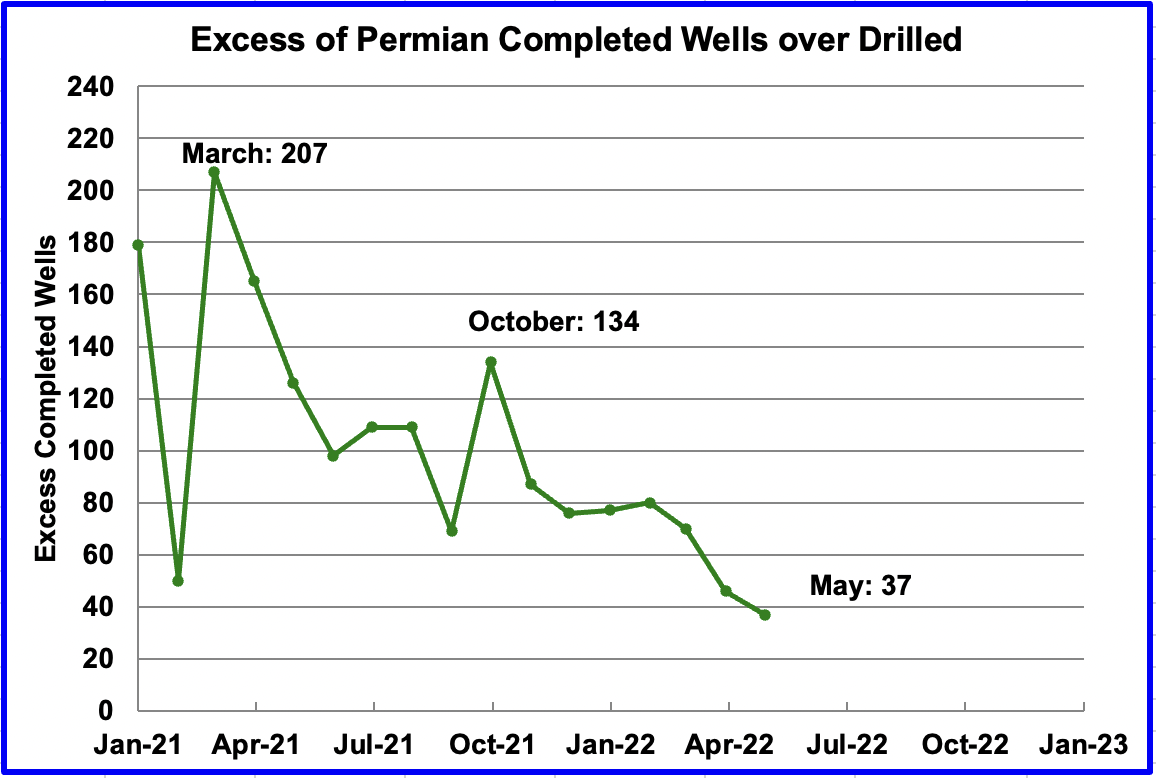
In October 2021, 134 more wells were completed in the Permian than were drilled. In May 2022, the number of excess wells completed was down to 37 since the drilling rate was higher than the completion rate. To offset the drop in the use of DUCs, more wells had to be drilled to increase production.
5) Rigs and Fracs
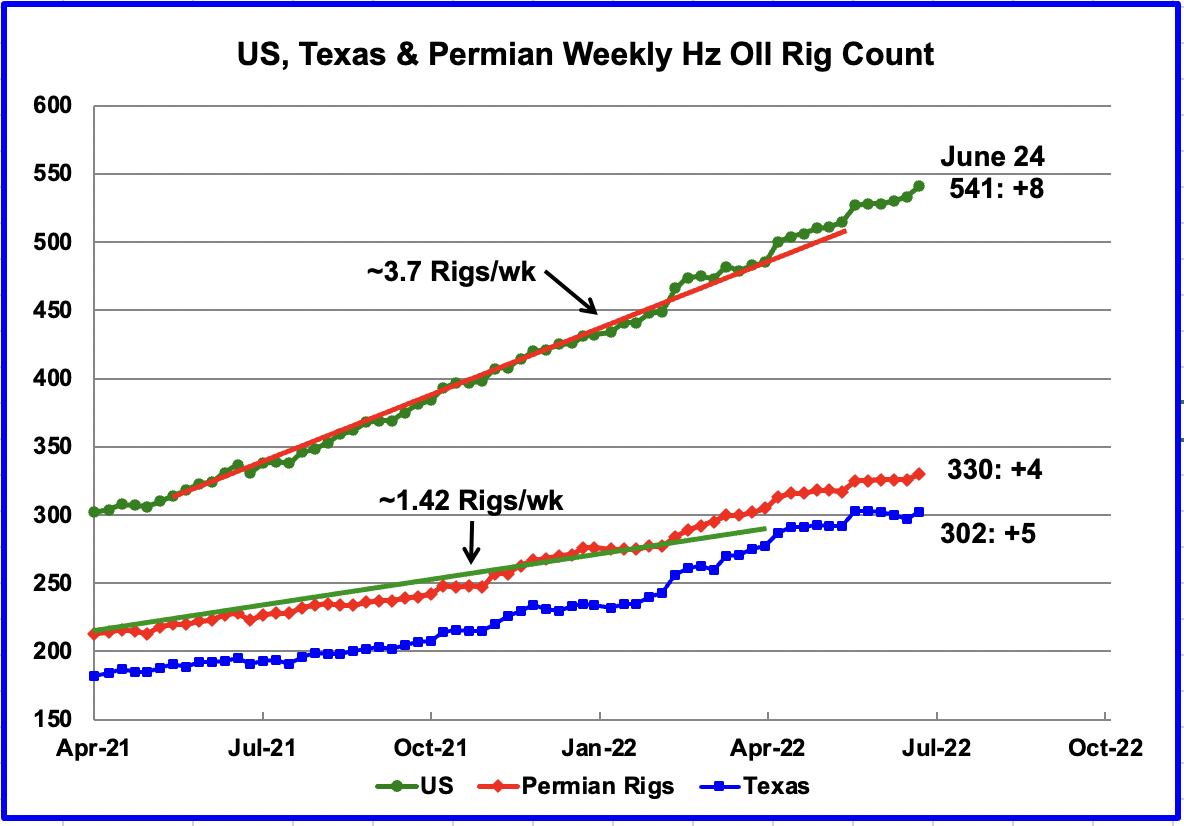
Since the beginning of April, the US has been adding oil rigs at a rate of close to 3.7 rigs/wk. Of these, the Permian has been adding 1.42 rigs/wk over the period April to September. However, since the end of January, it appears that the addition of rigs in the Permian basin has accelerated over the average rate as the red graph breaks away to the upside from the green trend line. The addition of rigs in the Permian since the end of January has increased to 2.5 Rigs/wk.
In the week of June 24, there were 330 rigs operating in the Permian, an increase of 4 over the previous week. This seems to confirm that drilling in the Permian continues to be attractive to the drillers.
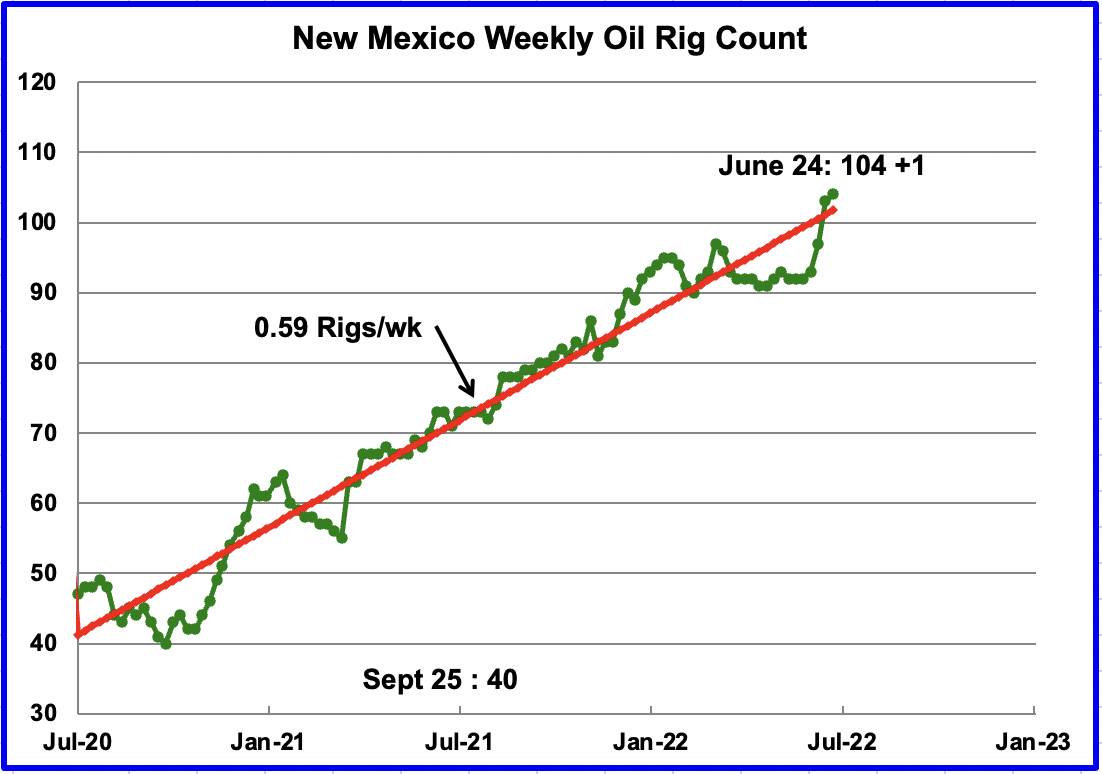
On occasion for a few weeks, it appears that rigs are not being added in the Permian. See recent flat spots in previous chart. However, by looking at the rig count in the New Mexico Permian, it appears that rigs move back and forth between the Texas and New Mexico Permian. The rig count in New Mexico has increased at an average rate of 0.59 Rigs/wk since July 2020.
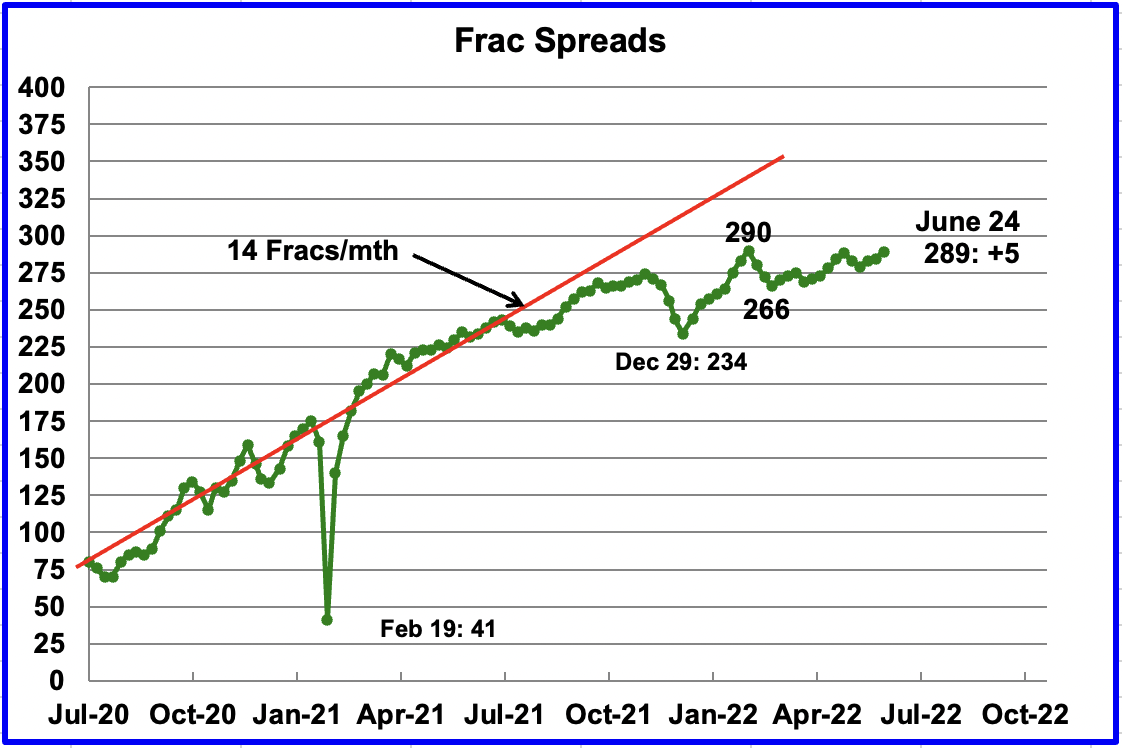
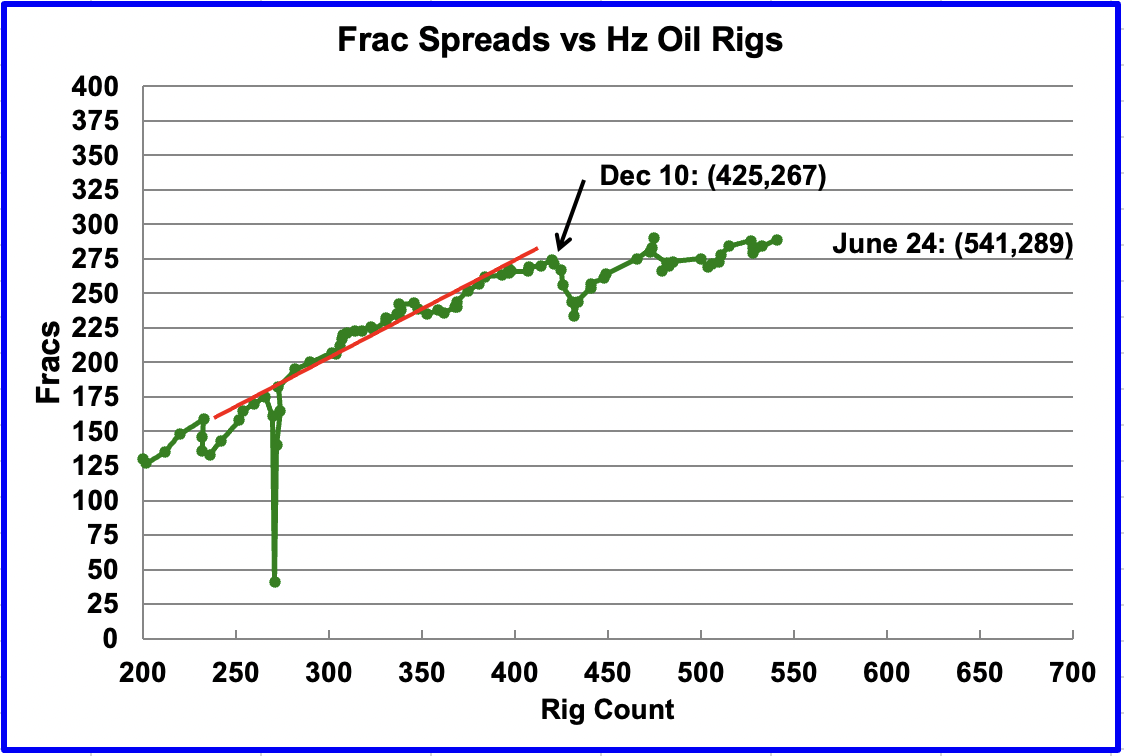
Since early February, the growth in frac spreads has not been keeping up with the growth in rigs. In the week ending February 25, 290 frac spreads were operating, 1 more than the 289 operating in the latest week ending June 24. In the second chart, one can clearly see how the rate of frac spread additions has slowed compared to rig additions. Now that summer is here, the frac spread count may begin to increase provided the hurricane season does not impact plans/operations.
Note that these 289 frac spreads include both gas and oil spreads, whereas the rigs information is strictly for oil rigs.
Updated Oil Production from Four Non-OPEC Countries
The following charts are updated to May 2022 using data provided by the country’s official website.
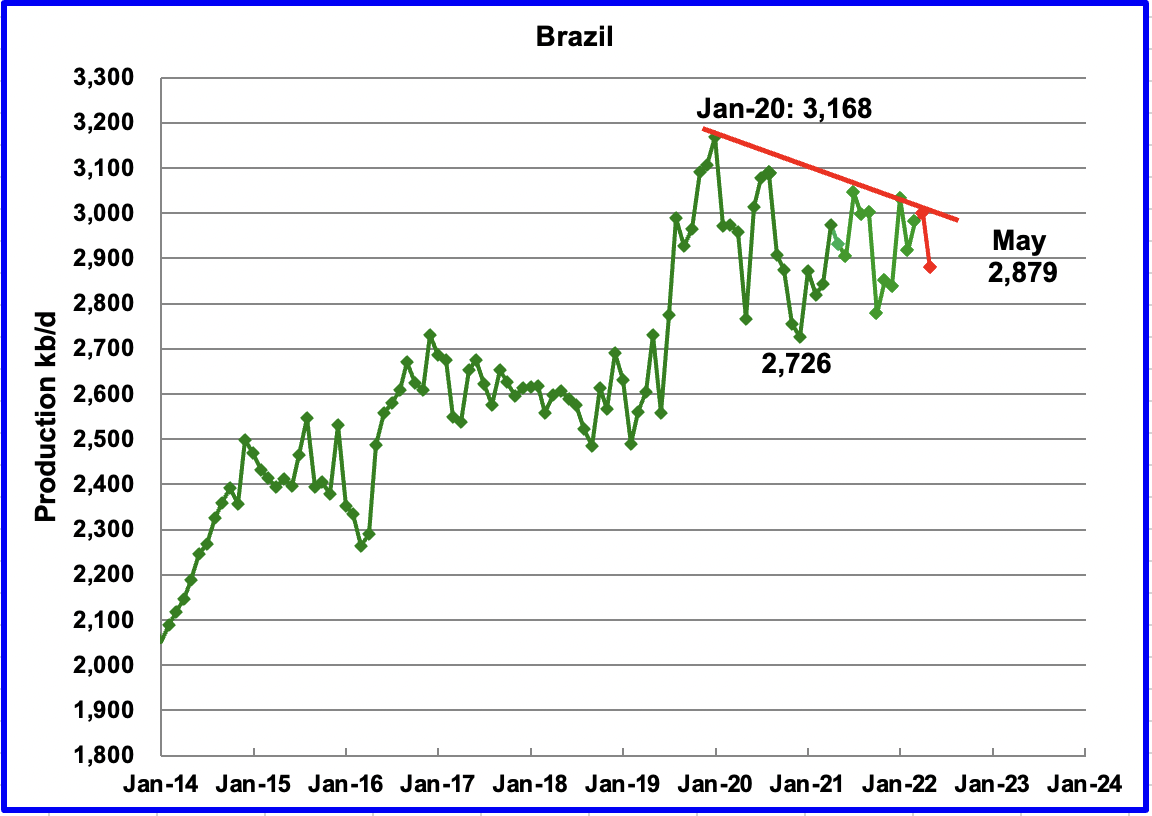
Brazil’s National Petroleum Association reported that May’s output decreased by 120 kb/d to 2,879 kb/d, reversing April’s small increase. (Red Markers).
The chart indicates that Brazil continues to experience difficulties in increasing its monthly output. However, according to OPEC, the main growth in 2022 will be driven by the continued ramp-up of the Sepia field, which came online in August 2021, along with two start-ups of Mero 1 and Peregrino Phase 2 in the pre-salt Santos basin. Connection activities at the Mero oilfield – the third-largest field in Brazil’s pre-salt regions after Buzios and Tupi – have finished and the Petrobras-operated Guanabara Floating Production Storage and Offloading (FPSO) vessel saw first oil in May.
While first oil from the Guanabara FPSO was expected in May, it did not show up in the latest report. The decline from January 2020 to April 2022, red line, may reflect the natural decline of the offshore fields. The red line decline rate is close to 80 kb/d/yr, or roughly 2.5%.
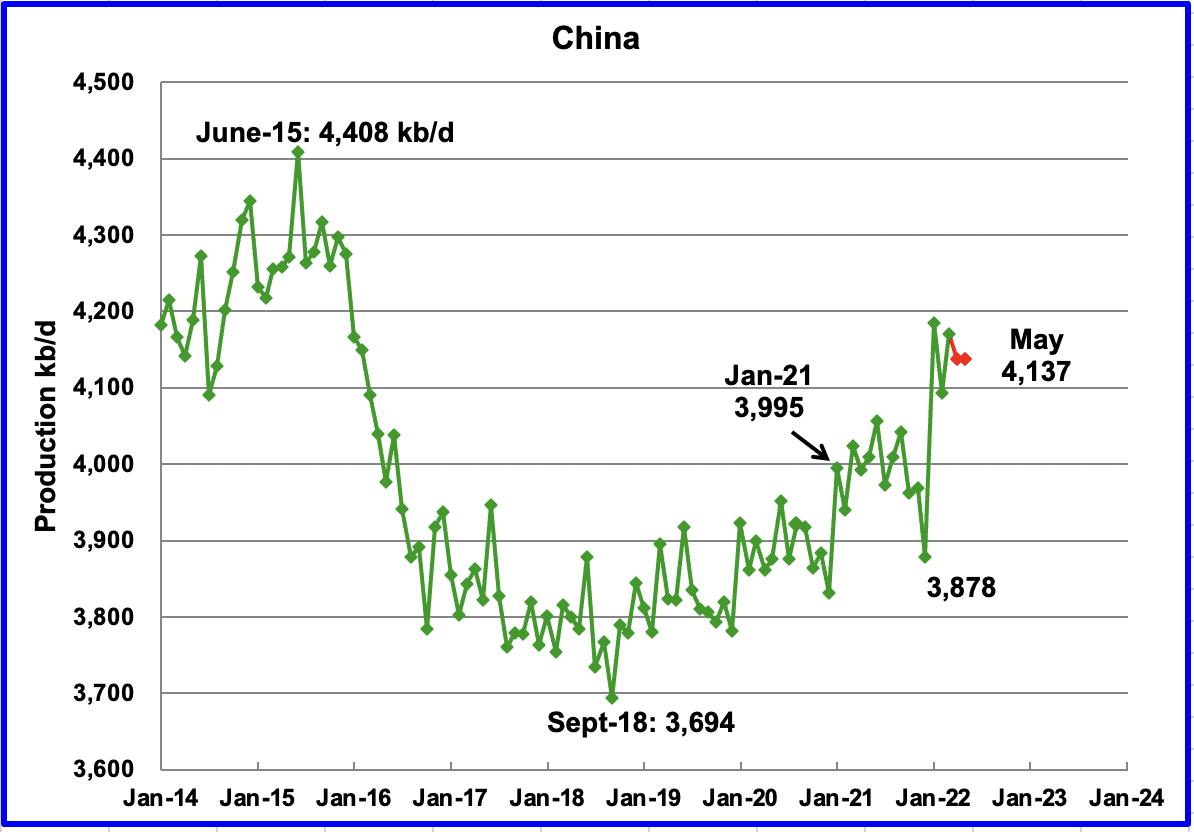
China reported that its May output was unchanged at 4,137 kb/d. (Red markers).
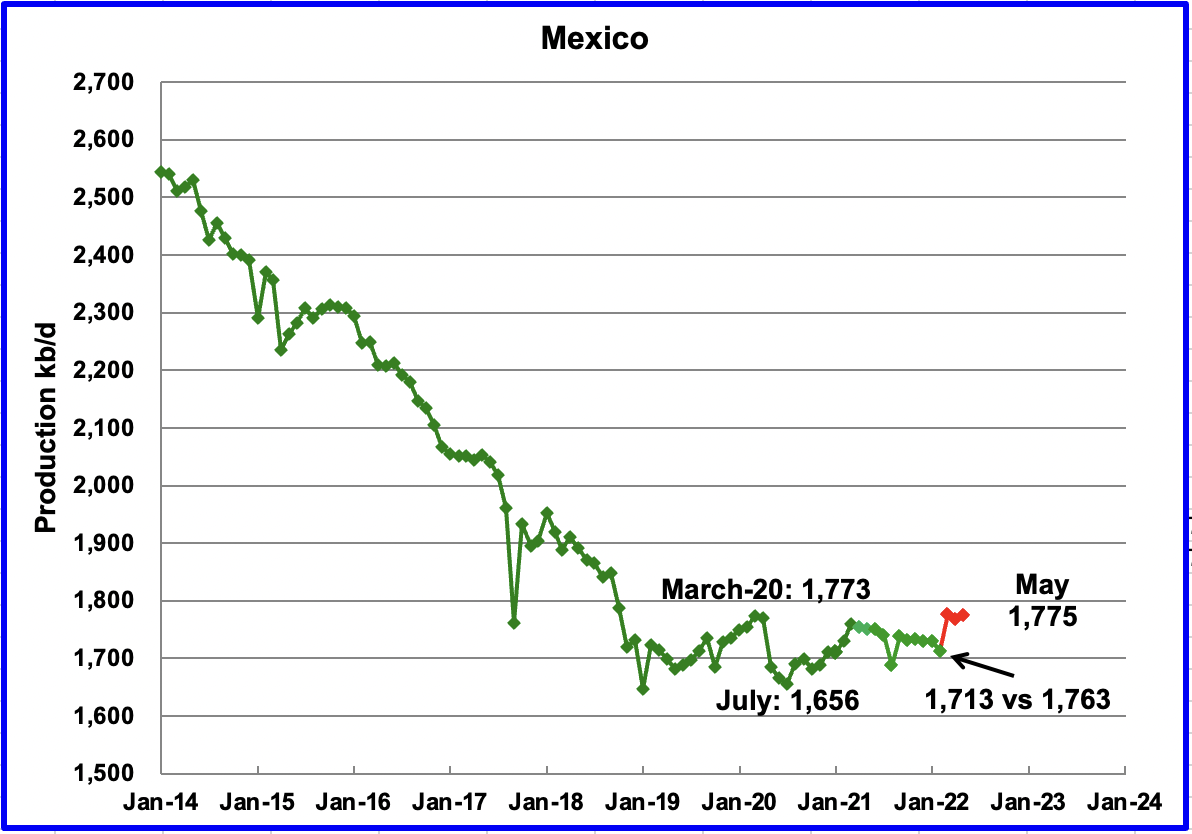
Pemex reported that May production increased by 8 kb/d to 1,775 kb/d. Red markers. Note the EIA reduces the Pemex production numbers by close to 50 kb/d. Green markers. The EIA reduced Pemex’s February output by 50 kb/d, 1,763 kb/d to 1,713 kb/d.
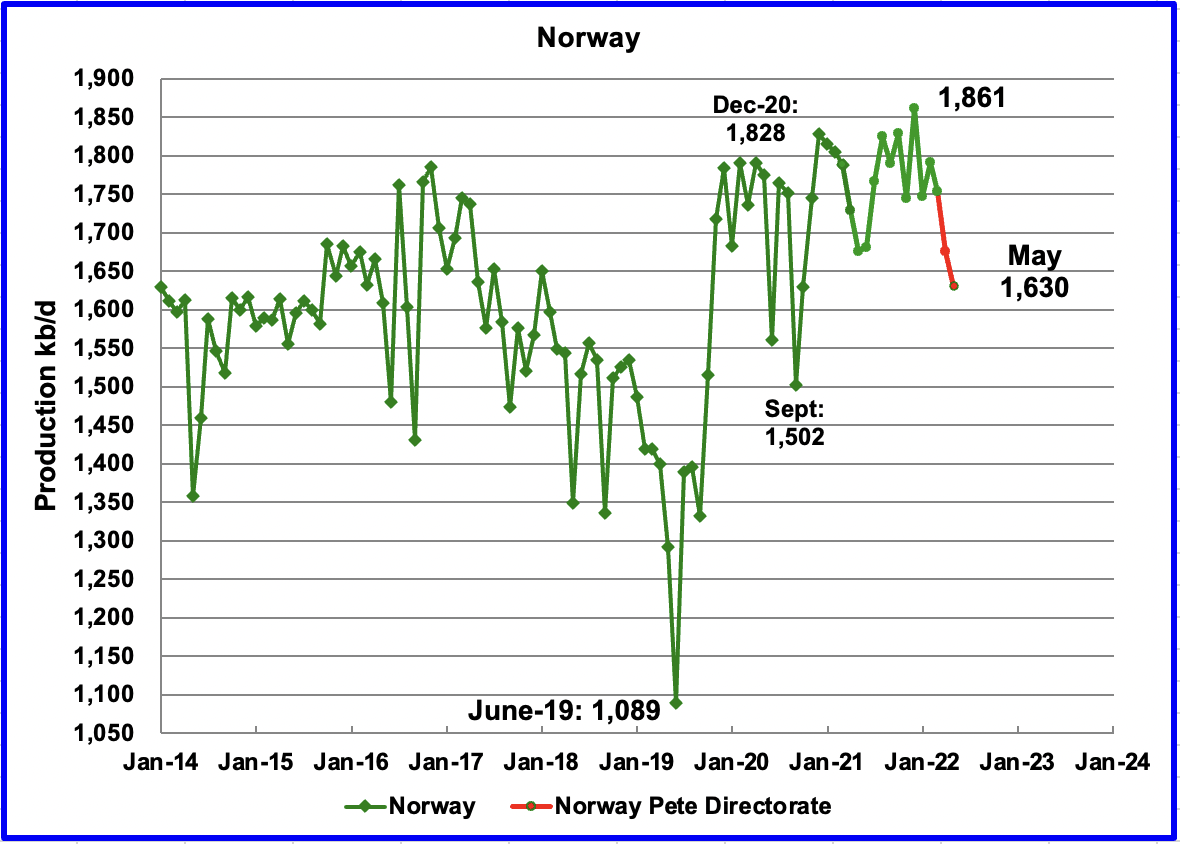
The Norway Petroleum Directorate (NPD) reported that production decreased in May to 1,630 kb/d. (Red markers.). According to the NPD: Oil production in May was 2.4% lower than the NPD’s forecast and 4.8% lower than the forecast so far this year.”
According to OPEC, the May production drop was due to early maintenance. However, OPEC notes that following the end of the maintenance season, growth is expected in 4Q22, when the second phase of the Johan Sverdrup field development starts production, adding around 220 kb/d on top of the 535 kb/d already being produced.
Non-OPEC W/O US
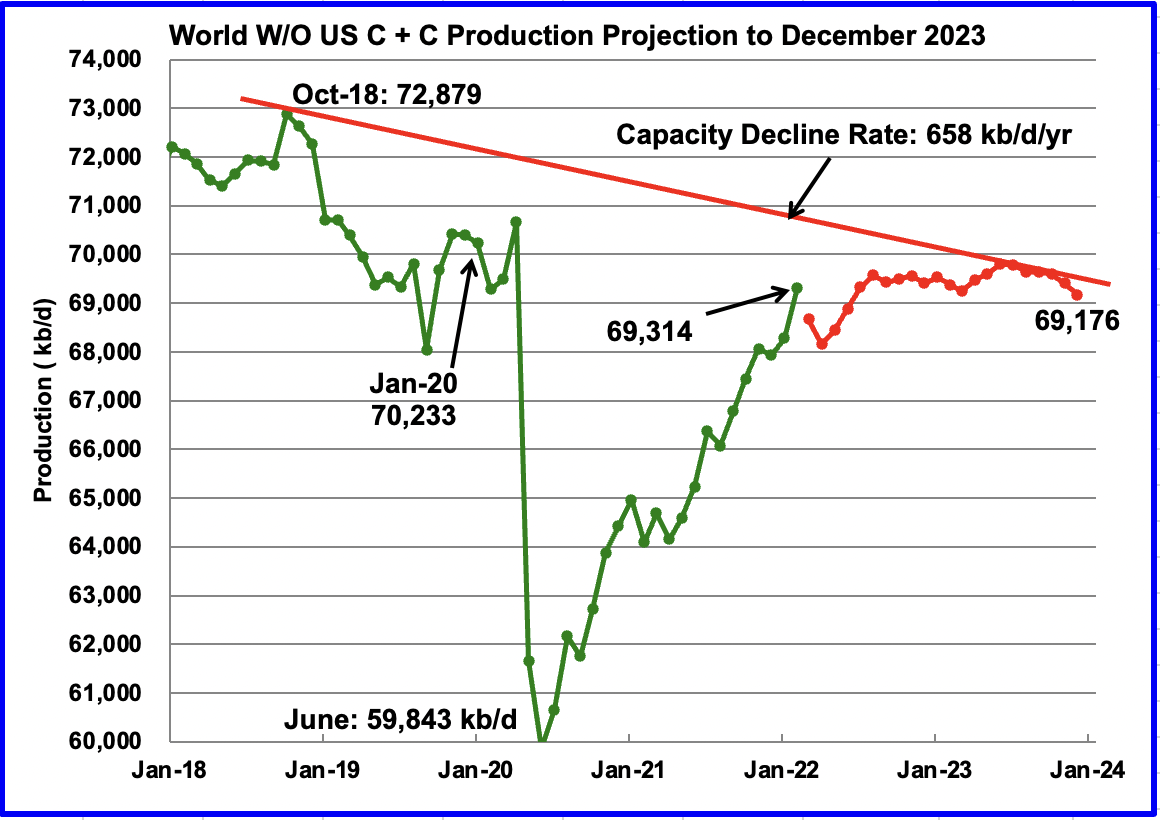
World W/O US oil production increased by 1,033 kb/d to 69,314 kb/d in February 2022 according to the EIA.
This chart also projects world production without the US to December 2023. It uses the June 2022 STEO report along with the February International Energy Statistics to make the projection. (Red markers). It projects that World crude production W/O US in December 2023 will be close to 69,176 kb/d, 500 kb/d higher than reported last month. Note this projection estimates that World Output W/O US will be essential flat for the next two years since the December 2023 output is less than February’s 69,314 kb/d. In other words, starting in February 2022, World oil production without the US will be close to 3,700 kb/d lower than in October 2018.
The essentially flat output also means that any increase in World oil demand will have to be provided by the US over the next two years. According to thissource, the US Permian will be up to the challenge.
Note that the chart also shows a Capacity Decline Rate line of close to 658 kb/d/yr over the years 2018 to 2023. Capacity decline encompasses natural decline and decline associated with reduced investment for drilling and exploration.
Saudi Arabia Closing Stocks
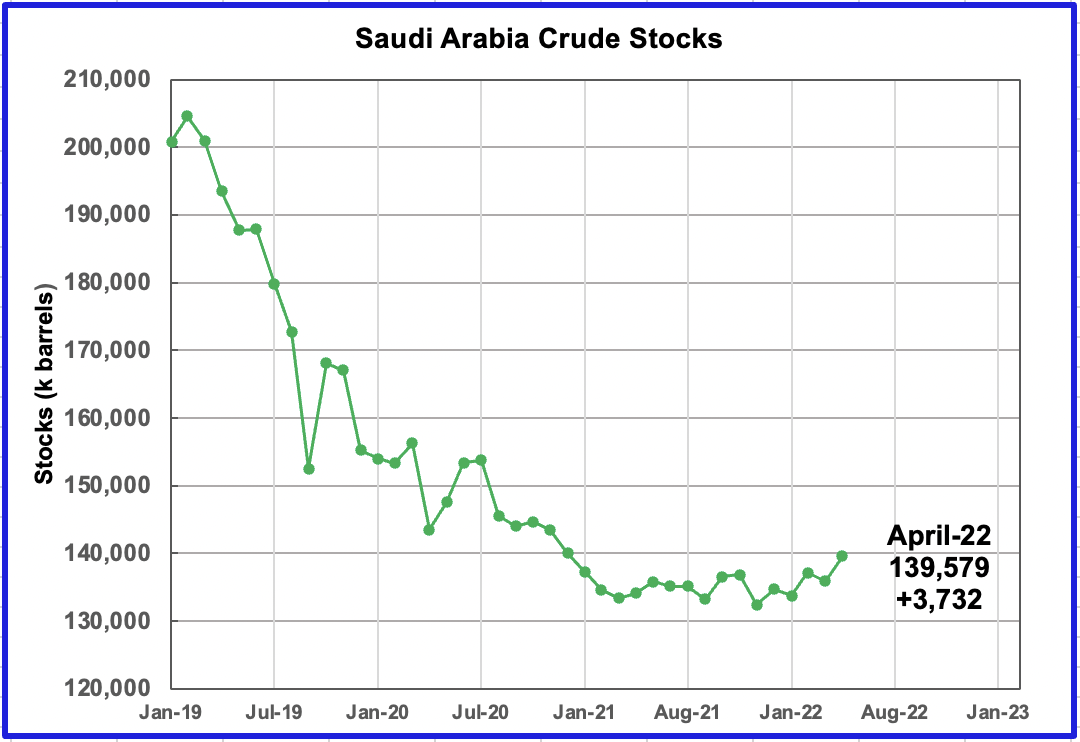
Saudi Arabia, in addition to increasing its monthly output by 115 kb/d, is also increasing its stocks. In April, stocks increased by 3,732 kb or 124.4 kb/d.
321 Refinery Crack Spread
The 321 crack spread is a measure of a refinery’s potential profit margin. It was developed many years ago because a barrel of WTI crude produced roughly 2 barrels of gasoline and one barrel of diesel. This prompted many market participants/specialists to concentrate on 3:2:1 crack spreads, i.e. three crude oil futures contracts versus two gasoline futures contracts and one ULSD futures contract. However, a more recent source notes that they now also look at the 2-1-1 crack spread — the difference between the cost of two barrels of crude and the sum of one barrel of gasoline and one barrel of diesel — because that one-to-one gasoline-to-diesel output ratio is often a little closer to reality these days.
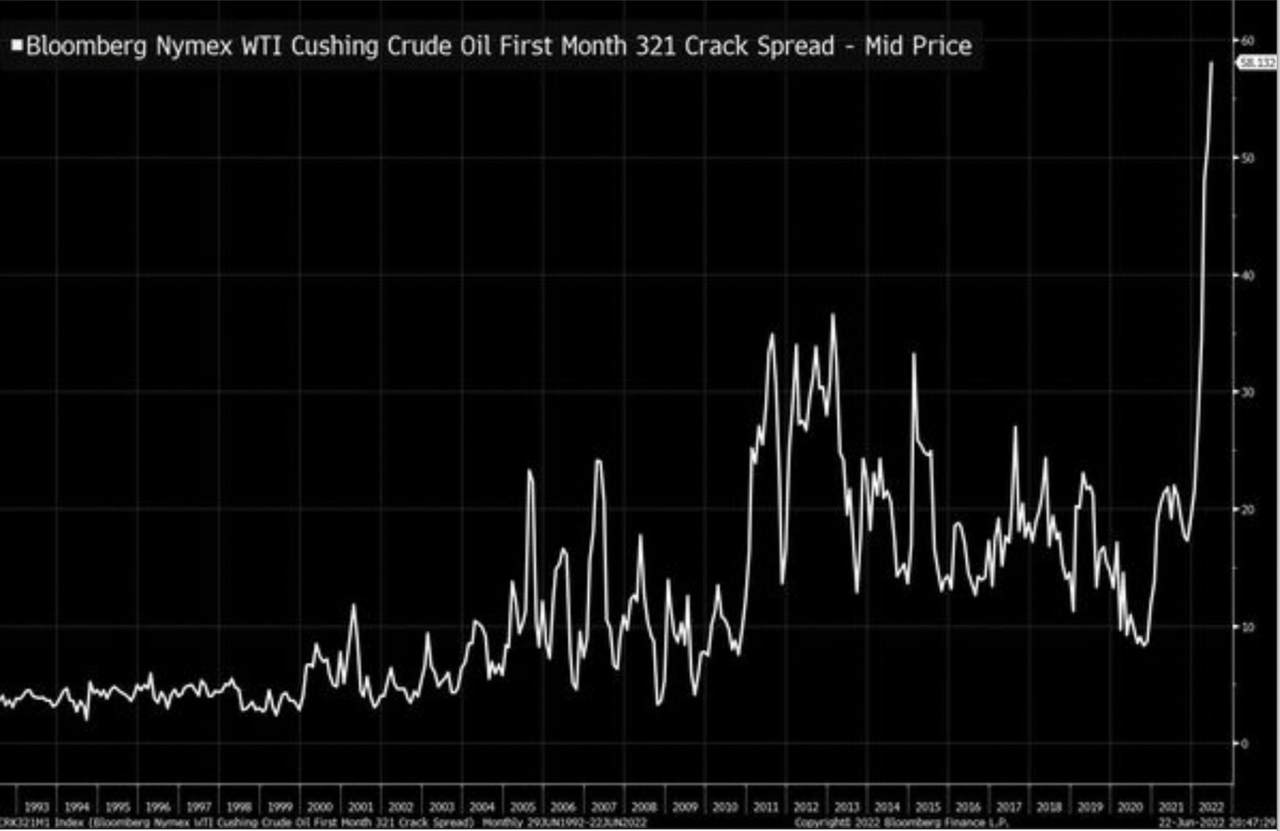
As can be seen from this chart, the 321 crack spread margin between 2011 and early 2022 varied between $20/b and $35/b. However, this crack spread has recently blown out to $58/b as shown in this chart.
Using the June 24 settled prices for gasoline at $3.8848/gal, heating oil at 4.3629/gal and WTI at 107.62/b, the 321 barrel price is $169.86/b. The crack spread margin using this info is $62.24/b. Note that heating oil was used as proxy for ULSD, which is supposed to be used. If ULSD is more expensive than heating oil, the crack spread margin would be lower.
The point of this chart is to try to shed some light on the recent high prices for gasoline in the US. The high gasoline prices must reflect a high demand low supply market condition. One must assume that with the recent margin increase of $25/b to $30/b since the beginning of the year, refiners don’t have to compete to sell their products since they can sell all they produce. The extra $25 margin means that refiners are currently making an extra 60¢/gal over say late 2021 sales.
Appreciate that I am not a refinery expert. Just did a bit of reading, scratched some numbers on a piece of paper in hopes of generating some intelligent discussion, which is what participants on this board do. Better informed comments would be appreciated.
Editor’s Note: The summary bullets for this article were chosen by Seeking Alpha editors.
Be the first to comment