

Eaton Corporation Stock: A Good Investment At The Right Price JHVEPhoto
Eaton (NYSE:ETN) is a diversified industrial giant that focuses on various electrical components and power management. Eaton offers wide ranging solutions that serves end markets ranging from residential, industrial facilities, machinery, data centers and cloud infrastructure, utilities, military and commercial aerospace, as well as ICE and electric vehicles.
Eaton’s solutions allow their customers to manage power and electric delivery. Eaton provides both the raw goods, such as various wiring devices, circuit protection, sensors, valves and other power delivery hardware as well as software solutions that allow customers to manage and monitor efficiencies in their systems.
While Eaton is diversified across end markets, they are also geographically diversified with customers from 170 countries around the world.
Eaton employs a heavy dose of both M&A activity to continue to push the company forward. Throughout FY 2021 and FY 2022 there’s been 7 acquisitions as well as the divestiture of their hydraulics segment.
Dividend History
As a dividend growth investor, I seek out companies that have a history of both paying and growing their dividend over time. A rising dividend is one of the best signs that management of the business expects the business to continue to execute.
ETN Dividend History (ETN Investor Relations)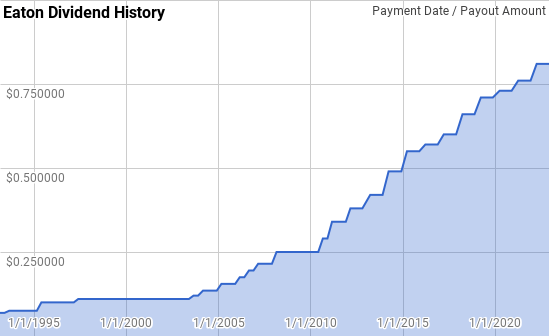
Eaton is a Dividend Contender with 13 consecutive years of dividend growth. Eaton’s dividend growth history has been lumpy and intermittent at times with a pause in dividend growth in 2009 as well as from 1999 through 2002. However, over time, Eaton has rewarded shareholders with raises.
Dating back to 1993 Eaton’s year over year dividend growth has ranged from 0.0% to 25.9% with an average of 8.9% and a median of 7.5%.
There’s also been 25 rolling 5-year periods over that time with annualized dividend growth coming between 0.5% to 16.8% with an average of 8.9% and a median of 9.5%.
During that same period there’s been 20 rolling 10-year periods with Eaton’s annualized dividend growth spanning from 4.8% to 13.8% with an average of 9.6% and a median of 9.8%.
The rolling 1-, 3-, 5- and 10-year annualized dividend growth rates from Eaton since 1993 can be found in the following table.
| Year | Annual Dividend | 1 Year | 3 Year | 5 Year | 10 Year |
| 1993 | $0.2876 | ||||
| 1994 | $0.3000 | 4.31% | |||
| 1995 | $0.3750 | 25.00% | |||
| 1996 | $0.4000 | 6.67% | 11.62% | ||
| 1997 | $0.4300 | 7.50% | 12.75% | ||
| 1998 | $0.4400 | 2.33% | 5.47% | 8.88% | |
| 1999 | $0.4400 | 0.00% | 3.23% | 7.96% | |
| 2000 | $0.4400 | 0.00% | 0.77% | 3.25% | |
| 2001 | $0.4400 | 0.00% | 0.00% | 1.92% | |
| 2002 | $0.4400 | 0.00% | 0.00% | 0.46% | |
| 2003 | $0.4600 | 4.55% | 1.49% | 0.89% | 4.81% |
| 2004 | $0.5400 | 17.39% | 7.06% | 4.18% | 6.05% |
| 2005 | $0.6200 | 14.81% | 12.11% | 7.10% | 5.16% |
| 2006 | $0.7400 | 19.35% | 17.17% | 10.96% | 6.35% |
| 2007 | $0.8600 | 16.22% | 16.78% | 14.34% | 7.18% |
| 2008 | $1.0000 | 16.28% | 17.27% | 16.80% | 8.56% |
| 2009 | $1.0000 | 0.00% | 10.56% | 13.12% | 8.56% |
| 2010 | $1.0800 | 8.00% | 7.89% | 11.74% | 9.39% |
| 2011 | $1.3600 | 25.93% | 10.79% | 12.94% | 11.95% |
| 2012 | $1.5200 | 11.76% | 14.98% | 12.06% | 13.20% |
| 2013 | $1.6800 | 10.53% | 15.87% | 10.93% | 13.83% |
| 2014 | $1.9600 | 16.67% | 12.96% | 14.41% | 13.76% |
| 2015 | $2.2000 | 12.24% | 13.12% | 15.29% | 13.50% |
| 2016 | $2.2800 | 3.64% | 10.72% | 10.89% | 11.91% |
| 2017 | $2.4000 | 5.26% | 6.98% | 9.57% | 10.81% |
| 2018 | $2.6400 | 10.00% | 6.27% | 9.46% | 10.19% |
| 2019 | $2.8400 | 7.58% | 7.60% | 7.70% | 11.00% |
| 2020 | $2.9200 | 2.82% | 6.76% | 5.83% | 10.46% |
| 2021 | $3.0400 | 4.11% | 4.81% | 5.92% | 8.38% |
| 2022 | $3.2400 | 6.58% | 4.49% | 6.19% | 7.86% |
Source: Author; Data Source: Eaton Corporation Investor Relations
The dividend payout ratio allows investors to see how much of the earnings or free cash flow a business has committed to paying their dividend. Additionally it lets you know how much excess capacity there is before the business is not earning enough to cover their dividend because inevitably tough economic times will fall on the broader economy or due to company specific issues.
ETN Dividend Payout Ratios (ETN SEC filings)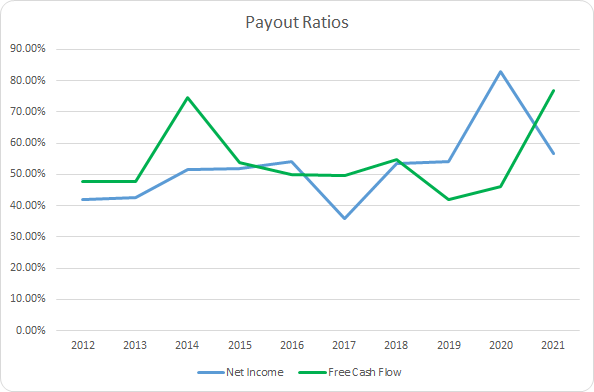
Eaton’s dividend payout ratios have been quite steady during the last decade. The 10-year average net income payout ratio is 52.5% with the 5-year average at 56.7%. Similarly, the average free cash flow payout ratios are 54.3% and 53.9%, respectively.
Quantitative Quality
When looking for potential investments I track the business over time to see how it has performed historically. I target businesses that can continue to grow by expanding into new potential markets or services. Over the long term, returns will track along with the performance of the business. As such I examine a variety of financial metrics to get a feel for the business.
ETN Revenue Profits and Cash Flow (ETN SEC filings)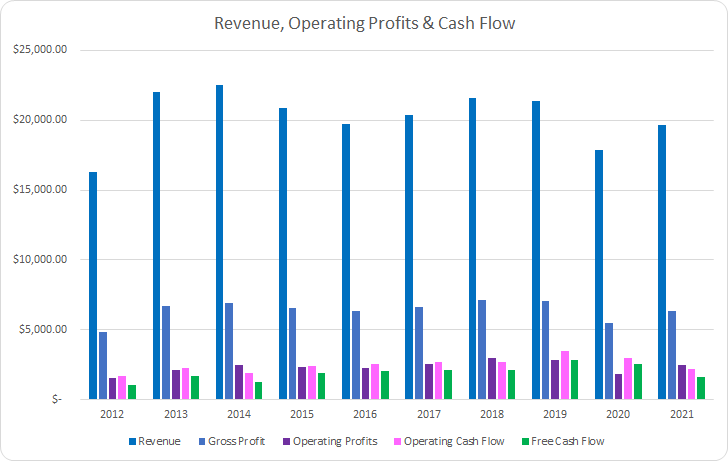
Eaton’s business is cyclical in nature which plays out in their financials. Over the last decade, revenues grew just 20.3% in total or 2.1% annually. Gross profits fared better showing a 30.3% increase or 3.0% annualized growth rate.
Operating profits improved by 61.0% over that time or 5.4% annualized; although operating cash flow tracked along with gross profits rising 30.0% in total or 3.0% annually. Free cash flow increased by 48.3% or 4.5% annualized as well.
Good businesses should be able to survive competitors’ attempts to take aim at their business. That’s evidenced by improving margins over time. I prefer to see a free cash flow margin greater than 10%; however, I place more weight on the trajectory of margins over time.
ETN Margins (ETN SEC filings)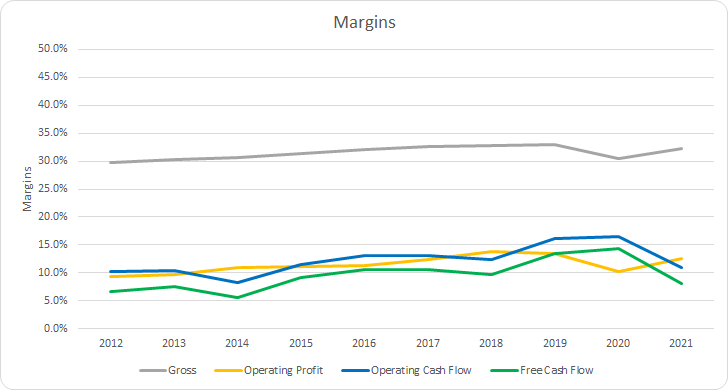
Surprisingly, Eaton’s margins have been on the rise despite the lackluster top line growth over the last decade suggesting that Eaton is making improvements through operational efficiency. The 10-year average free cash flow margin for Eaton is 9.5% with the 5-year average at 11.2%.
Additionally, I track how efficient the business is at using its asset and capital base in order to generate free cash flow. The free cash flow return on invested capital, FCF ROIC, is my preferred metric here and I want to see improving levels over time that are preferably well above 10%.
ETN Free Cash Flow Returns (ETN SEC filings)
Eaton has shown solid improvement in their FCF ROIC during the last decade; however, they have only surpassed the 10% level in two of the last ten years. The 10-year average FCF ROIC for Eaton is 7.9% with the 5-year average at 9.6%.
To understand how Eaton uses its free cash flow, I calculate three variations of the metric, defined below:
- Free Cash Flow, FCF: Operating cash flow less capital expenditures
- Free Cash Flow after Dividend, FCFaD: FCF less total cash dividend payments
- Free Cash Flow after Dividend and Buybacks, FCFaDB: FCFaD less net cash used on share repurchases
ETN Free Cash Flows (ETN SEC filings)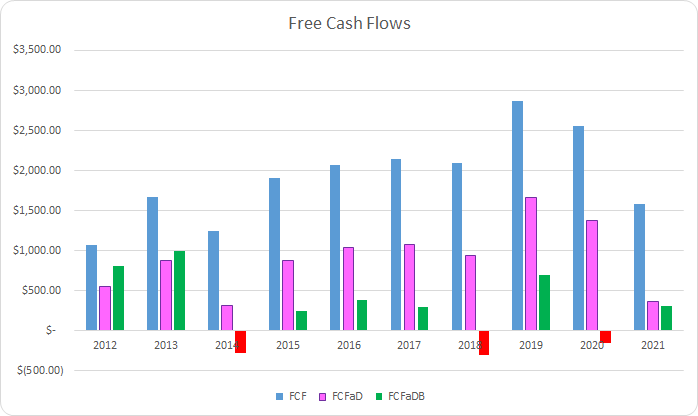
Despite its ups and downs in free cash flow, Eaton has generated a total of $19.2 B in FCF during the last decade. Over that time they have paid a dividend that’s grown each year sending out a total of $10.1 B to shareholders. That puts the cumulative FCFaD for that time at $9.1 B.
Additionally, Eaton has spent a net total of $6.1 B in repurchasing shares. That brings the cumulative FCFaDB for that period at $3.0 B.
Eaton has preferred dividends to share buybacks as a means to return cash to owners although they have employed both methods. Comparing the cumulative totals over the last decade, Eaton has sent roughly $1.66 to shareholders via dividends for every net $1.00 used on repurchases.
ETN Shares Outstanding (ETN SEC filings)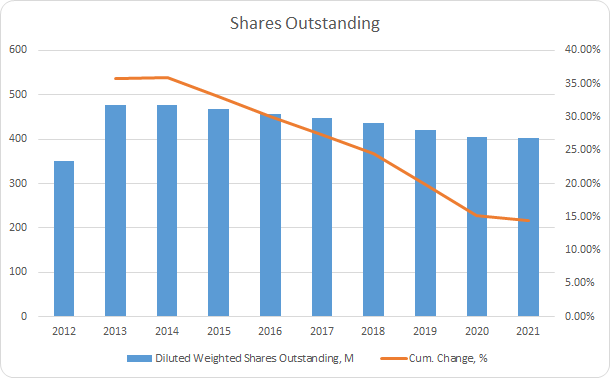
Eaton’s share count had roughly a 35.9% increase in FY 2013 compared to FY 2012 due to the Cooper Industries acquisition which has been a big headwind towards total share reduction. In total the share count rose by 14.4% between FY 2012 and FY 2021 representing a 1.5% annualized increase. However, between FY 2013 and FY 2021 the share count fell by 15.8% in total or a 2.1% annualized reduction.
ETN Debt to Capitalization (ETN SEC filings)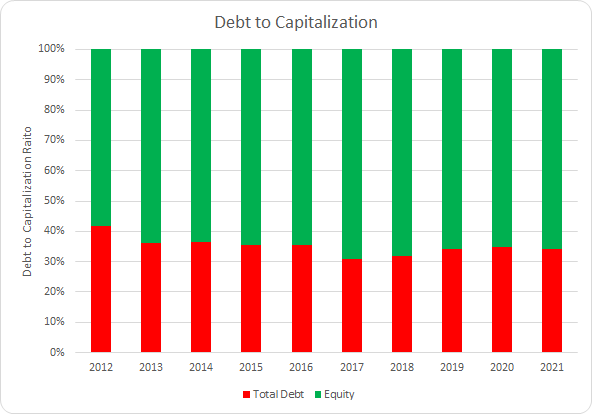
Eaton’s capital structure has largely been stable over the last decade with the debt-to-capitalization ratio improving slightly over that time. The 10-year average debt-to-capitalization ratio for Eaton is 35% with the 5-year average at 33%.
The net debt ratios give more insight into the burden of debt placed upon the underlying profits and cash flows. The net debt ratios examine the net debt position compared to some measure of cash flow and let you know how quickly the business could de-lever if need be.
ETN Debt Ratios (ETN SEC filings)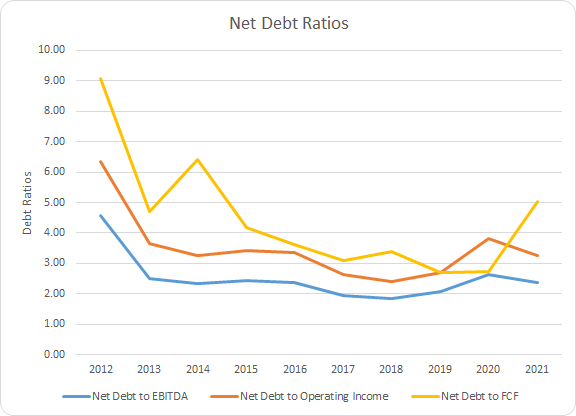
Eaton’s debt ratios appear, for the most part, to be manageable. The 10-year average net debt-to-EBITDA, net debt-to-operating income, and net debt-to-FCF ratios are 2.5x, 3.5x, and 4.5x respectively. Eaton’s 5-year averages are 2.2x, 3.0x, and 3.5x, accordingly.
How Did We Get Here?
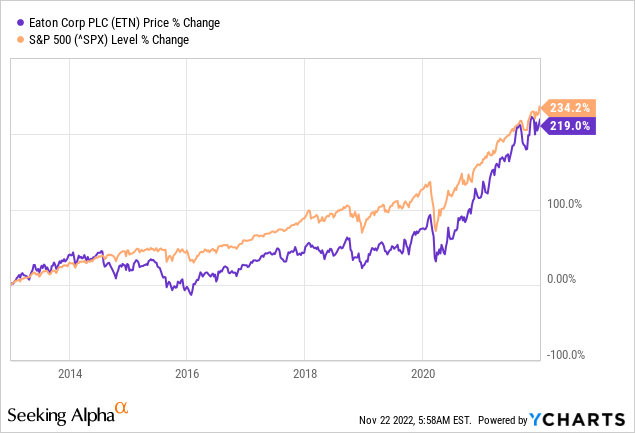
Eaton’s share price rose from $54.18 to $172.82 between the end of FY 2012 and the end of FY 2021. That works out to a 12.3% annualized growth rate in Eaton’s share price. Add in the 2.8% dividend yield from the beginning of that period and Eaton’s CAGR is around 15.1% over that time.
Compared to the S&P 500’s 234.2% cumulative gain or 14.3% annualized increase over that period that is a pretty solid result for Eaton. However, we Eaton’s comparable performance hasn’t exactly been steady. Until roughly mid-2014 Eaton tracked along with the S&P 500 although from mid-2014 until late in 2021 Eaton had well underperformed compared to the S&P 500.
Over time the returns that investors earn should track the improvement in the business; although valuation can still play a large role. Below I’ve broken down the returns that Eaton has generated into 3 components that should roughly approximate the contribution by segment.
- Business Returns: Measured as the annualized change revenues plus the annualized change in net profit margin
- Capital Allocation Returns: Measured as the initial dividend yield plus the annualized change in shares outstanding
- Sentiment Change: Measured as the annualized change between starting and ending P/E multiple
Eaton’s revenue growth has only accounted for a +2.1% contribution to the CAGR from the end of FY 2012 through the end of FY 2021. Meanwhile, net profit margin rose by 46.2% and was a +4.3% contribution to returns. In total the business return attribution for Eaton comes to +6.3%.
As we saw earlier, Eaton’s share count has actually increased during the period by 14.4%. That puts the share change contribution at a 1.5% annualized drag which combined with the initial dividend yield of 2.8% brings the capital allocation return attribution to +1.3%.
Eaton’s P/E multiple rose from 15.6x up to 32.3x during that time which is a 107.5% total increase. That puts the annual contribution from sentiment change at +7.5%.
| Annualized Returns | % of Returns | |
| Business Returns | 6.3% | 42% |
| Capital Allocation Returns | 1.3% | 9% |
| Sentiment Change | 7.5% | 50% |
| Total Annualized Returns | 15.1% |
Source: Author
While Eaton has slightly underperformed the S&P 500 over that time, Eaton’s results are far from encouraging. Combined the business and capital allocation returns accounted for a +7.6% annualized return or around 50% of the returns investors earned. Meanwhile, sentiment change accounted for the remaining 50% of returns which doesn’t exactly appear sustainable given the overall modest returns from the core segments.
One thing to note is that there is some noise in the reported EPS numbers due to the various acquisitions and divestitures Eaton has undertaken over that time. For FY 2021 adjusted EPS was $6.62 and for FY 2012 they were $3.94. However, since we see these adjustments in most of the years that begs the question of whether the adjustments are truly worth backing out.
| *Adjusted EPS | Annualized Returns | % of Returns |
| Business Returns | 7.3% | 48% |
| Capital Allocation Returns | 1.3% | 9% |
| Sentiment Change | 6.5% | 43% |
| Total Annualized Returns | 15.1% |
Source: Author
Using the adjusted numbers the return breakdown shows that Eaton’s business and capital allocation returns accounted for +8.6% of the returns or around 57% of the CAGR over that time. Sentiment change still came in at a +6.5% contribution or 43% of the annualized returns.
ETN Return Breakdown (Author)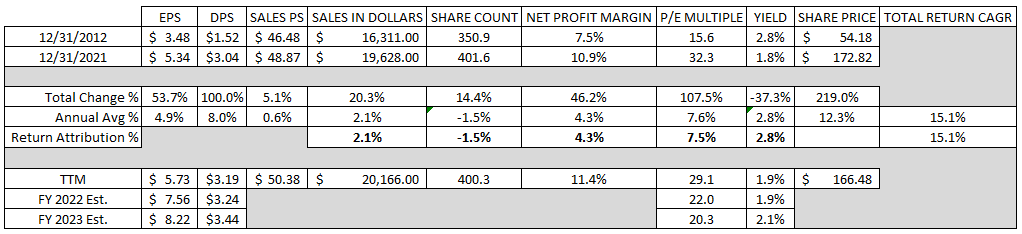
Looking ahead the question becomes whether you think sales and profits will continue to improve over time. The current sentiment doesn’t appear too excessive at around a 22.0x multiple based on FY 2022 estimates and 20.3x FY 2023 estimates. Although the dividend yield is currently only around 1.9%.
Valuation
While identifying a good business is part of the battle the other equally important part is finding an attractive entry point from which to purchase shares. I utilize three valuation methods that attempt to value the business through different lenses to determine what I would consider to be attractive purchase levels.
Dividend yield theory is a valuation concept that’s based around reversion to the mean. It operates under the assumption that over time investors will value a business such that it offers a dividend yield that fluctuates around a longer-term average. Given the cyclical nature in Eaton’s business, I’ve opted for the 5-year average forward dividend yield as a proxy for fair value.
Eaton Dividend Yield Theory (ETN Investor Relations and Google Finance)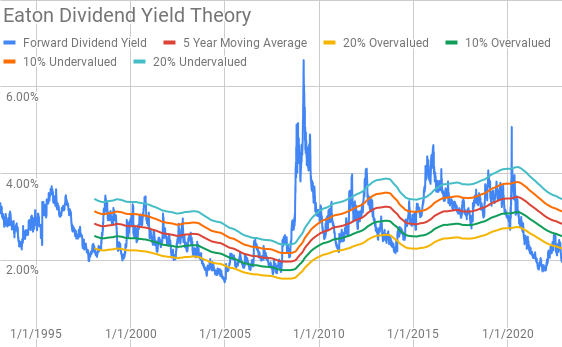
Eaton’s dividend yield has seen some large fluctuations over time as expected by a more economic activity sensitive business. Although for the most part Eaton’s shares have offered an initial yield that’s ranged between around 2.0% to the high 3.0% area. Eaton currently offers a forward dividend yield of 1.95% compared to the 5-year average forward yield of 2.84% and is sitting well below the 20% overvalued yield band.
A reverse discounted cash flow analysis can be used to decipher what kind of growth and margins a business must maintain in order to generate the free cash flows that would justify the current market valuation. In other words it can be used to find out what you need to believe the underlying business will be able do in the future in order to generate the returns that you seek.
I use a simplified DCF model built on revenue growth, an initial free cash flow margin of 12.3% that improves to 14.0% during the forecast period and a terminal growth rate of 2.5%.
For the discount rate I’ve used an estimated 2.1% after-tax cost of debt with an estimated cost of equity of 10%, 8% and a 8.9% which is derived from the dividend capitalization method. That yields a discount rate of 9.1%, 7.3%, and 8.2%, respectively.
With the 9.1% discount rate scenario, Eaton needs to grow revenues 11.1% annually during the forecast period in order to generate the cash flows that would support the current market valuation. At the 7.3% discount rate, 8% cost of equity, revenue growth needs to reach 6.0% annualized during the forecast period. Based on the 8.2% discount rate from the dividend capitalization method the required revenue growth is still a lofty 8.5% annualized rate.
The MARR analysis requires you to estimate the future earnings and dividends that a business will produce. You then apply a reasonable expected terminal multiple on those future earnings to determine an expected future share price. Afterwards you calculate the expected return and if it’s greater than your threshold for investment you can feel proceed with investing in the business.
Analysts currently expect Eaton to have FY 2022 EPS of $7.56 and FY 2023 EPS of $8.24. They also expect Eaton to be able to grow EPS at a 10.1% rate over the next 5 years. I then assumed that earnings growth would slow to 4.0% annually for the following 5 year period. Dividends are assumed to target a 42% payout ratio.
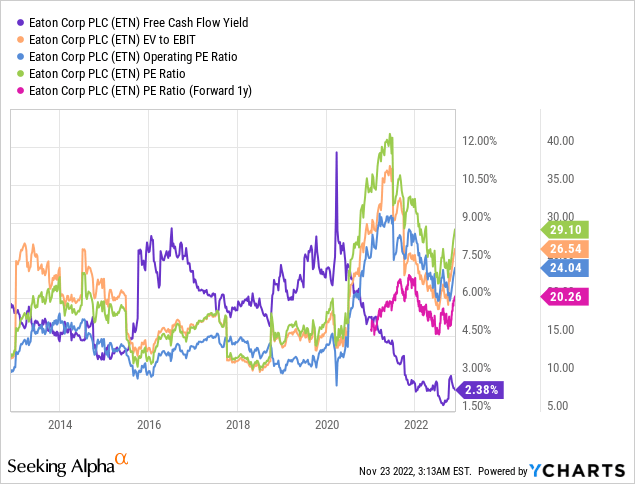
The following YChart shows how investors have valued Eaton across a variety of metrics over the last decade. Based on the TTM P/E ratio Eaton has typically been valued between ~10x and ~25x. For the MARR analysis I’ll examine terminal multiples that span that range.
The following table shows the potential internal rates of return that investors in Eaton could earn provided the assumptions laid out above prove to be realistic expectations of the future. Returns assume shares are purchased at $166.48, Tuesday’s closing price. Returns also assume that dividends are taken in cash and are paid and raised along the timeline that Eaton has typically followed.
| IRR | ||
| P/E Level | 5 Year | 10 Year |
| 25 | 13.2% | 9.6% |
| 22.5 | 11.0% | 8.6% |
| 20 | 8.6% | 7.5% |
| 17.5 | 5.9% | 6.2% |
| 15 | 2.9% | 4.8% |
| 10 | -4.4% | 1.3% |
Source: Author
Additionally, I use the MARR analysis structure to determine the maximum price I could pay for shares today, based on the above assumptions, in order to generate the returns that I desire from my investments. My base hurdle rate is a 10% IRR and for Eaton I’ll also examine 12% and 8% return marks.
| Purchase Price Targets | ||||||
| 10% Return Target | 12% Return Target | 8% Return Target | ||||
| P/E Level | 5 Year | 10 Year | 5 Year | 10 Year | 5 Year | 10 Year |
| 25 | $197 | $166 | $181 | $141 | $214 | $195 |
| 22.5 | $179 | $152 | $164 | $130 | $194 | $179 |
| 20 | $161 | $138 | $148 | $119 | $175 | $163 |
| 17.5 | $142 | $125 | $131 | $107 | $155 | $146 |
| 15 | $124 | $111 | $115 | $96 | $135 | $130 |
| 10 | $88 | $84 | $82 | $73 | $96 | $97 |
Source: Author
Conclusion
Eaton is a solid business with operations that touch on several strong growth drivers related to all things electricity. The last decade has been one of constant flux with numerous acquisitions as well as divestitures which muddies the financials over that period.
Growth has been pretty lackluster during that time with sales increasing just 2.1% annually between FY 2012 and FY 2021. Eaton also doesn’t sustain stable free cash flow margins although the trend over that time has been towards higher levels. We see similar results with Eaton’s free cash flow return metrics where they historically haven’t been that impressive but they have been rising.
Dividend yield theory suggests a fair value range for Eaton between $104 and $127. At a current share price around $166 shares are significantly overvalued.
Additionally the reverse discounted cash flow analysis suggests that expectations are quite elevated at current levels. Based on the current market valuation Eaton’s required revenue growth ranges between 6.0% to 11.1% depending on the discount rate. Better than expected margin improvement would help on that front.
One thing to note is that Eaton has been quite aggressive with buybacks. Between the end of FY 2013 and FY 2021 Eaton’s share count has fallen at a 2.1% annualized rate. On a per share basis, buybacks would help lower the required revenue growth rate which based on the 3-year average FCFaD Eaton could repurchase around 1.4% of outstanding shares.
Additionally, the MARR analysis suggests a fair value range from $124 to $161 based on the 10% return target five years down the line with a terminal multiple between 15x and 20x. At a 12% IRR target the fair value range drops to $115 to $148, but with the 8% IRR target it rises to $135 to $175.
Eaton’s 3Q earnings release earlier this month showed continued execution and encouraging results. Compared to Q3 FY 2021 organic sales growth was +15% although due to FX -4% headwind as well as the -3% dip from divestitures total sales growth came in at 8% year over year.
Many companies are seeing strong sales growth due to increased pricing, but are seeing operating margins be squeezed due to their own internal inflation via COGS and rising operating expenses. However, Eaton has bucked that trend with operating margins showing healthy improvement. Eaton’s operating margin rose by 130 bps to 21.2% which is an all time high operating margin for Eaton.
ETN 3Q Earnings Presentation Highlights (ETN 3Q Earnings Presentation )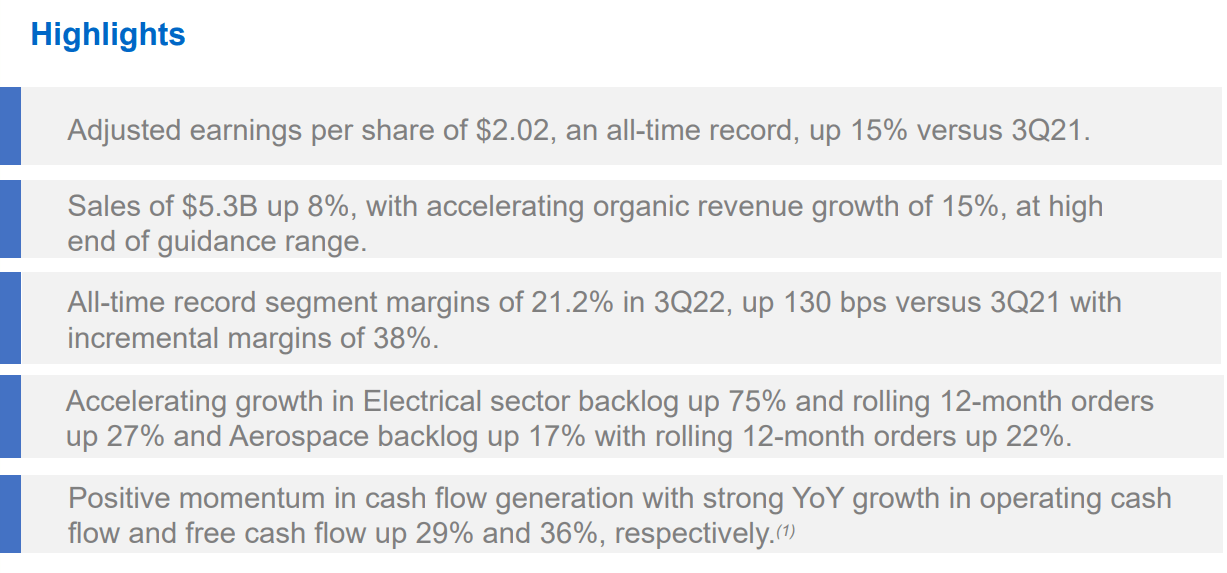
Eaton also saw strong growth in their Electrical sector with their backlog rising 75%. That suggests strong demand even in the face of the macro headwinds that have reared their heads throughout much of 2022.
Additionally, Eaton updated their FY 2022 guidance with very impressive expectations. Each operating segment is expected to show 10%+ organic growth. Combined management is expected FY 2022 to show 11-13% organic growth with operating margins between 20.0% to 20.4%.
While management paints a very rosy picture they aren’t exactly backing up that optimism with share purchases. Over the last two years there’s been just two insider purchases totaling to $204k with 42 sells of $62.4 M. That’s not necessarily a red flag; however, it’s far from being a bright green one.
Eaton has a wide exposure to a variety of end markets which Eaton expects strong organic growth across most of the markets. Residential is currently the lone laggard that is expected to show declines; however, that is off just 7% of their expected FY 2022 sales and is more than made up for by the other segments. What’s quite encouraging is the fact that their internal revenue growth forecasts for FY 2023 includes an expected impact from a recession.
ETN 3Q Earnings Presentation 2023 End Markets (ETN 3Q Earnings Presentation)
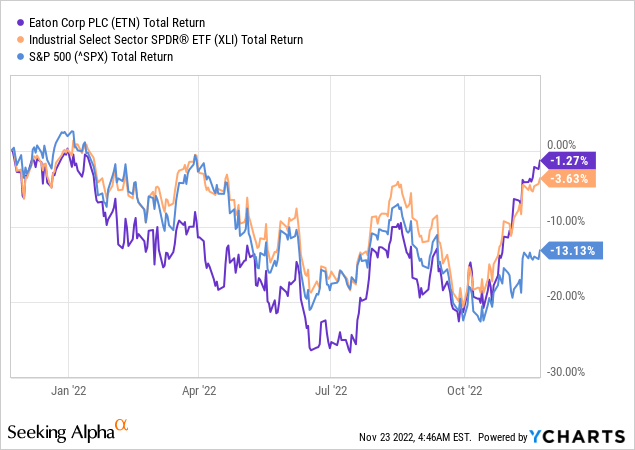
Eaton, as well as the overall industrial sector via (XLI), has vastly outperformed the S&P 500 over the last year and especially so since October. Eaton’s total return is just -1.3% over that time compared to XLI’s -3.6% and the S&P 500’s -13.1%.
Eaton is intriguing as a potential investment given its end markets and potential secular growth trends for its products and services. Of the three valuation models we have one that implies Eaton is significantly overvalued with two showing Eaton is likely somewhere around the upper end of fair value to moderately expensive. For now, I believe that patience is warranted before investing in Eaton and would be interested should the share price pull back below $140.
Be the first to comment