

J2R
Earnings of East West Bancorp, Inc. (NASDAQ:EWBC) are set to surge in future quarters thanks to the rapidly rising interest rates and the moderate-to-high rate sensitivity of the net interest margin. High-single-digit loan growth will further propel earnings. On the other hand, provision normalization will likely restrict earnings growth. Overall, I’m expecting East West Bancorp to report earnings of $7.59 per share for 2022, up 25% year-over-year. Compared to my last report on the company, I’ve revised upwards my earnings estimate partly because I’ve raised my margin estimate. For 2023, I’m expecting earnings to grow by 18% to $8.97 per share. The year-end target price suggests a high upside from the current market price. Therefore, I’m maintaining a buy rating on East West Bancorp.
Rise in Interest Rates to Boost the Margin
One of the biggest catalysts for earnings is the rising rate environment and its impact on East West Bancorp’s net interest margin. After a 300 basis points hike in the fed funds rate this year, the Federal Reserve is projecting further rate hikes of around 125-150 basis points by the end of 2023. According to the results of the management’s interest rate sensitivity simulation given in the 10-Q filing, a 200-basis points hike in interest rate can lift the net interest income by 6.3% over twelve months.
2Q 2022 10-Q Filing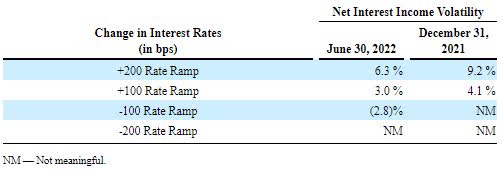
The moderately high rate sensitivity is attributable to variable-rate loans which made up a hefty 63% of total loans, according to details given in the earnings presentation.
2Q 2022 Earnings Presentation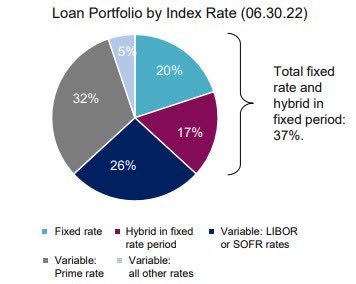
Further, non-interest-bearing demand deposits made up a sizable 42% of total deposits at the end of June 2022. These deposits will make the average deposit cost upward sticky as market interest rates rise.
Considering these factors, I’m expecting the net interest margin to increase by 20 basis points in the second half of 2022 and then by a further 10 basis points in 2023. Compared to my last report on East West Bancorp, I’ve increased my margin estimate as my interest rate outlook is now more hawkish than before.
Loan Growth to Decelerate but Remain High
East West Bancorp’s loan portfolio grew by a whopping 7% in the second quarter of 2022, or 28% annualized, which exceeded my expectations. The company’s loan growth has remained in the high-single-digit to low-double-digit range in the past; therefore, the second quarter’s growth is quite extraordinary. Partly because the second quarter’s performance is above-average, I’m expecting loan growth to decelerate in future quarters. Further, high borrowing costs will dampen credit demand.
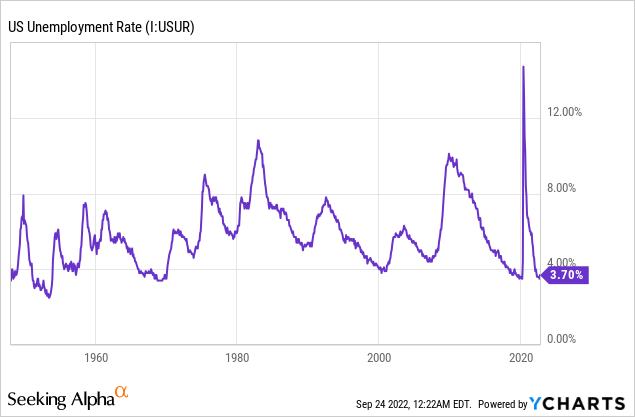
On the other hand, strong job markets will support loan growth. East West Bancorp is geographically well-diversified across the U.S., with limited exposure to China. Therefore, the U.S. unemployment rate is an appropriate gauge of demand for credit products. As shown below, the unemployment rate is near record lows.
The U.S. leading economic index continued to decline for a sixth straight month, which is bad news for loan growth. Fortunately, the decline in August was lower than in previous months, which gives some hope.
The Conference Board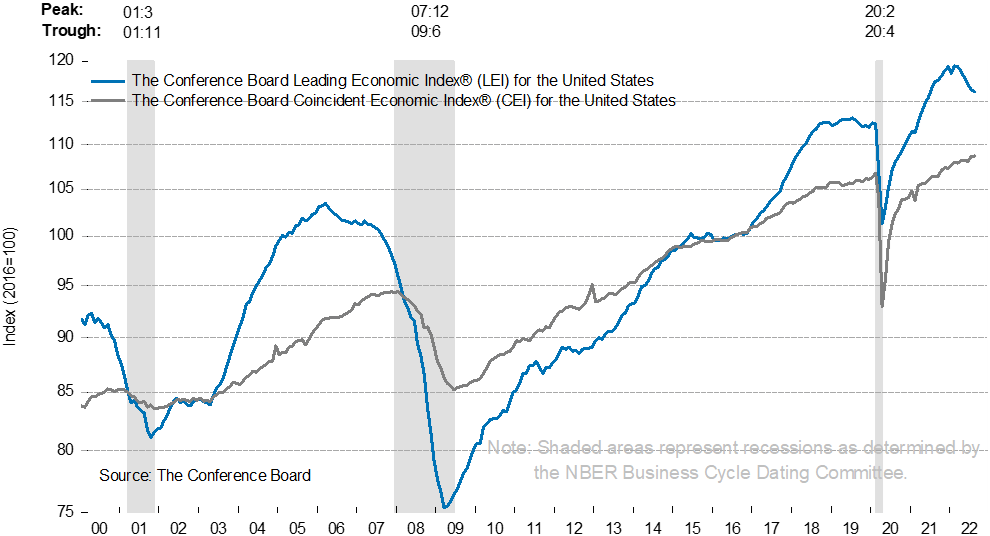
The management expects the loan portfolio to grow by 16%-18% this year, as mentioned in the earnings presentation. Considering the factors mentioned above, I’m expecting the loan portfolio to grow by 17.9%, at the higher end of management’s guidance. I’m expecting loan growth to revert to the historical range next year. Meanwhile, I’m expecting deposits to grow mostly in line with loans. The following table shows my balance sheet estimates.
| FY18 | FY19 | FY20 | FY21 | FY22E | FY23E | |||||
| Financial Position | ||||||||||
| Net Loans | 32,074 | 34,420 | 37,771 | 41,152 | 48,500 | 52,498 | ||||
| Growth of Net Loans | 11.8% | 7.3% | 9.7% | 9.0% | 17.9% | 8.2% | ||||
| Other Earning Assets | 7,124 | 7,638 | 11,325 | 16,442 | 12,409 | 13,432 | ||||
| Deposits | 35,440 | 37,324 | 44,863 | 53,351 | 56,539 | 61,199 | ||||
| Borrowings and Sub-Debt | 581 | 1,235 | 1,125 | 701 | 1,097 | 1,119 | ||||
| Common equity | 4,424 | 5,018 | 5,269 | 5,837 | 6,081 | 7,101 | ||||
| Book Value Per Share ($) | 30.3 | 34.3 | 37.0 | 40.8 | 42.7 | 49.9 | ||||
| Tangible BVPS ($) | 27.1 | 31.1 | 33.7 | 37.5 | 39.4 | 46.6 | ||||
|
Source: SEC Filings, Author’s Estimates (In USD million unless otherwise specified) |
||||||||||
Normalized Provisioning Likely
East West Bancorp’s net provision expense remained much below normal during the first half of this year. Classified loans made up 0.9% of total loans, while allowances made up 1.2% of total loans at the end of June 2022, as mentioned in the presentation. East West Bancorp may find this allowance coverage to be a bit tight in the next few quarters because of high inflation which can stimulate bankruptcies in some cases. Further, the loan additions discussed above will require provisioning for expected loan losses.
Overall, I’m expecting the net provision expense to increase to a normal level in the second half of the year. I’m expecting the net provision expense to be 0.22% of total loans in every quarter till the end of 2023, which is the same as the average for the last five years.
Earnings Likely to Surge by 25%
The anticipated margin expansion and loan additions will drive earnings for the next year and a half. On the other hand, provision normalization will restrict earnings growth. Overall, I’m expecting East West Bancorp to report earnings of $7.59 per share, up 25% year-over-year. For 2023, I’m expecting earnings to grow by 18% to $8.97 per share. The following table shows my income statement estimates.
| FY18 | FY19 | FY20 | FY21 | FY22E | FY23E | |||||
| Income Statement | ||||||||||
| Net interest income | 1,387 | 1,468 | 1,377 | 1,532 | 1,913 | 2,234 | ||||
| Provision for loan losses | 64 | 99 | 211 | (35) | 82 | 116 | ||||
| Non-interest income | 211 | 209 | 236 | 286 | 316 | 321 | ||||
| Non-interest expense | 714 | 735 | 716 | 796 | 786 | 824 | ||||
| Net income – Common Sh. | 704 | 674 | 568 | 873 | 1,081 | 1,276 | ||||
| EPS – Diluted ($) | 4.81 | 4.61 | 3.97 | 6.10 | 7.59 | 8.97 | ||||
|
Source: SEC Filings, Author’s Estimates (In USD million unless otherwise specified) |
||||||||||
In my last report on East West Bancorp, I estimated earnings of $6.91 per share for 2022. I’ve increased my earnings estimate mostly because I’ve raised my estimate for the net interest margin.
Actual earnings may differ materially from estimates because of the risks and uncertainties related to inflation, and consequently the timing and magnitude of interest rate hikes. Further, a stronger or longer-than-anticipated recession can increase the provisioning for expected loan losses beyond my estimates.
Maintaining a Buy Rating
Given the earnings outlook, I’m expecting the company to increase its dividend by $0.05 per share to $0.45 per share in the first quarter of 2023. The earnings and dividend estimates suggest a payout ratio of 20% for 2023, which is close to the five-year average of 23%. Based on my dividend estimate, East West Bancorp is offering a forward dividend yield of 2.7%.
I’m using the historical price-to-tangible book (“P/TB”) and price-to-earnings (“P/E”) multiples to value East West Bancorp. The stock has traded at an average P/TB ratio of 1.87 in the past, as shown below.
| FY17 | FY18 | FY19 | FY20 | FY21 | Average | |
| T. Book Value per Share ($) | 23.1 | 27.1 | 31.1 | 33.7 | 37.5 | |
| Average Market Price ($) | 56.0 | 62.4 | 46.9 | 38.2 | 73.9 | |
| Historical P/TB | 2.42x | 2.30x | 1.51x | 1.13x | 1.97x | 1.87x |
| Source: Company Financials, Yahoo Finance, Author’s Estimates | ||||||
Multiplying the average P/TB multiple with the forecast tangible book value per share of $39.4 gives a target price of $73.6 for the end of 2022. This price target implies an 8.9% upside from the September 23 closing price. The following table shows the sensitivity of the target price to the P/TB ratio.
| P/TB Multiple | 1.67x | 1.77x | 1.87x | 1.97x | 2.07x |
| TBVPS – Dec 2022 ($) | 39.4 | 39.4 | 39.4 | 39.4 | 39.4 |
| Target Price ($) | 65.8 | 69.7 | 73.6 | 77.6 | 81.5 |
| Market Price ($) | 67.6 | 67.6 | 67.6 | 67.6 | 67.6 |
| Upside/(Downside) | (2.8)% | 3.1% | 8.9% | 14.7% | 20.6% |
| Source: Author’s Estimates |
The stock has traded at an average P/E ratio of around 12.2x in the past, as shown below.
| FY17 | FY18 | FY19 | FY20 | FY21 | Average | |
| Earnings per Share ($) | 3.47 | 4.81 | 4.61 | 3.97 | 6.10 | |
| Average Market Price ($) | 56.0 | 62.4 | 46.9 | 38.2 | 73.9 | |
| Historical P/E | 16.2x | 13.0x | 10.2x | 9.6x | 12.1x | 12.2x |
| Source: Company Financials, Yahoo Finance, Author’s Estimates | ||||||
Multiplying the average P/E multiple with the forecast earnings per share of $7.59 gives a target price of $92.7 for the end of 2022. This price target implies a 37.1% upside from the September 23 closing price. The following table shows the sensitivity of the target price to the P/E ratio.
| P/E Multiple | 10.2x | 11.2x | 12.2x | 13.2x | 14.2x |
| EPS 2022 ($) | 7.59 | 7.59 | 7.59 | 7.59 | 7.59 |
| Target Price ($) | 77.5 | 85.1 | 92.7 | 100.3 | 107.9 |
| Market Price ($) | 67.6 | 67.6 | 67.6 | 67.6 | 67.6 |
| Upside/(Downside) | 14.6% | 25.9% | 37.1% | 48.3% | 59.6% |
| Source: Author’s Estimates |
Equally weighting the target prices from the two valuation methods gives a combined target price of $83.2, which implies a 23.0% upside from the current market price. Adding the forward dividend yield gives a total expected return of 25.7%. Hence, I’m maintaining a buy rating on East West Bancorp.
Be the first to comment