


Khosrork/iStock via Getty Images
Introduction
I’ve written about T Rowe Price (NASDAQ:TROW) stock twice so far this year. The first time was soon after I sold the stock back in January in my article “6 Financial Stocks I Recently Sold, And 2 I Will Hold For The Long Term” and TROW was one of the stocks I sold. The three factors that I highlighted in that article for the sale were (1) Deep Price Cyclicality. TROW had a history of very big stock price fluctuations, even if earnings didn’t fluctuate all that dramatically.
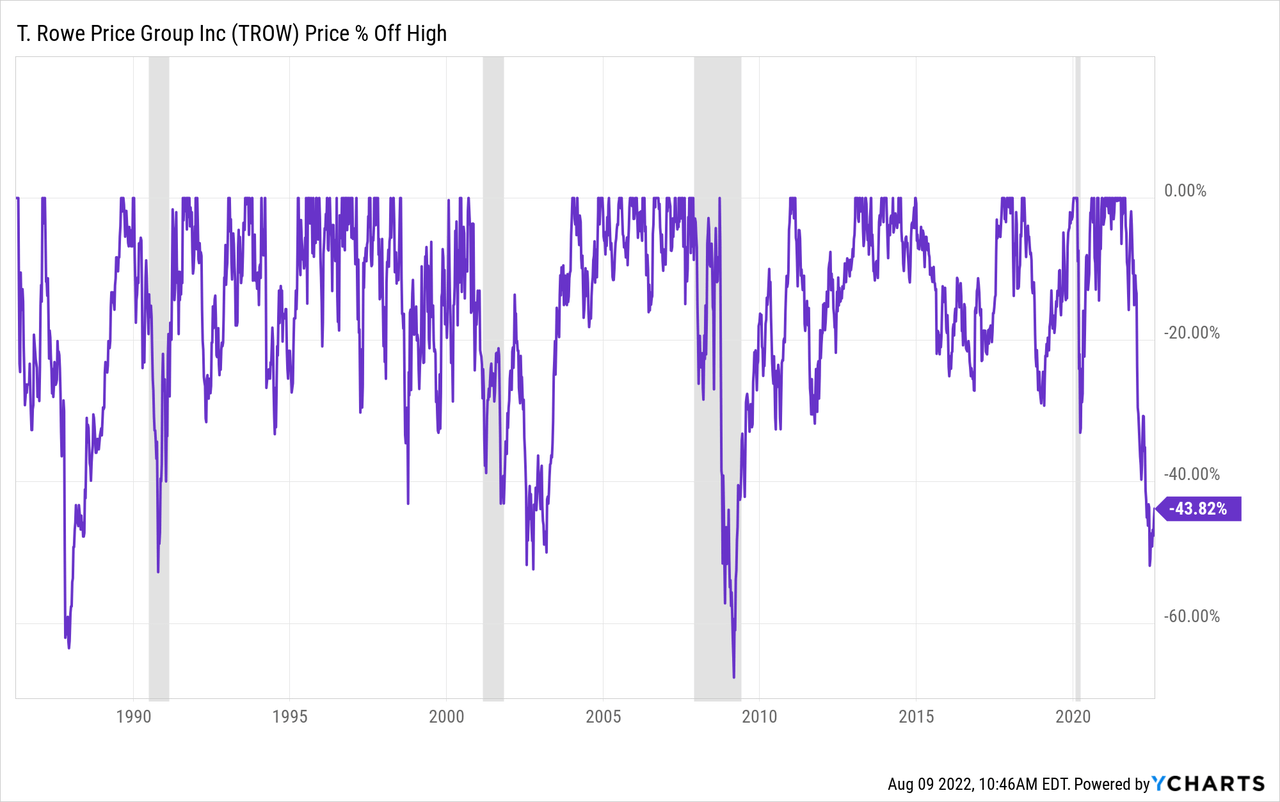
In the price drawdown chart above we can see that TROW stock has experienced many price declines of -50% or more in the past, so that’s something we should expect to happen on occasion (particularly during recessions) with this stock. I preferred not to experience such a big drawdown if it could be avoided.
The second factor that caused me to sell was that back in January I had determined that we were likely experiencing late-cycle dynamics in the market and eventually in the economy as well. Here is what I had to say on this topic in January:
The main upshot here is that many market participants are focused on the Fed. And even though the Fed doesn’t really matter very much in this case, it is unlikely they will come to the rescue and totally reverse policy to save the markets. Basically the “Fed Put” is gone, but, I wouldn’t assume we have dramatically higher rates anytime soon, either. At least for the near-term, the market doesn’t care (or doesn’t recognize) there is no guarantee we’ll see significantly higher rates or a steeper yield curve any time soon. The market thinks significantly higher rates are coming and that might add some fuel to a market sell-off even though it doesn’t really matter that much to most of the economy right now.
I think we have seen that Fed rate hikes have yet to slow down the overall economy, though there are pockets like durable goods and housing that are beginning to show signs of weakness. One thing is for certain, and that is there is no more “Fed Put” for markets.
The third factor was the removal of fiscal stimulus:
There were two types of direct stimulus to the American people in 2021, one type was quick “one-time” payments, of which, there were two: one in January and one in March. This was the equivalent of giving someone, say $4,000, twice, and then not giving them any more money. But there were two additional forms of ongoing fiscal stimulus that directly affected many Americans. The enhanced child tax credit, and the pause on student loan repayments. These were different in that they were ongoing forms of stimulus, that for the average family with two kids who have student loans, amounted to roughly $400 per month each. One of them, the child tax credit created money that flowed into a household in the form of increased income of about $400 per month, and the other prevented an approximate $400 outflow per month to pay back student loans. Combined, these two forms of stimulus are far more important, and underrated by the market than they should be. This is an amount roughly equal to 20% of the affected families’ take-home pay. One can only imagine the percentage of disposable income those two forms of stimulus accounted for in the second half of 2021. This stimulus was, without a doubt, a very, very high percentage of disposable income for many people in 2021.
Near the end of December, we got the news from Senator Joe Manchin that he would not support the bill that would extend the enhanced tax credit. Once that happened at the same time the Fed speakers dramatically turned into inflation hawks, I put my trailing stops on. Biden, soon after Manchin’s decision, extended the student loan pause until May, so that potential removal of stimulus was delayed, but we still don’t know how long the delay will last, and in May, it could be gone.
As far as I’m concerned, the potential for this fiscal stimulus boom/bust cycle is far, far, greater than any Fed interest rate decision. The Fed would have to hike short-term rates to double digits to have the same effect on working families and the economy as the removal of this stimulus will have. All that extra demand for goods from the stimulus that has been contributing to inflation will disappear in a few quarters if the tax credit isn’t extended and borrowers have to start paying back their students loans. Inflation will quickly be replaced by disinflation, a bear market, and probably a recession. This is the real danger to the price of these stocks (and many others).
Since January, we had the Russian invasion of Ukraine, which has caused an energy price spike globally and contributed to inflation lasting longer than expected. Additionally, the student loan repayment pause was extended to the end of this month, so that negative catalyst still hasn’t kicked in, yet. T. Rowe’s earnings are sensitive to moves in market prices, and because the market eventually started pricing in some of the boom/bust dynamics and slowdowns ahead of time. This is due to the markets’ forward-looking nature, T. Rowe Price stock sold off pretty dramatically since I took profits on 1/12/22.
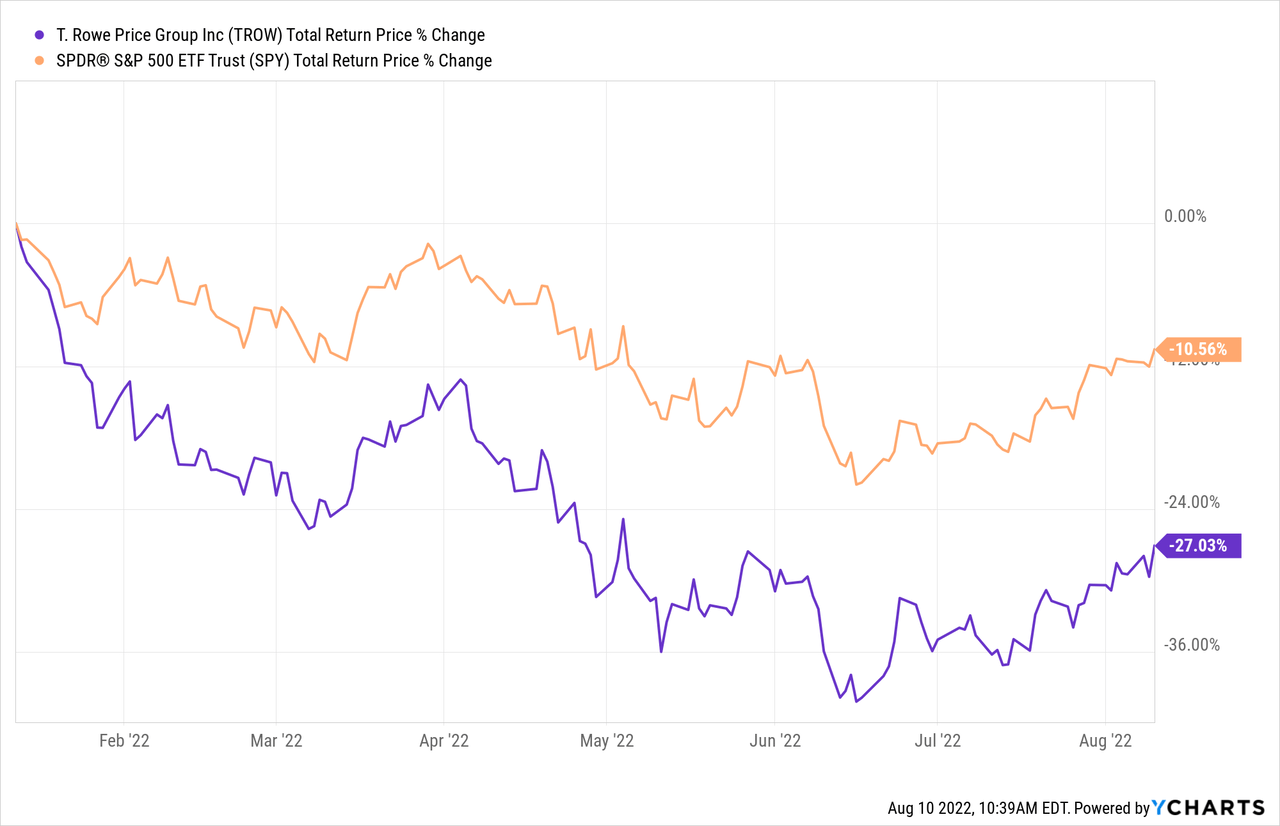
At one point the stock was down -40%, about double the decline of the S&P 500, so I think I made the right call back in January to take profits.
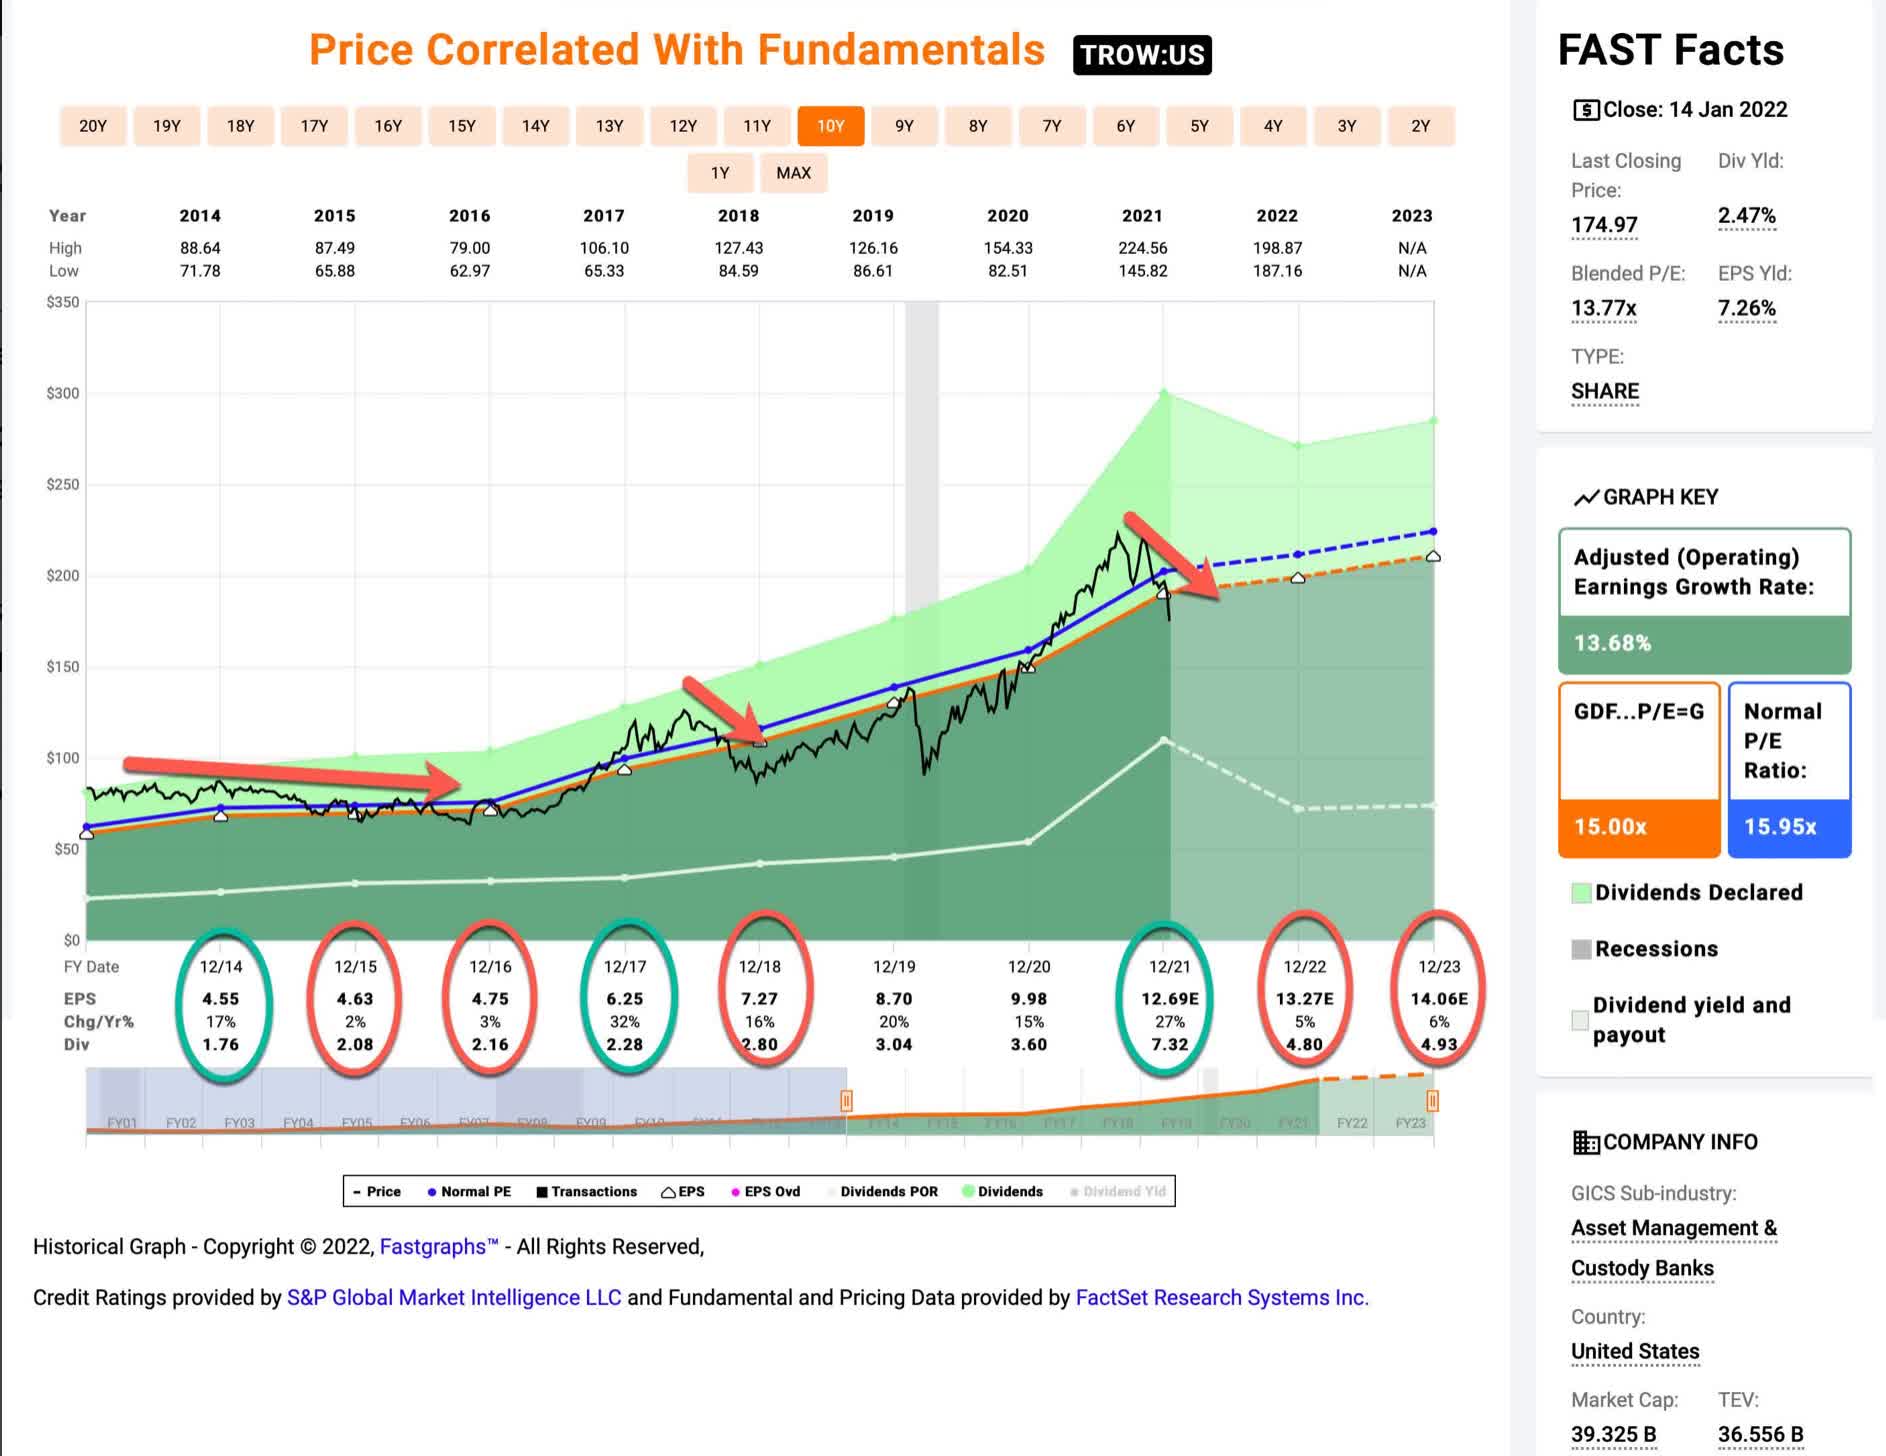
Below I am going to post two FAST Graphs. The first one is a copy of one I posted in my marketplace service, The Cyclical Investor’s Club, soon after we sold TROW in January. The second is a current FAST Graph from today. Note the change in expected earnings per share for 2022.
FAST Graphs
Back in January, I noted the slowing EPS growth expectations could send the price of the stock down a lot. At the time EPS was expected to be $13.27.
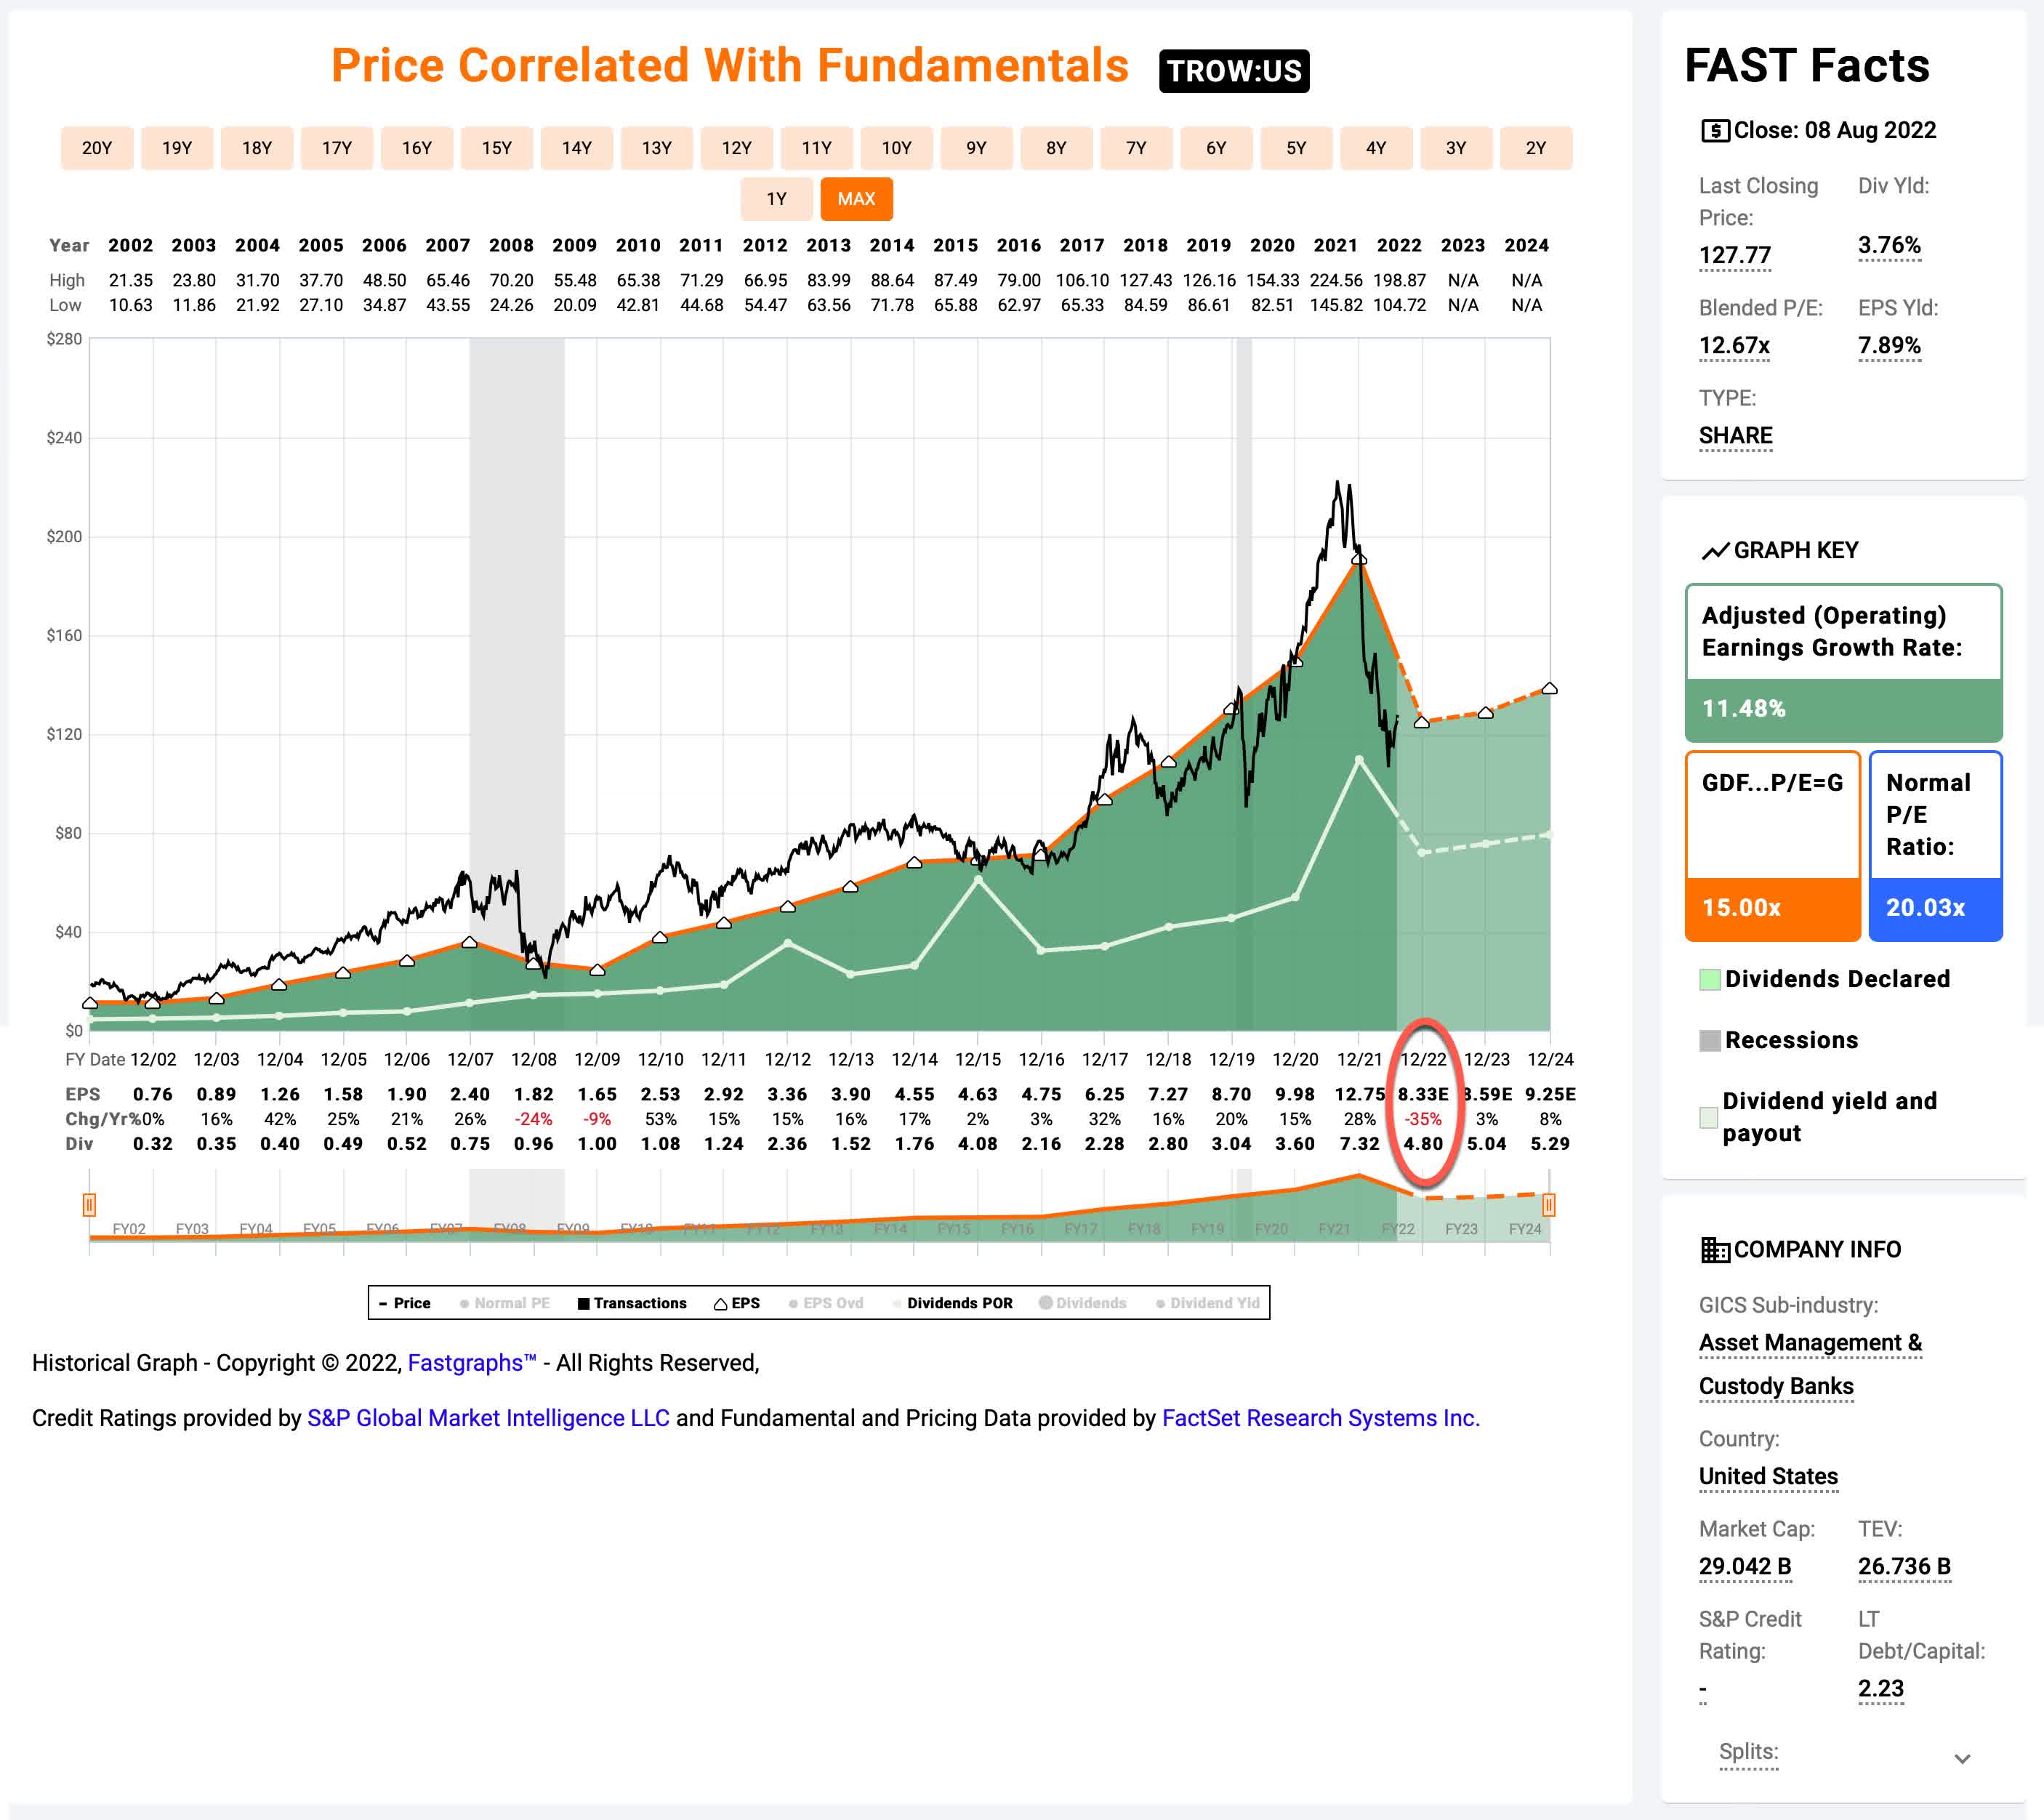
FAST Graphs
Since January, analysts have lowered their EPS expectations from $13.27 to $8.33. This is a huge decline. When I last wrote about TROW in May in my article “T. Rowe Price: Is It Time To Dip One’s Toes In? 3 Ways To Value The Stocks” expectations were $10.40 per share. In that article, I shared a factor I call the “Recession P/E”, which is the P/E the stock experienced during past recessions and I used that as a guide for determining a buy price because EPS estimates were unreliable. I said that I was waiting for the stock price to reach about $105 per share, if earnings expectations stayed the same, before I would consider buying the stock. Well, earnings expectations have come down a lot since then, so I think it’s time to revisit the stock.
On one hand, I was aiming for such a low price because I expected EPS to fall. But now expectations have fallen farther than I expected, and the declines are now similar to what they were during the Great Financial Crisis in 2008/9. Because of this, I think it’s time to at least consider that the new EPS estimates are, at the very least, more realistic and therefore we might not need to reference the Recession P/E factor anymore. Additionally, TROW’s peak P/E ratio in late 2007 was about 27, while this time around the peak P/E was about 19, so even if earnings this time around are inflated and perhaps more cyclical, TROW was much more cheaply valued during the peak of the current cycle, perhaps implying that the stock downside could be more limited or could recover more quickly even if it experiences a similar drawdown this time around.
Putting all this together, I think it’s reasonable to assume analysts are now closer enough to reality with their estimates to use them without the recession P/E factor this time, so that’s what I will do in this updated article.
T. Rowe Stock – My Basic Valuation Process
I always start every stock valuation with the question: How Cyclical Are Earnings? The answer to that question will help determine 1) if this is a stock with enough data I can confidently analyze, 2) if it does have enough data, what sort of analytical technique I should use, and 3) if there are any particular patterns I should be aware of.
As shown in the previous FAST Graph, TROW historically has earnings declines during recession in -30% to -40% range. I consider stocks that have historical earnings declines less than -50% to not be deeply cyclical, so my typical “full-cycle earnings” valuation process is appropriate for them, and that’s what I’ll use in this article.
Market Sentiment Return Expectations
As part of the analysis, I calculate what I consider to be the two main drivers of future total returns: Market sentiment returns and business returns. I then combine those expected returns together in the form of a 10-year CAGR expectation and use that to value the stock.
In order to estimate what sort of returns we might expect over the next 10 years, let’s begin by examining what return we could expect 10 years from now if the P/E multiple were to revert to its mean from the previous economic cycle. Since we have had a recent recession (albeit an unusual one) I’m starting this cycle in fiscal year 2015 and running it through 2022’s estimates.
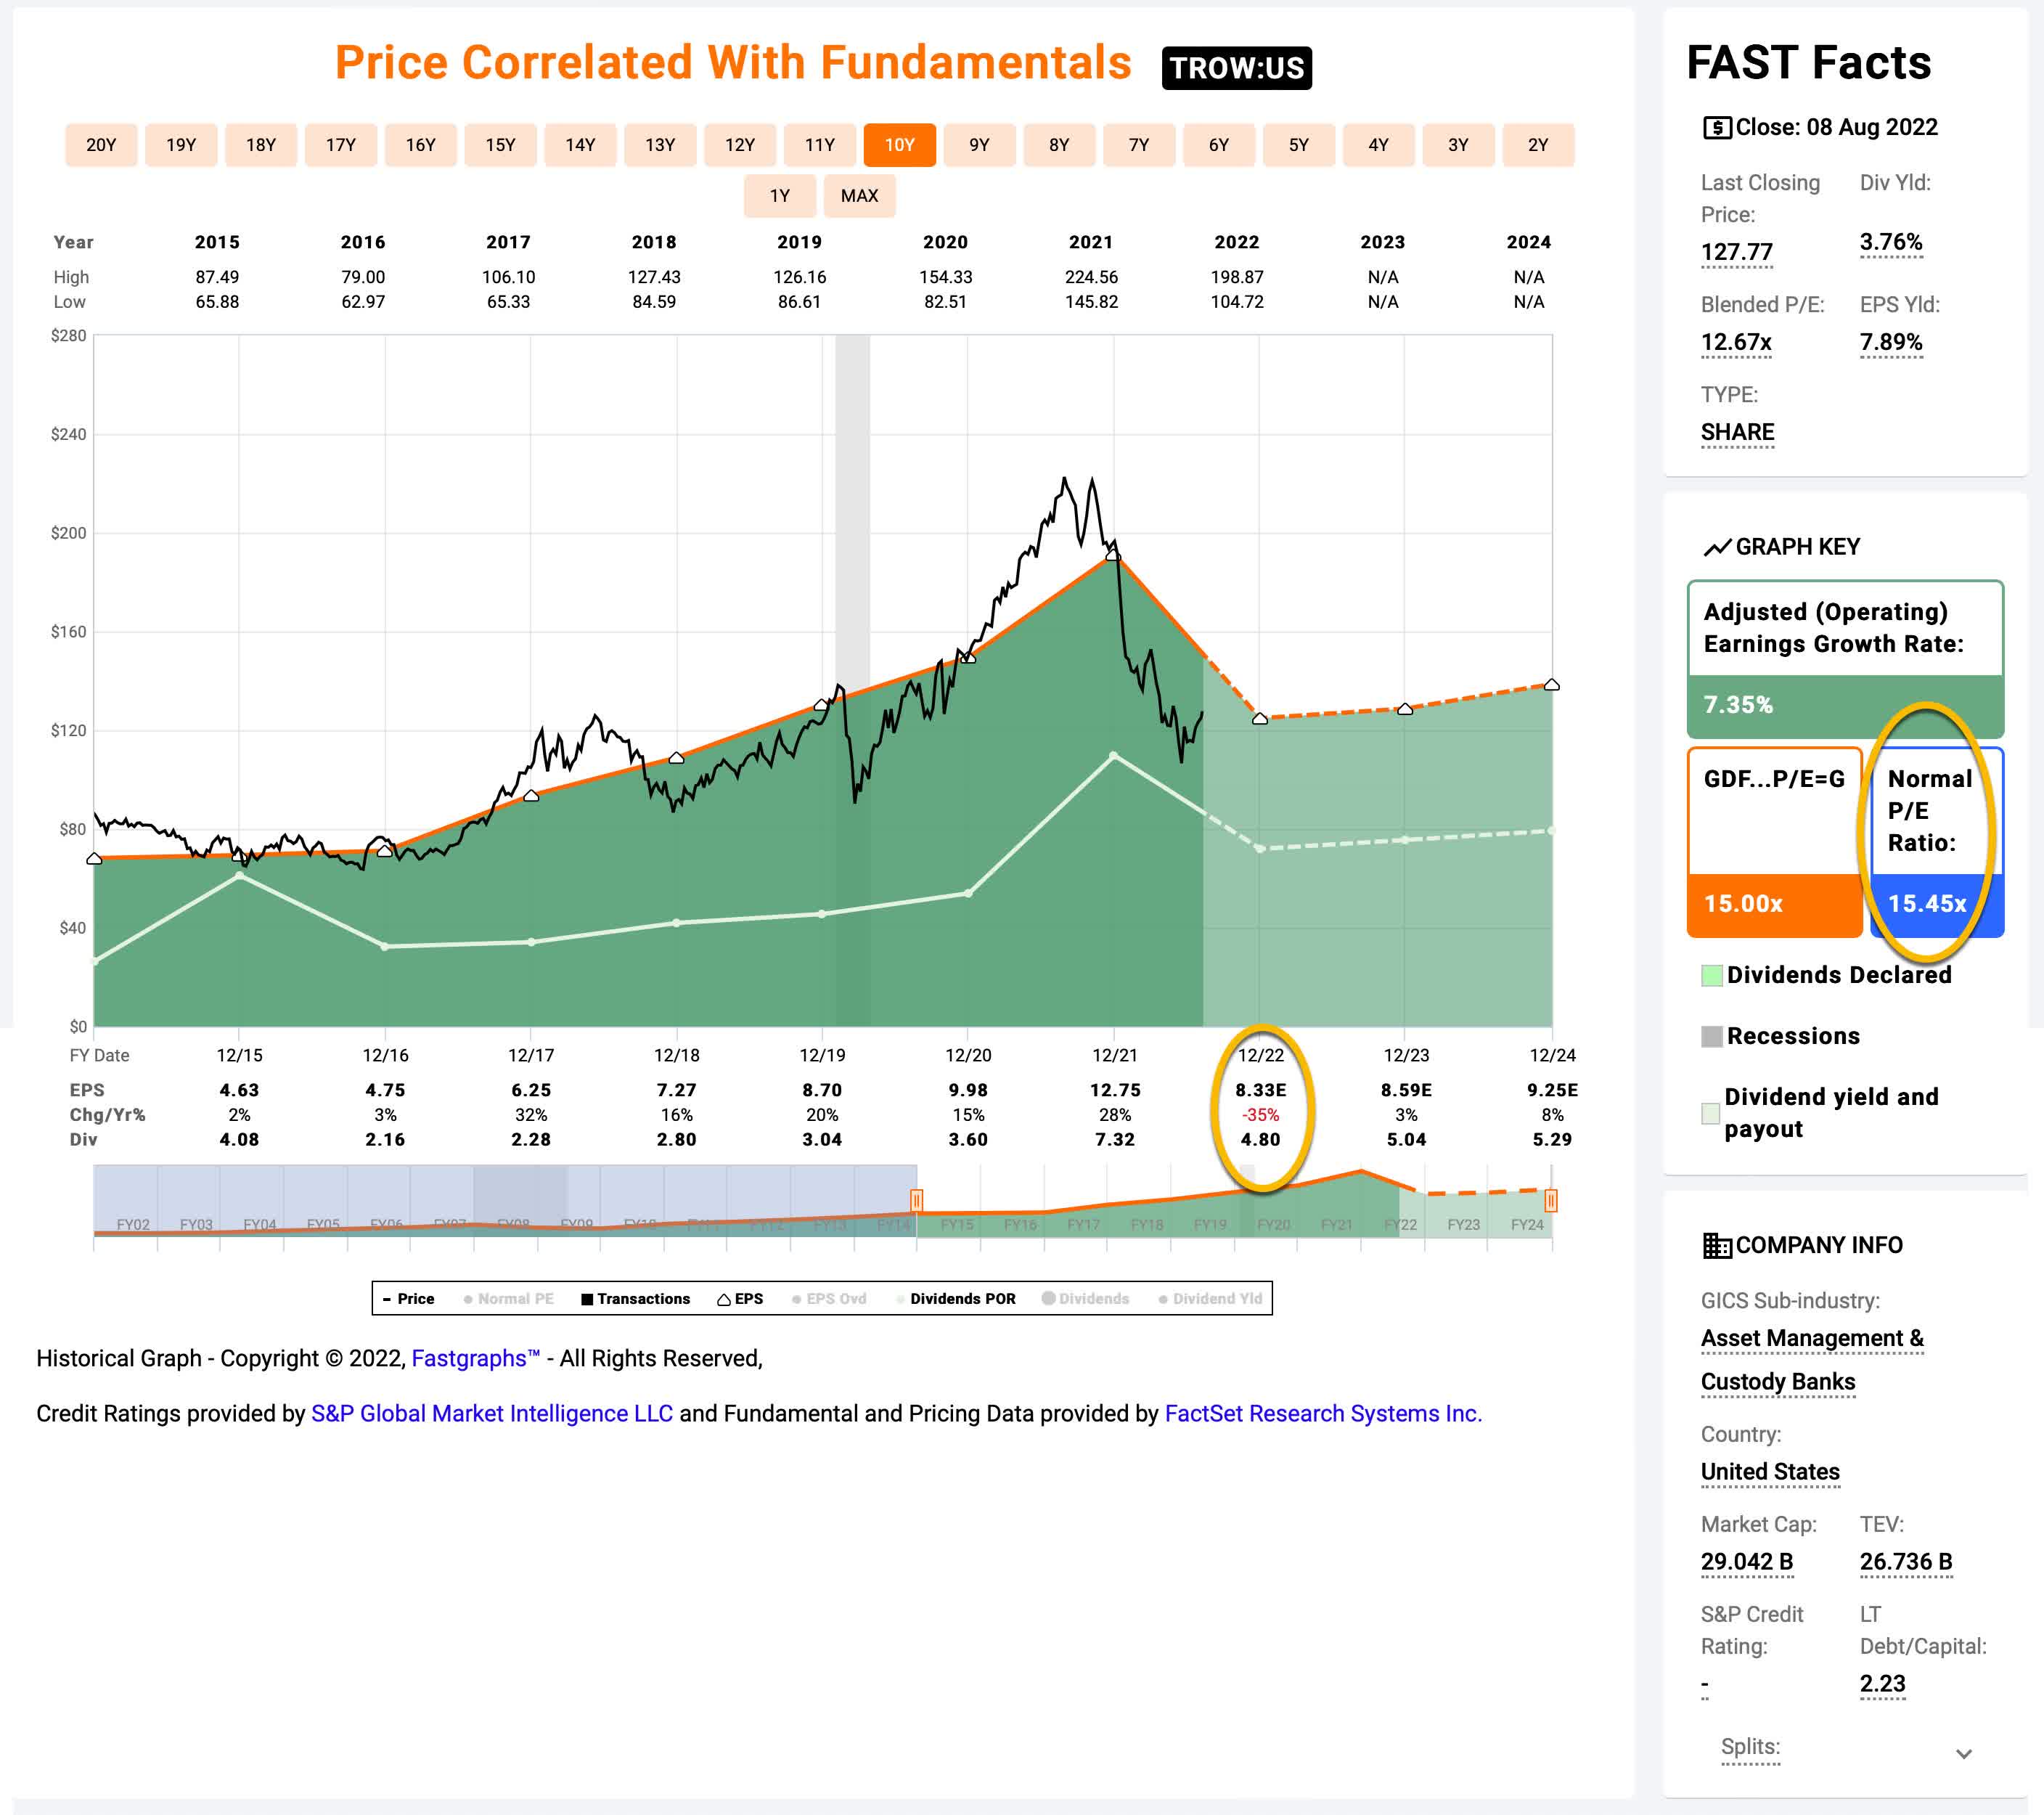
FAST Graphs
TROW’s average P/E from 2015 to the present has been 15.45 (the blue bar circled in gold on the FAST Graph). Using 2022’s forward earnings estimates of $8.33 (also circled in gold), T Rowe has a current P/E of 14.87. If that 14.87 P/E were to revert to the average P/E of 15.45 over the course of the next 10 years and everything else was held the same, TROW’s price would rise and it would produce a 10-Year CAGR of about +0.38%. That’s the annual return we can expect from sentiment mean reversion if it takes ten years to revert. If it takes less time to revert, the gains could be quicker and steeper.
Business Earnings Expectations
We previously examined what would happen if market sentiment reverted to the mean. This is entirely determined by the mood of the market and is quite often disconnected, or only loosely connected, to the performance of the actual business. In this section, I will examine the actual earnings of the business. The goal here is simple: We want to know how much money we would earn (expressed in the form of a CAGR %) over the course of 10 years if we bought the business at today’s prices and kept all of the earnings for ourselves.
There are two main components of this: The first is the earnings yield and the second is the rate at which the earnings can be expected to grow. Let’s start with the earnings yield (which is an inverted P/E ratio, so, the Earnings/Price ratio). The current earnings yield is about +6.72%. The way I like to think about this is, if I bought the company’s whole business right now for $100, I would earn $6.72 per year on my investment if earnings remained the same for the next 10 years.
The next step is to estimate the company’s earnings growth during this time period. I do that by figuring out at what rate earnings grew during the last cycle and applying that rate to the next 10 years. This involves calculating the EPS growth rate since 2015, taking into account each year’s EPS growth or decline, and then backing out any share buybacks that occurred over that time period (because reducing shares will increase the EPS due to fewer shares).
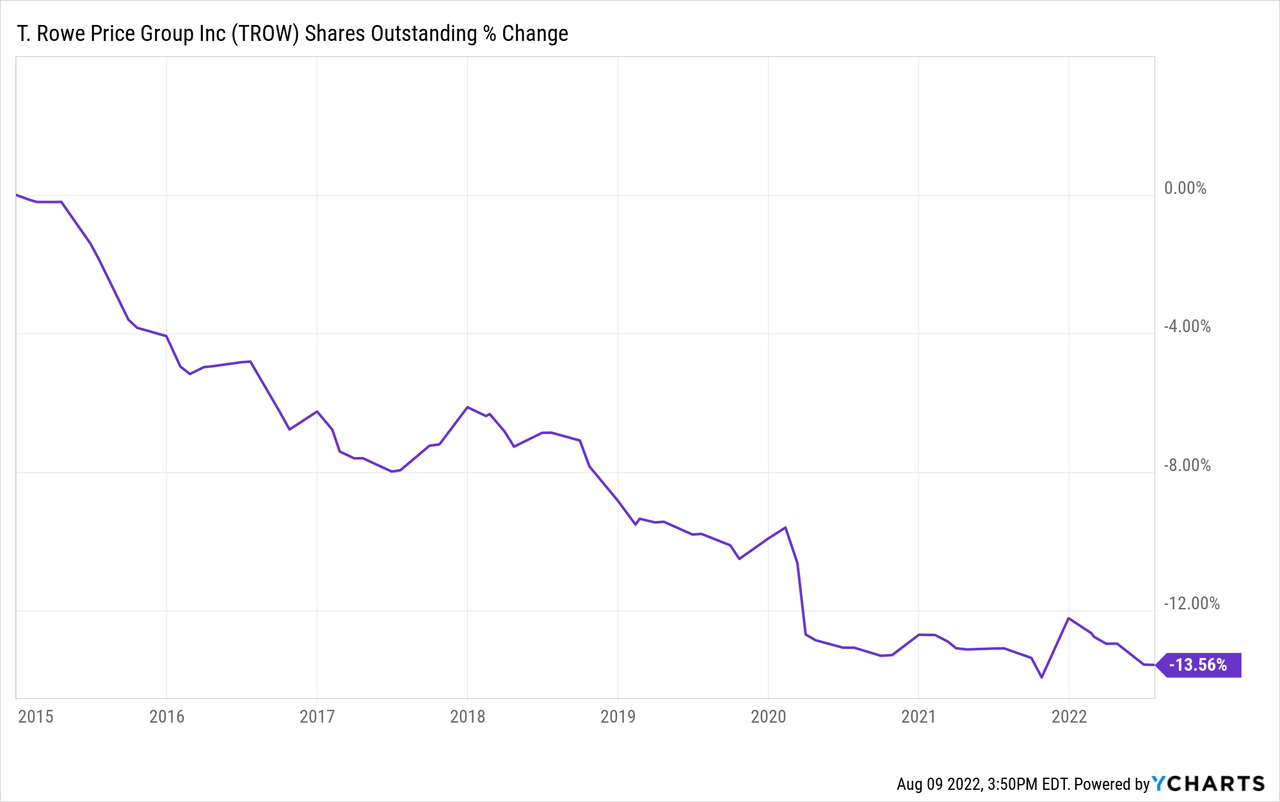
T Rowe has bought back about 13% of the shares outstanding since 2015. I will adjust for those buybacks with my earnings growth estimate. After doing that and including this year’s expected EPS growth decline, I calculate an annual earnings growth rate of about +7.99% over this period.
Next, I’ll apply that growth rate to current earnings, looking forward 10 years in order to get a final 10-year CAGR estimate. The way I think about this is, if I bought T. Rowe’s whole business for $100, it would pay me back $6.72 plus +7.99% growth the first year, and that amount would grow at +7.99% per year for 10 years after that. I want to know how much money I would have in total at the end of 10 years on my $100 investment, which I calculate to be about $205.13 (including the original $100). When I plug that growth into a CAGR calculator, that translates to a +7.35% 10-year CAGR estimate for the expected business earnings returns.
Is T. Rowe Price A Buy, Sell, or Hold?
Potential future returns can come from two main places: Market sentiment returns or business earnings returns. If we assume that market sentiment reverts to the mean from the last cycle over the next 10 years for TROW, it will produce a +0.38% CAGR. If the earnings yield and growth are similar to the last cycle, the company should produce somewhere around a +7.35% 10-year CAGR. If we put the two together, we get an expected 10-year, full-cycle CAGR of +7.73% at today’s price.
My Buy/Sell/Hold range for this category of stocks is: Above a 12% CAGR is a Buy, below a 4% expected CAGR is a Sell, and in between 4% and 12% is a Hold. This puts TROW stock just into my “Hold” range using my standard method of analysis, and pretty much right in the middle of fair value.
What Price Would TROW Become A Buy?
Using the same method that I shared above, assuming earnings estimates don’t change, TROW would become a “buy” at a price of $95.60. If I saw the price hit that level, I would check to see if analysts had changed their earnings expectations, and perhaps be cautious if it hit that price right around the time of an earnings report, but, generally speaking, I would likely be a long-term buyer there. After having analysts be overly optimistic back in January, now I think they are much more realistic about the near-term outlook. That price would also be about a -60% drawdown off the peak price, which has typically been a very good time to buy the stock even if it eventually falls a little more than that before recovering.
To sum up, TROW is trading right in the middle of the fair value range right now. I prefer to have a margin of safety before I buy, though, so I won’t be buying unless the price falls to $95.60.
Be the first to comment