

travelpixpro/E+ via Getty Images
I thought I would write a quick note on yet another signal a U.S. recession is approaching. We all have been reading about and contemplating the 40-year record inversion of Treasury market interest rates. The implications are bad to worse for 2023’s economic outlook. I have written a number of articles on the subject since October, my last effort weeks ago here, which correctly highlighted a change in thinking on long bonds from a bearish to bullish outlook.
I have worked hard in November and December to outline a number of stocks I would avoid right now, assuming one (hopefully final) big wave of equity selling is next, as lower corporate earnings in 2023 have yet to be priced into Wall Street estimates, in my view. Stocks like AT&T (T) here, and Boeing (BA) here are the types of stocks holding too much debt going into this recession I would absolutely sell now, with a total wipeout in earnings likely during 2023-24 given a severe macroeconomic contraction in the U.S.
My latest suggestion is to sell or avoid Dow Inc. (NYSE:DOW), one of the largest chemical companies in the world, with a track record of horrible performance during recessions (particularly pre-Dupont). The company was acquired by DuPont (DD) many years ago. Then, spun off as a publicly-trading independent company in 2019. I previously wrote about Dow as a buy candidate in an August 2020 story here. However, times have changed, and the economic cycle is pointing lower over the next 6-12 months.
Earnings have just begun to decline for this chemical giant in 2022, with a larger drop in both sales and income now projected for 2023 by Wall Street analysts. The question is how deep and long lasting will the 2023 recession be? A rotten span of economic demand could torpedo Dow operating results into far worse shape the presently estimated.
Seeking Alpha – Dow Inc, Wall Street Analyst Estimates for 2022-24, December 8th, 2022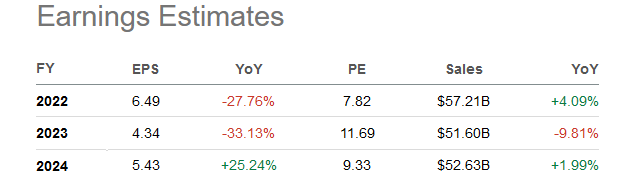
Weak Chart Pattern with Price Turning Over?
The bad news for investors in Dow is the technical trading readout is not very positive, and shares may be ready to experience a sharp downdraft in price. Here me out. The pattern is very similar to the late-2019 momentum setup, just before the worldwide COVID-19 pandemic hit and the stock quote cratered.
On an 18-month review of daily price and volume changes, we find price peaked in April 2022, and has undergone two large waves of selling, the latest ending in October with the general U.S. equity market’s bottom. Over the span of the whole chart, Dow has “underperformed” the S&P 500 total return by -14%. Not especially bad like the Big Tech crashes of 2022, but if your investment goal is positive returns and general outperformance of the market, Dow has failed as an option for your portfolio.
Several data points have me worried another leg lower could start any day now. The standout negative is On Balance Volume (marked with a red arrow) has been horrible since October, mimicking trends over the past year and a half. Volume buying has not been part of the Dow Inc. investment equation since early 2021.
We appear to be sitting at an inflection point, where buyers/sellers will have to make up their minds about the next short-term price movement. This idea is represented by a low reading on the 14-day Average Directional Index. To a degree the ADX score of 12 is similar to the early June setup (circled in blue), just before price imploded -30% over six weeks.
StockCharts.com – Dow Inc, 18 Months of Daily Price & Volume Changes, Author Reference Points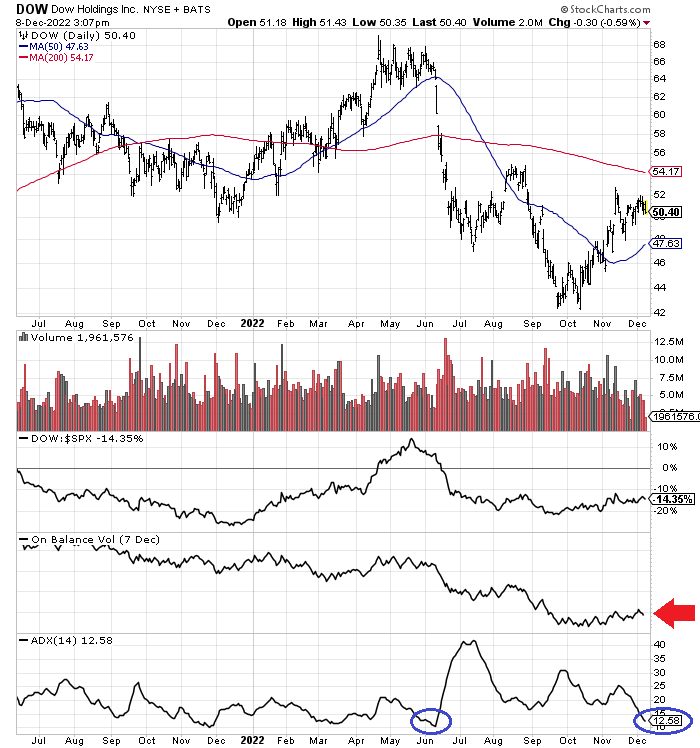
Weak buying interest since November 14th is also a warning signal (boxed in green below on a 3-month closeup snapshot), as volume has dried up and price has stagnated.
StockCharts.com – Dow Inc, 3 Months of Daily Price & Volume Changes, Author Reference Points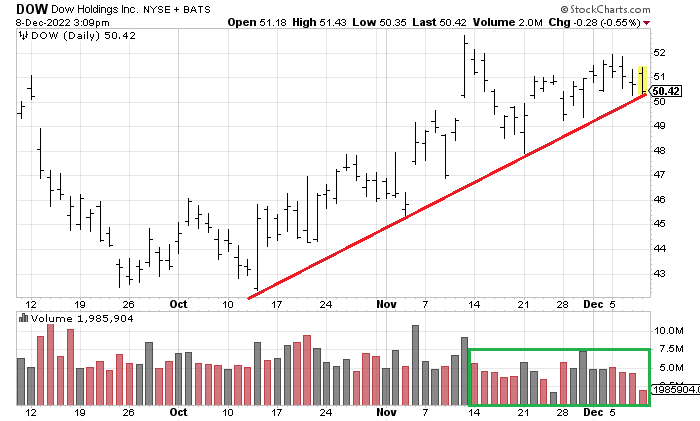
Any drop under $50 a share soon may ignite a rush to the exits by technical traders, as a trendline (red line) drawn through the low trades over nine weeks has identified a nice upsloping price gain. In many respects, the chart pattern is following the late 2019 playbook, which I have drawn below. Once the October to December upmove was reversed, falling through a similar trendline, Dow succumbed to heavy selling into the middle of March 2020.
StockCharts.com – Dow Inc, Daily Price & Volume Changes, Author Reference Points, July to December 2019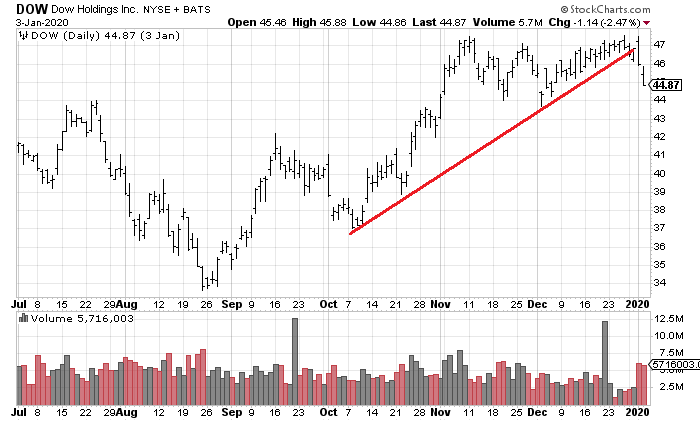
The percentage total return loss from late December to the trough price low was a whopping -60%. Who volunteers their portfolio for a crunching like that into the first few months of 2023? To boot, this decline proved DOUBLE the rate of losses for the equivalent S&P 500 change, as pandemic closures rocked the global economy.
YCharts – Dow Inc, Total Returns vs. S&P 500, Late December 2019 to April 2020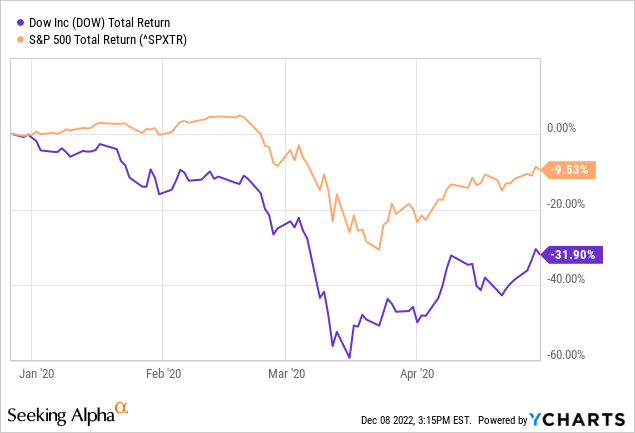
Final Thoughts
Can I guarantee monster losses are next for Dow Inc. shareholders? No, but a major drop is entirely probable if a recession becomes reality in the near future. If you continue to own Dow, you have to understand downside risk today is perhaps the highest since March 2020. You cannot ignore the Treasury yield-curve inversion screaming at investors about an approaching recession and downturn in corporate profitability overall.
Once the $50 price threshold is broken, all kinds of rotten outcomes could play out quickly for Dow investors. Sure, the dividend yield story is great now. But even a rough 6% dividend yield will provide little solace if the stock quote declines 20% or 40% or 60% in the first half of 2023. For those wanting to hold a long position, I would seriously consider placing a stop-sell order in the upper $49 area to sleep better at night. A clear exit strategy makes sense as our recession develops in the weeks ahead. You can step away and repurchase a Dow Inc. position, if you like, when the smoke clears. Food for thought anyway.
Thanks for reading. Please consider this article a first step in your due diligence process. Consulting with a registered and experienced investment advisor is recommended before making any trade.
Be the first to comment