

Dow Jones, Treasury Auction, Straits Times Index, US CPI, Fed – Asia Pacific Indices Briefing
- Wall Street extends recovery as Dow Jones clears key resistance
- APAC equities may follow higher, all eyes on US CPI on Thursday
- Straits Times Index ready to aim for 2018 high after key breakout?
Wednesday’s Wall Street Trading Session Recap
Equities on Wall Street continued recovering this week, with futures tracking the Dow Jones, S&P 500 and Nasdaq 100 up 0.85%, 1.45% and 2.06% respectively. This is leaving the Dow Jones on course for its best week since early December. Meanwhile, the VIX Volatility Index – also known as the market’s preferred fear gauge – is down almost 14% this week.
The economic docket was rather sparse, aside from a 10-year Treasury auction. There, the bid/cover ratio soared to 2.68 versus 2.51 prior. That was the most since June 2020, indicating strong demand. This is as the yield soared to 1.9% from 1.72% previously. That was the highest rate since June 2019. Strong auction demand could indicate that traders have become too aggressive in pricing in a hawkish Fed.
Still, odds of a fifth rate hike from the central bank this year have been tracking equity markets higher this week. All eyes are on US CPI data tomorrow, where headline inflation is expected to continue clocking in at 40-year highs. A strong print risks bringing volatility back into stock markets should traders double down on bets of 5 rate hikes from the Fed this year.
Dow Jones Technical Analysis
Dow Jones futures extended gains above a near-term falling trendline from January as retail traders continued to increase short exposure – as expected. In fact, on the 4-hour chart, prices cleared the early February high at 35676, opening the door to extending gains. That has exposed the 78.6% Fibonacci retracement at 36019 on the way towards 36390. In the event of a turn lower, keep a close eye on the 20- and 50-period Simple Moving Averages for key support.
Dow Jones Futures 4-Hour Chart
Thursday’s Asia Pacific Trading Session
Given the rosy sentiment on Wall Street, Asia-Pacific equities could follow higher. Follow-through may have to wait until after the US CPI report however. A softer outcome could offer the momentum for the ASX 200 and Nikkei 225 to follow up on recent gains. A notable standout in the region, especially amongst ASEAN nations lately, has been Singapore’s Straits Times Index (STI). It is heavily tilted towards bank companies. In a rising interest rate environment, as it is shaping up to be globally, the city-state economy’s benchmark stock index is poised to benefit. Rising lending rates work to boost bank profit margins.
Straits Times Index Technical Analysis
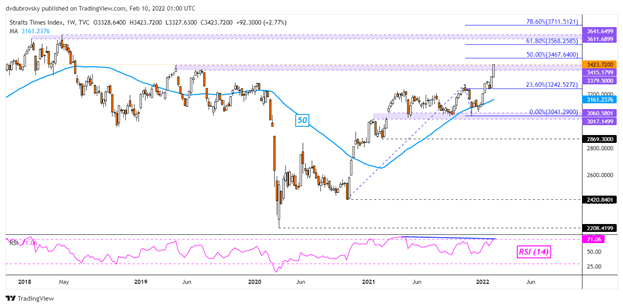
On the weekly chart, the Straits Times Index is working to close above the 2019 high at 3415. That has exposed peaks from 2018. In fact, February is shaping up to be the best month for the STI since March 2021. Immediate resistance appears to be the midpoint of the Fibonacci extension at 3467 before the 61.8% level comes into play at 3568. Keep a close eye on RSI, negative divergence shows early signs of fading upside momentum. In the event of a turn lower, the 50-week SMA could play out as key support.
STI Weekly Chart
— Written by Daniel Dubrovsky, Strategist for DailyFX.com
To contact Daniel, use the comments section below or @ddubrovskyFX on Twitter
Be the first to comment