

DOW JONES, NIKKEI 225, ASX 200 INDEX OUTLOOK:
- Dow Jones, S&P 500 and Nasdaq 100 indexes closed -0.27%, -0.20% and -0.69% respectively
- Stocks pulled back broadly as retail sales figures disappointed. 70% of Dow Jones constituents fell
- Asia-Pacific markets are positioned to trade lower. Investors awaited the FOMC meeting for clues about the tapering timeline
Retail Sales, PPI, FOMC, Oil, Asia-Pacific Week-Ahead:
The Dow Jones Industrial Average pulled back for a second day as market weighed a lower-than-expected US retail sales figure alongside higher PPI (chart below). Consumer spending on autos, furniture, electronics and materials fell in May, resulting in a 1.3% MoM decline in retail sales. This may be attributed to a shift in spending habits as more people are going outdoor as the pandemic eases.
Meanwhile, the producer price index (PPI) climbed 0.8% MoM, more than a baseline forecast of 0.6%. This reflects that prices of goods at factory doors are rising at a faster-than-expected pace, echoing readings from China and Japan earlier this months. PPI is widely perceived as a leading indicator for CPI, as producers may intend to transfer higher input costs to finished products, As a result, inflationary pressures may be seen in the months to come.
Market sentiment tilted to the cautious side as investors awaited clues about the Fed’s tapering timeline in a two-day FOMC meeting. Although the central bank is largely expected to keep its policy rate unchanged until 2023, the likelihood of a gradual scaling back of its monthly bond purchase program has risen recently. This came against the backdrop of mounting inflationary pressures, ample liquidity conditions and a robust economic recovery. The DXY US Dollar index traded steadily at 90.50, and the 10-year Treasury yield was hovering at around the 1.50% mark.
US Retail Sales vs PPI – Past 12 Months
Source: Bloomberg, DailyFX
On the commodities front,WTI crude oil prices surged 1.79% to a fresh two-and-half year high of $72.44. The underlying demand for energy remains robust while supply remains constrained. US daily air travellers surpassed 2 million for the first time since the pandemic, underscoring strong demand for fuel as the peak of the summer travel season arrives. Higher oil prices may bolster commodity-linked currencies such as the Canadian Dollar and Norwegian Krone. A meeting between US and Russian leaders today will be closely watched by oil traders.
Asia-Pacific markets are positioned to open on the back foot. Futures in Japan, mainland China, Hong Kong, Australia, Taiwan, Thailand and Singapore are in the red, whereas those in South Korea are in the green. Looking ahead, China’s retail sales and industrial production data dominate the economic docket today alongside Canadian inflation figures. Find out more from DailyFX economic calendar.
Japan’s Nikkei 225 index looks set to retreat from Tuesday’s high following a sour lead from Wall Street. The technology sector may be vulnerable to a pullback, while cyclical-oriented industrial and energy sectors may show resilience. Japan’s daily Covid-19 cases have fallen over the past weeks, paving the way for removing the state-of-emergency measures in the Tokyo and Osaka area. The index may be positioned for further gains if Covid-related restrictions are eased.
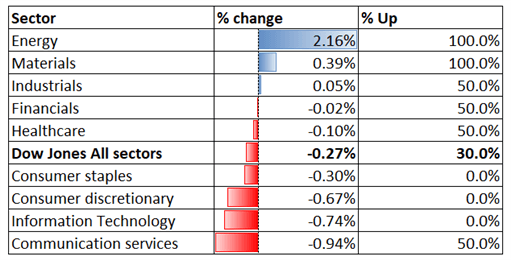
Looking back to Tuesday’s close, 6 out of 9 Dow Jones sectors ended lower, with70% of the index’s constituents closing in the red. Energy (+2.16%) and materials (+0.39%) outperformed, whereas communication services (-0.94%) and information technology (-0.74%) trailed behind.
Dow Jones Sector Performance 16-06-2021
Source: Bloomberg, DailyFX
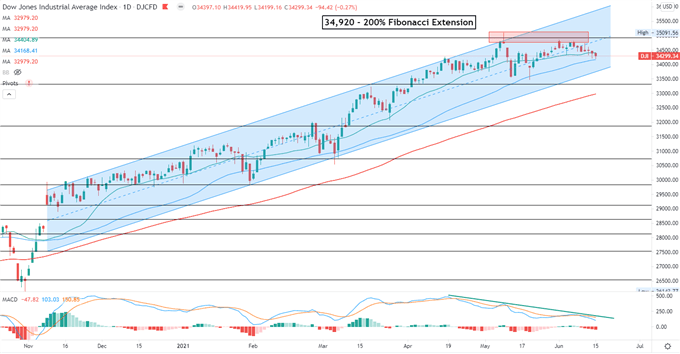
Dow Jones Index Technical Analysis
The Dow Jones index failed to breach the 200% Fibonacci extension level (34,920) for a second time and has since entered a technical correction. This has likely resulted in a “Double Top” pattern, which may be viewed as a bearish trend-reversal indicator. Prices remain within an “Ascending Channel” formed since early November, the ceiling and the floor of which serve as key support and resistance levels respectively. Bearish MACD divergence suggests that bullish momentum is weakening.
Dow Jones Index – Daily Chart
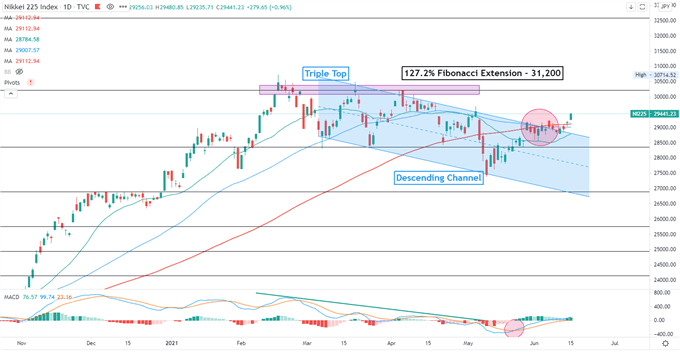
Nikkei 225 Index Technical Analysis:
The Nikkei 225 index breached above the ceiling of the “Descending Channel” and has opened the door for further gains. A key resistance level can be found at 31,200- the 127.2% Fibonacci extension. Prices have also breached above the 50- and 100-day SMA line, suggesting that near-term trend has likely turned bullish The MACD oscillator is trending higher, underscoring bullish momentum.
Nikkei 225 Index – Daily Chart
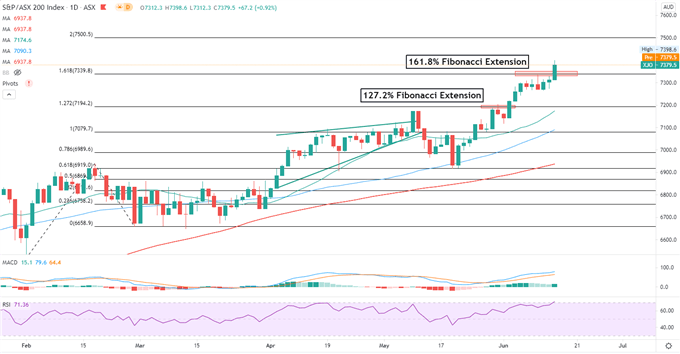
ASX 200 Index Technical Analysis:
The ASX 200 index breached above a key resistance level of 7,340 and closed at a fresh record on Tuesday. Prices formed consecutive higher highs and higher lows, marking a classic uptrend. The RSI oscillator has reached the overbought threshold of 70, hinting that the index may be temporarily overbought and may entice profit taking. The MACD indicator formed a bullish crossover and trended higher, suggesting that upward momentum is dominating.
ASX 200 Index – Daily Chart
— Written by Margaret Yang, Strategist for DailyFX.com
To contact Margaret, use the Comments section below or @margaretyjy on Twitter
Be the first to comment